Where to Buy Property Investments in Sussex: Yields to 6.0%
Sussex splits three ways for house prices, from East Sussex at £314,949 sold to Mid Sussex at £436,223. Top gross yields reach 6.0% in Brighton. Here is the data.
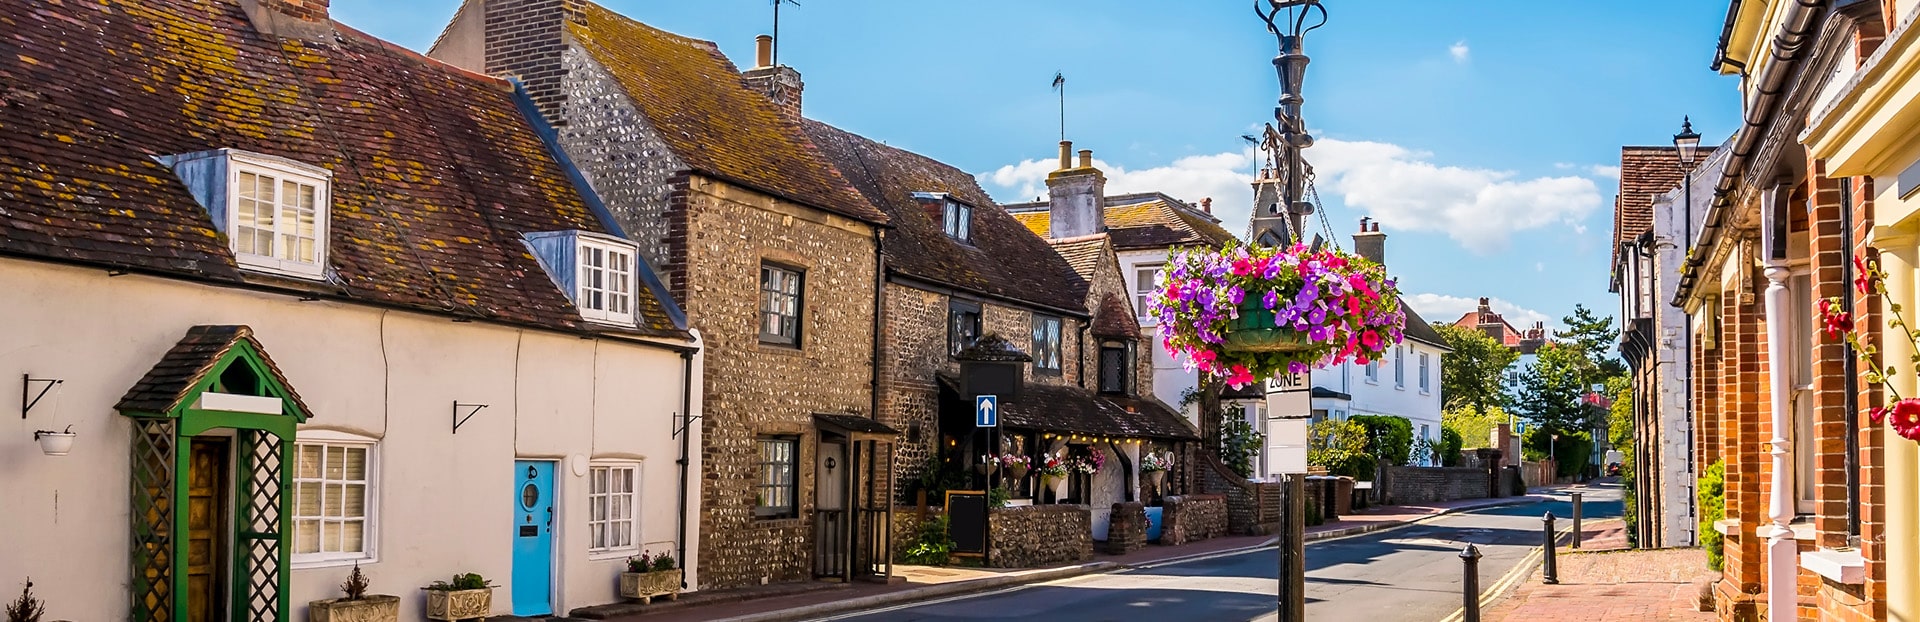
Sussex is a county on the South East coast of England, wrapping along the English Channel from the Kent border in the east across to Hampshire in the west, and reaching inland to the edge of the Surrey commuter belt. For house prices it is really three markets rather than one. East Sussex sold at an average of £314,949 in March 2026, West Sussex at £373,414, and the Mid Sussex district inland at £436,223. Even the cheapest of the three sits above the England average of £289,946, which tells you Sussex is a premium county before you have looked at a single town.
Yields move the opposite way to prices. Brighton leads the towns we cover at a top gross yield of 6.0%, and Eastbourne is close behind at 5.8%, while pricier Chichester tops out at 4.3%. That spread is the whole Sussex story in one line: the seaside towns of East Sussex and the western coast return more rent per pound spent, and the money follows the coast rather than the commuter stations. A 30% deposit on the East Sussex sold-price average works out at roughly £94,000; on the Mid Sussex average it is closer to £131,000, and the rent you can charge does not climb at the same rate.
The five town guides below give the postcode-level yield and asking-price data. Underneath them is the county market history, split honestly across the three Land Registry areas, and the deposit maths by property type.
Article updated: July 2026
Explore Sussex town guides
Compare local yields and sold prices across Sussex's town guides before the county market analysis.
Sussex is not a single Land Registry area. It splits into East Sussex, West Sussex and, sitting inland within West Sussex, the Mid Sussex district around Haywards Heath and Burgess Hill. The three have moved at different speeds, so a county-wide average would flatten a real difference between the coast and the commuter belt. Here is each one on its own numbers.
Area
Avg Sold Price
5-Year Change
30-Year Change
Avg Detached
Avg Flat
East Sussex
£314,949
+6.8%
+487.1%
£561,581
£171,534
West Sussex
£373,414
+11.2%
+472.6%
£663,375
£197,420
Mid Sussex
£436,223
+15.4%
+471.3%
£740,699
£221,011
The 30-year lines all start in a similar place. In January 1995 the average sold price was £53,646 in East Sussex, £65,216 in West Sussex and £76,361 in the Mid Sussex district. Three decades on, all three have risen close to five-fold, so the county as a whole has kept pace with the wider South East. What has changed is the recent gap: over the last five years Mid Sussex is up 15.4% while East Sussex managed only 6.8%, a reminder that the commuter-belt north of the county has pulled ahead of the eastern coast since 2021.
East Sussex
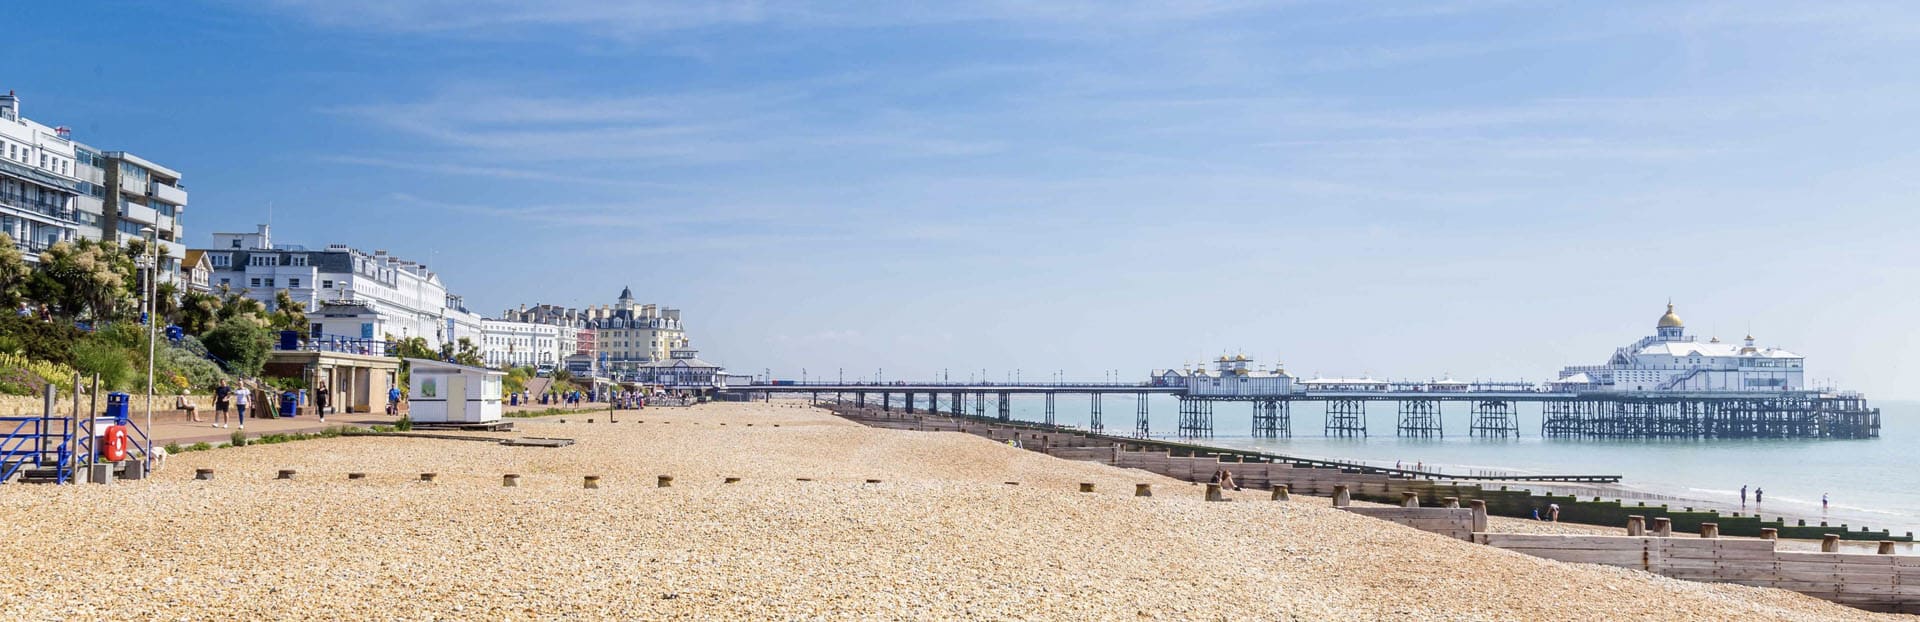
East Sussex runs along the coast from Brighton and Hove east to Eastbourne, Hastings and Rye. The average home sold for £314,949, the cheapest of the three areas, and it has grown the slowest at 6.8% over five years. Prices peaked at £212,866 in December 2007, fell to £169,551 by May 2009, and set a fresh high in late 2022. A detached home averages £561,581 against £171,534 for a flat, so the coast holds the county's most affordable rental stock.
Average property price by type in East Sussex, 1995 to 2026
West Sussex covers the coastal strip from Worthing round to Chichester plus the countryside inland. At £373,414 it sits in the middle on price and has grown 11.2% over five years. Its last-cycle peak was £245,062 in November 2007, with the trough at £192,102 in April 2009, and it too set its record in late 2022. Detached homes average £663,375 and flats £197,420.
Average property price by type in West Sussex, 1995 to 2026
The Mid Sussex district, inland around Haywards Heath and Burgess Hill on the Brighton main line, is the priciest and fastest-growing at £436,223 and 15.4% over five years. It peaked later than the coast in the last cycle, at £284,326 in February 2008, troughed at £213,006 in April 2009, and unusually kept climbing to a record £445,011 as recently as October 2025. Detached homes here average £740,699, flats £221,011.
Average property price by type in Mid Sussex, 1995 to 2026
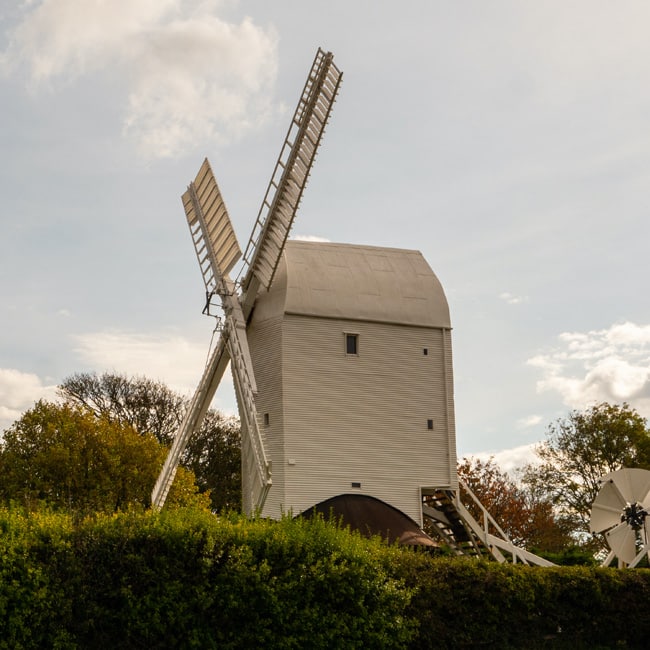
The Clayton windmills on the South Downs, above the Mid Sussex commuter belt
Best areas to invest in Sussex
The five towns we cover in depth rank by top gross yield below. The pattern is consistent with the county market: the two towns returning most rent per pound, Brighton and Eastbourne, both sit on the East Sussex coast, while the higher-priced western and commuter towns give up yield for capital value.
Area
Mean Asking Price
30% Deposit
Top Gross Yield
Brighton
£438,933
£131,680
6.0%
Eastbourne
£331,156
£99,347
5.8%
Crawley
£407,518
£122,255
5.0%
Hastings
£375,731
£112,719
4.7%
Chichester
£543,257
£162,977
4.3%
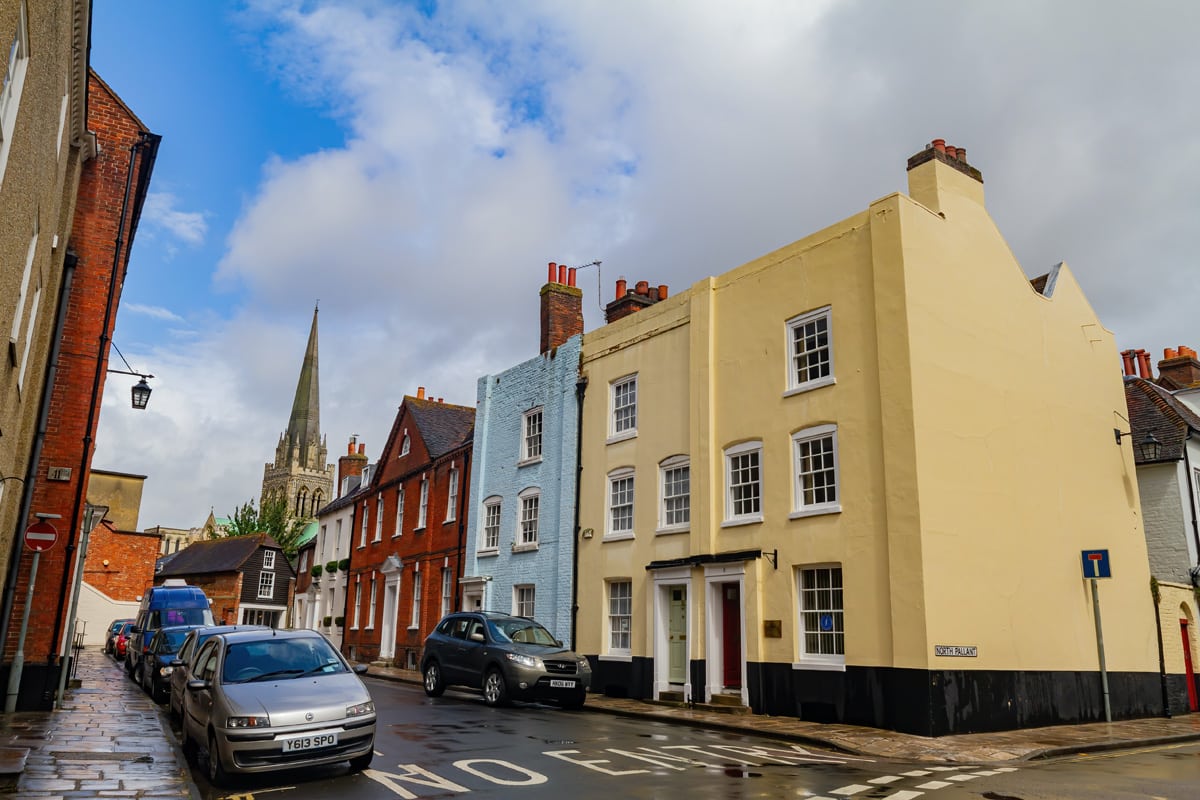
Brighton reaches 6.0% at the top of its postcode range despite the highest asking prices of the coastal towns, which is the student and young-renter market at work rather than anything cheap. Eastbourne gets to 5.8% off a much lower £331,156 asking average, so the deposit is roughly £32,000 lighter than Brighton's for a yield only two-tenths of a point behind. Chichester sits at the other end: the priciest asking average in the group at £543,257 and the lowest top yield at 4.3%, a cathedral-city market that has always leaned on value rather than rent.
Beyond the five guides, the county page also ranks for towns such as Worthing, Bognor Regis, Littlehampton and Horsham on the west coast and around Arun, and for Bexhill, Hailsham and Crowborough in the east. Worthing and Littlehampton are the ones an income-focused buyer tends to look at next after Eastbourne, as coastal West Sussex towns with lower price ceilings than Brighton or Chichester.
Sussex's coastal and commuter markets
Two very different markets sit inside Sussex, and they barely overlap. The south coast runs on tourism, retirement, students and seaside regeneration; the northern belt runs on the trains into London and the jobs around Gatwick. A landlord choosing between them is really choosing between rent and capital growth.
The south coast
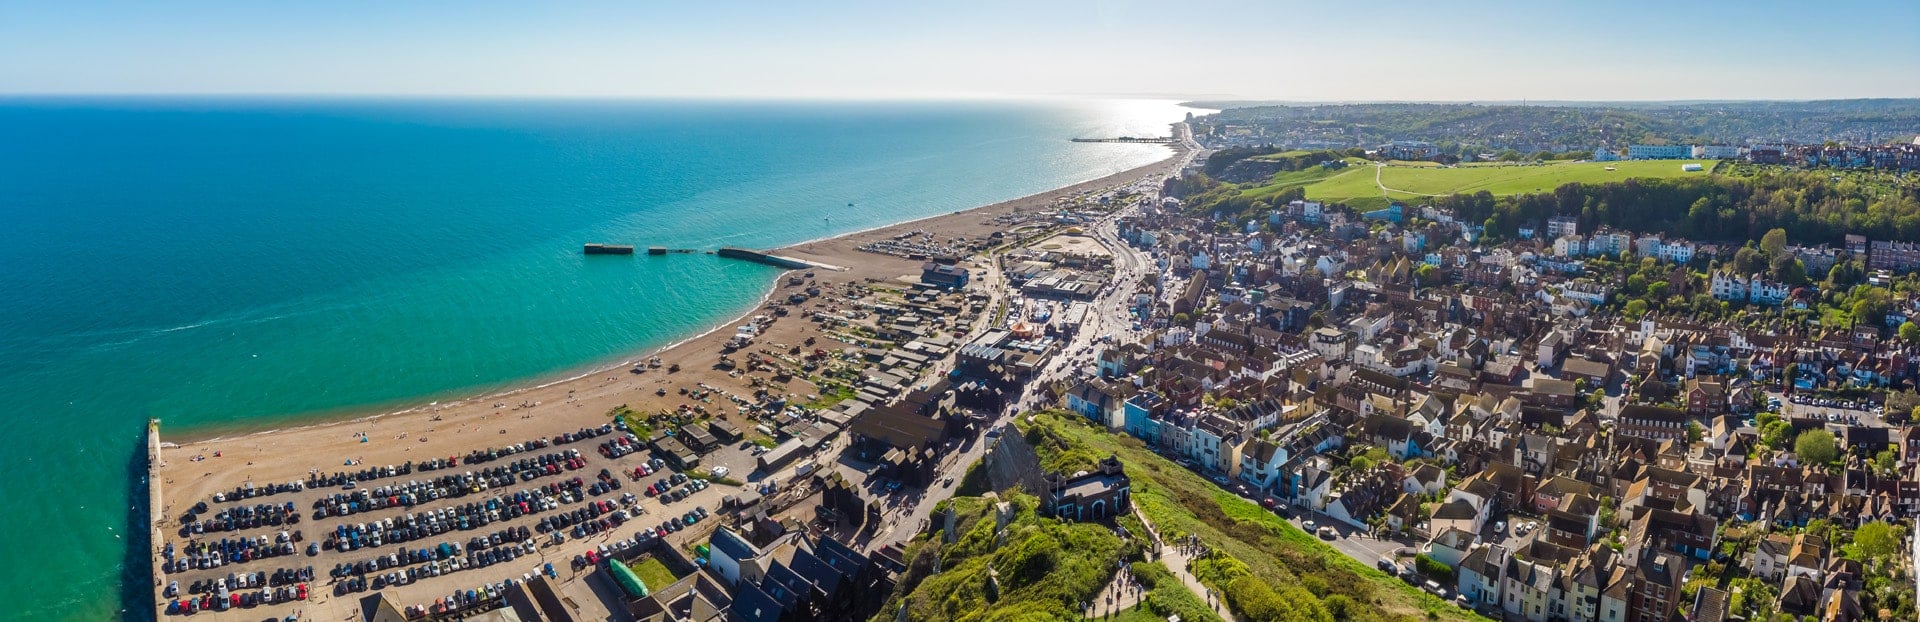
Brighton and Hove is the anchor of the coastal market, a city of getting on for 300,000 people with two universities and a year-round visitor economy, and it produces the county's highest yields at up to 6.0%. West along the coast, Worthing, Littlehampton and Bognor Regis offer the same seaside demand at lower prices, which is why they surface on the county page even without their own guides. East of Brighton, Eastbourne and Hastings are the value end of the coast: Hastings sold at an average of £236,670 and Eastbourne at £255,473, both below the England average, and both carry the regeneration and lower-price-ceiling profile that draws buyers priced out of Brighton.
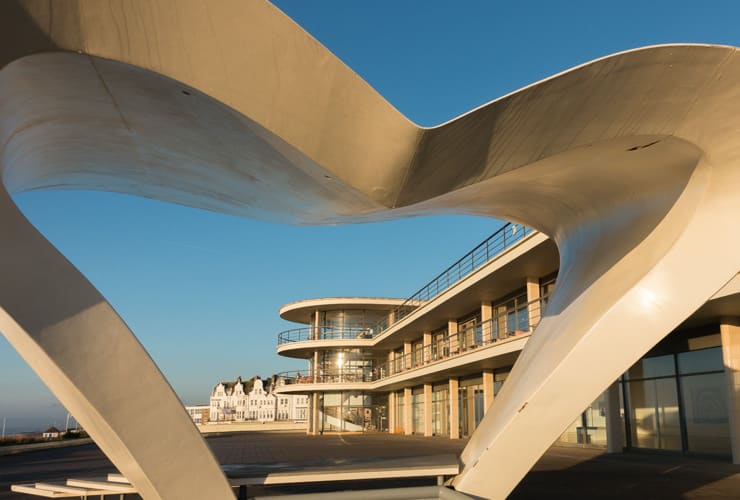
The De La Warr Pavilion at Bexhill-on-Sea, on the value end of the East Sussex coast
The Gatwick and commuter belt
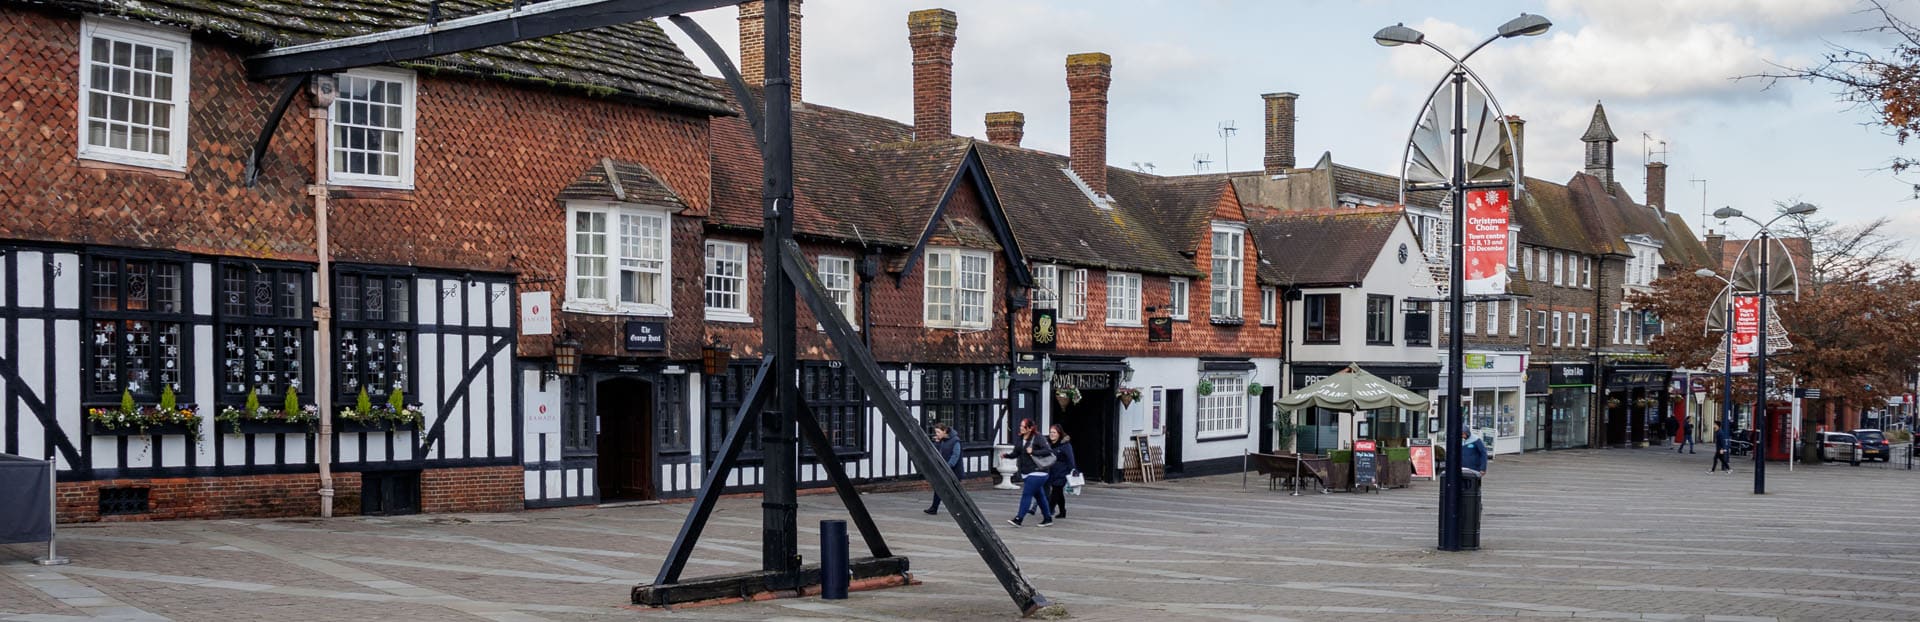
Inland and to the north, the market runs on transport. Crawley sits next to Gatwick Airport and returns a top gross yield of 5.0% off a £407,518 asking average, with rental demand tied to airport and business-park employment rather than the sea. The Mid Sussex towns of Haywards Heath and Burgess Hill sit on the Brighton main line, roughly three-quarters of an hour into London Victoria, and it is this belt that has driven the district's 15.4% five-year price rise and its £436,223 sold average, the highest of the three Sussex areas. This is the part of the county where capital value has grown fastest and yields are thinnest.
Sussex's student and HMO market
Sussex has a genuine student market, and it is concentrated in and around Brighton. The University of Sussex sits at Falmer on the edge of the city, the University of Brighton is spread across the city itself, and between them they underpin the shared-house and HMO demand that helps push Brighton's top gross yield to 6.0%, the highest in the county. Further west, the University of Chichester gives Chichester a smaller student base, though the town's high asking prices keep its yields at the bottom of our group at 4.3%.
For a Sussex landlord, the student angle is really a Brighton angle. The city's yield premium over the rest of the coast is where the university demand shows up in the numbers, and it is the main reason Brighton returns more rent per pound than towns with far lower asking prices. Any HMO plan carries local licensing rules, so the position is worth confirming with the relevant council before committing, whether that is Brighton and Hove City Council on the coast or the district council covering an inland town.
What a Sussex buy-to-let deposit costs
Because Sussex has no single Land Registry average, the deposit figures come from the town-level asking prices in the best-areas table above rather than one county number. A 30% deposit runs from around £99,000 in Eastbourne to nearly £163,000 in Chichester, a £64,000 swing across five towns in the same county. That gap is why the town you pick, and more still the type of home, matters more to the cash you need up front than the fact that all five sit in Sussex.
The property-type spread widens the range further. Take West Sussex, which sits in the middle of the three areas on price and works as a fair guide to the type split across the county. A flat there averages £197,420 sold, so a 30% deposit is £59,226; a detached home averages £663,375, so the deposit is £199,012. That £140,000 difference in the cash required up front is why so much Sussex buy-to-let money goes into flats and terraces near the coast rather than detached homes in the commuter belt. In East Sussex the same flat figure drops to £171,534, a 30% deposit of £51,460, which is the lowest starting point in the county.
How to invest in Sussex
Sussex is an additional-property market for most investors, which means the 3% Stamp Duty surcharge applies on top of the standard bands. On the Eastbourne asking average of £331,156 that surcharge alone is close to £10,000 before the standard duty, and in pricier Chichester it is over £16,000, so it is worth running your own figure through the stamp duty calculator before you set a budget.
If you are weighing Sussex against the wider South East, our guide to the best buy-to-let locations in the UK puts these yields in national context, and the neighbouring counties run to their own patterns: Kent along the eastern border, Surrey to the north, and Hampshire to the west all sit in the same premium South East band.
When you are ready to look at live deals, we help investors in three ways. You can browse current investment property opportunities across the UK, look specifically at buy-to-let deals for sale, or focus on discounted and below-market-value stock where the numbers can start further ahead. We connect investors to a sourcing service that finds deals nationally rather than holding a Sussex-only list, so the same routes work whether you settle on Brighton, Eastbourne or a town outside our five guides.
Frequently Asked Questions
What are the main areas in Sussex for property investment?
Sussex splits into East Sussex, West Sussex and the Mid Sussex district. On the coast, Brighton reaches a top gross yield of 6.0% and Eastbourne 5.8%, while Hastings sold at an average of £236,670. Inland, Crawley sits by Gatwick at 5.0% and the Mid Sussex commuter towns of Haywards Heath and Burgess Hill carry the highest prices, with the district averaging £436,223 sold.
Which part of Sussex has the cheapest house prices?
East Sussex is the lowest of the three Land Registry areas, at an average sold price of £314,949 in March 2026, against £373,414 in West Sussex and £436,223 in the Mid Sussex district. At town level the cheapest of our five guides is Hastings, which sold at an average of £236,670, followed by Eastbourne at £255,473, both below the England average of £289,946.
What are house prices like in West Sussex?
West Sussex sold at an average of £373,414 in March 2026, up 11.2% over five years and close to five-fold on its 1995 average of £65,216. By property type, a detached home averaged £663,375 and a flat £197,420, so the spread between the two is more than £460,000. That flat figure is what most keeps West Sussex buy-to-let numbers workable.
Does Sussex have a student rental market?
It has one, and it centres on Brighton. The University of Sussex at Falmer and the University of Brighton together drive the shared-house and HMO demand behind Brighton's 6.0% top gross yield, the highest in the county. The University of Chichester adds a smaller student base to the west, though Chichester's high asking prices keep its yields at 4.3%.
Is East Sussex or West Sussex better for rental yield?
The higher yields sit in East Sussex on our figures. Brighton and Eastbourne, both on the East Sussex coast, top the table at 6.0% and 5.8%, while the West Sussex towns of Crawley and Chichester come in at 5.0% and 4.3%. West Sussex has grown faster on price, up 11.2% over five years against East Sussex's 6.8%, so the split is broadly rent in the east and capital value in the west.
How much deposit do you need to buy in Sussex?
On a 30% buy-to-let deposit, the towns we cover run from around £99,000 in Eastbourne to nearly £163,000 in Chichester. By property type across West Sussex, a flat needs about £59,000 and a detached home just under £200,000. The type you buy changes the cash required up front far more than which town you pick.
Ready to buy property?
Access off-market investment properties with an average 8%+ annual gross yield (beating the UK's typical 3-5%).