Sunderland is a city in Tyne and Wear, north-east England. The average sold price across Sunderland is £145,546 on the HM Land Registry House Price Index, 49.8% below England's £289,946 and 10.0% below the North East regional average of £161,629. That makes Sunderland one of the most affordable cities in England to buy in, and it is cheap even by the standards of its own region, where prices are already the lowest in the country. The gap is not a quirk of one postcode. It runs through detached, semi-detached, terraced and flat stock alike.
Affordability at that level changes the maths for an income investor. Where a Cheshire or southern postcode ties up most of the return in capital, Sunderland's low asking prices push the yield up: SR5 returns 7.7% and SR4 6.2% on asking prices under £140,000. The trade-off is wages. The median gross weekly salary in Sunderland is £629.70, below the North East's £669.90 and well under the Great Britain figure of £752.40, so rents are anchored by what local tenants can pay rather than by a high-earning professional base.
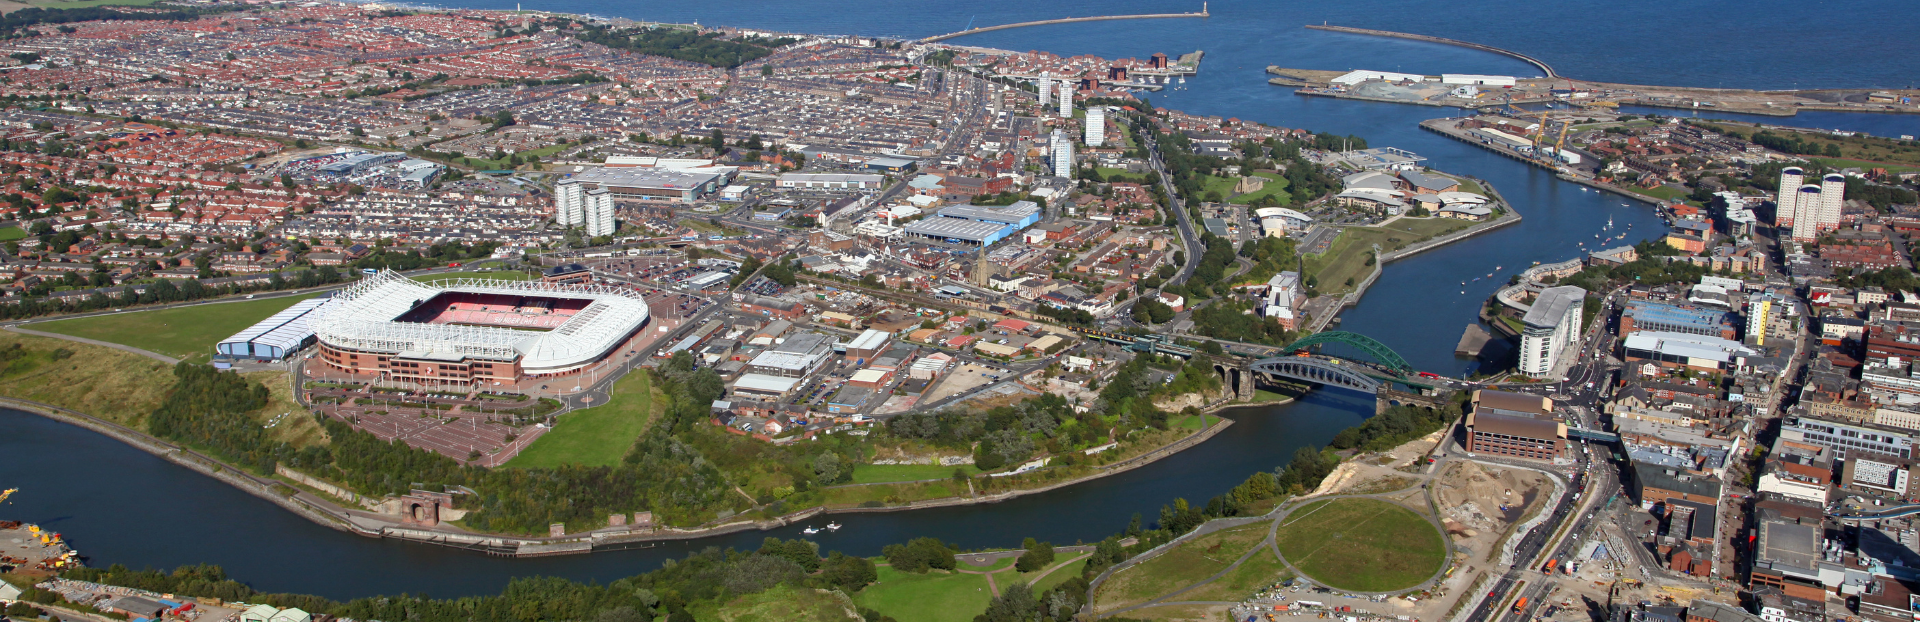
This guide covers the City of Sunderland metropolitan borough (ONS code E08000024) across twelve postcodes: SR1 to SR8 in the city itself and on the coast, plus DH4 and DH5 around Houghton-le-Spring and NE37 and NE38 in Washington. Sunderland sits on the North East coast at the mouth of the River Wear, with Newcastle buy-to-let twelve miles to the north-west and Durham eight miles inland.
Article updated: July 2026

Why Invest in Sunderland?
Sunderland's population was 274,172 at the 2021 census, down 0.48% on the 275,506 recorded in 2011. A slightly shrinking headcount sets Sunderland apart from the cities that grew through the 2010s, and it is part of why prices have stayed low. But the city's investment case does not rest on population growth. It rests on jobs, on the depth of its rented sector, and on asking prices low enough that the rent does the work.
The anchor is car manufacturing. Nissan's plant on the city's northern edge is the largest in the UK, and in November 2023 the company committed up to £2 billion of new investment, including £1.12 billion of its own, to build a gigafactory and three electric models at the site. The announcement safeguarded 7,000 Nissan jobs and around 30,000 more across the supply chain, taking the company's total commitment since 2021 to roughly £3 billion. That is a long-dated employment base on the doorstep of the SR5 and NE37 postcodes nearest the plant.
The wider economy is weighted towards manufacturing, the public sector, and the University of Sunderland, which adds a student population to the city-centre rental market. Median gross annual earnings are £32,744, the employment rate is 69.8%, and unemployment is 6.3%. Those are softer labour-market readings than the national average, and they keep open-market rents modest. For a buy-to-let investor the figure that matters is the gap between what a property costs and what it rents for, and on that measure Sunderland is one of the widest spreads in England.
Sunderland Economic Summary
- Population: 274,172 (2021 Census). Change of -0.48% from 2011.
- Median annual salary: £32,744 (local), median weekly £629.70 (local), £669.90 (North East), £752.40 (Great Britain)
- Employment rate: 69.8% (local)
- Unemployment rate: 6.3% (local)
- Key employers: Nissan, the University of Sunderland, the NHS and city council, and the automotive supply chain
Source: ONS Census 2021, Nomis Labour Market Profile (ASHE 2025)
Regeneration and Investment in Sunderland
Riverside Sunderland is rebuilding the former industrial land along the Wear into roughly 1,000 new homes and a million square feet of workspace, backed by £29.75 million of Homes England funding announced in October 2024. The scheme has already drawn over £600 million of private investment, and it sits alongside the Nissan expansion as the second pillar of the city's growth plan.
- Riverside Sunderland (Active, ~1,000 homes): Homes England committed £29.75 million from its Brownfield, Infrastructure and Land fund in October 2024, alongside £49.94 million from Sunderland City Council, towards roughly £80 million of infrastructure on the former Vaux brewery and Sheepfolds sites in the city centre. The masterplan targets around 1,000 homes and a million square feet of employment space, with over £600 million of private money already committed by Legal & General, Canada Life and Placefirst. Updates at GOV.UK.
- Nissan EV36Zero (Active, up to £2 billion): Nissan announced up to £2 billion of new investment in November 2023, including £1.12 billion of its own, to add a gigafactory and build three electric models at its Sunderland plant. The commitment safeguarded 7,000 Nissan jobs and around 30,000 across the supply chain. Updates at GOV.UK.
- International Advanced Manufacturing Park (Active): The IAMP straddling the Sunderland and South Tyneside boundary near the Nissan plant is being developed as a supply-chain and advanced-manufacturing site, drawing automotive and logistics occupiers to the SR5 and NE37 corridor. It strengthens the employment base that underpins rental demand in Washington and the north of the city.

Sunderland Property Market Analysis
Average property prices in Sunderland have risen 316.1% since January 1995, from £34,978 to £145,546. That is a slower climb than higher-priced English markets, and it took longer to recover from the financial crisis than most. The sections below trace that journey cycle by cycle, then drill into current postcode-level data for sold prices, price per square foot, asking prices, growth, and transaction volumes.
When was the last house price crash in Sunderland?
The Land Registry House Price Index records average sold prices for the City of Sunderland from January 1995 to the latest reading in March 2026, covering 31 years of market cycles.
The 1995 to 2008 climb: Sunderland started at £34,978 in January 1995. Prices built steadily through the late 1990s, reaching £43,144 by December 2000, then accelerated sharply in the early 2000s boom. The average crossed £100,000 in 2005 and peaked at £119,596 in February 2008, more than three times the 1995 starting point.
2008 to 2012, the crash and the long bottom: From the February 2008 peak of £119,596, prices fell to a trough of £95,634 in March 2012. That is a decline of 20.0% over four years, with the worst year-on-year reading of -11.7% recorded in June 2009. Sunderland's fall was deeper than many English markets, and it did not bounce back quickly. The bottom dragged out across four years rather than the sharp V-shape that higher-value southern markets traced.
2012 to 2020, the flat decade: Prices barely moved for most of the 2010s. The average was £104,683 in December 2010 and £102,689 five years later in December 2015, lower than where it had started the decade. Only towards the end of the period did momentum return, reaching £114,055 by December 2020. For most of the 2010s Sunderland was a market that paid investors through rent, not through capital growth.
2021, recovery to the pre-crash peak: Prices finally climbed back above the February 2008 peak in April 2021, when the average reached £120,588. That recovery took thirteen years, far longer than the eight or nine years it took national prices to mend. An investor who had bought at the very top in 2008 waited until 2021 just to break even on the Land Registry average.
2022 to present: The post-pandemic period brought firmer growth. Prices reached £134,591 by December 2022, eased slightly through 2023 to £134,108, then resumed climbing to £144,594 by December 2025 and £145,546 at the latest reading in March 2026. That March 2026 figure is the highest on record, 21.7% above the 2008 pre-crash peak.
Long-term growth summary:
- 5 years (March 2021 to March 2026): 22.0% growth (£119,263 to £145,546)
- 10 years (December 2015 to March 2026): 41.7% growth (£102,689 to £145,546)
- 15 years (December 2010 to March 2026): 39.0% growth (£104,683 to £145,546)
- 20 years (December 2005 to March 2026): 37.3% growth (£106,022 to £145,546)
- 30 years (January 1995 to March 2026): 316.1% growth (£34,978 to £145,546)
The shape of Sunderland's cycle is the lesson for an investor. The 20.0% crash was deeper than the national fall, and the thirteen-year recovery shows how long a low-wage market can sit flat after a correction. The 30-year return of 316.1% is real, but most of it was earned in the boom before 2008 and the recovery after 2021, with a stagnant decade in between. This is a market that has historically rewarded the income investor more reliably than the buyer banking on capital growth.
- All property types
- Detached
- Semi-detached
- Terraced
- Flats
- All property types
- Detached
- Semi-detached
- Terraced
- Flats
Sold House Prices in Sunderland
The average sold price across all property types in Sunderland is £145,546, which is 49.8% below the England average of £289,946 as of March 2026. The discount is wide across every type of home, from 44.2% on detached houses to 62.3% on flats. That breadth is what marks Sunderland out: it is not one cheap corner of an otherwise mid-priced city, it is cheap throughout.
| Property Type | Sunderland Average | England Average | Difference |
|---|---|---|---|
| Detached houses | £262,418 | £470,492 | -44.2% |
| Semi-detached houses | £155,837 | £288,185 | -45.9% |
| Terraced houses | £126,010 | £243,788 | -48.3% |
| Flats and maisonettes | £80,840 | £214,563 | -62.3% |
| All property types | £145,546 | £289,946 | -49.8% |
Detached houses average £262,418, which is 44.2% below England's £470,492 and the narrowest discount of any type. Sunderland's detached stock sits in the leafier western and coastal areas, around SR3 Tunstall and Ryhope, NE38 Washington, and DH4 Houghton-le-Spring, where it competes for owner-occupiers rather than investors. Annual growth of 4.1% points to steady demand at the top of the local market.
Semi-detached houses average £155,837, 45.9% below England's £288,185, and they are the spine of Sunderland's housing. Semis dominate the stock in SR4, SR5 and SR7, the postcodes that carry the city's strongest yields, and at 4.8% annual growth they were the fastest-appreciating type over the past year.
Terraced houses average £126,010, a 48.3% discount to England's £243,788. The terraced stock is concentrated in the older inner districts, DH5 around Hetton and SR8 around Peterlee, where rows of two- and three-bed terraces form the bulk of the lower-cost rental market. Annual growth of 3.9% keeps terraces just behind semis on performance.
Flats and maisonettes average £80,840, the deepest discount in the city at 62.3% below England's £214,563. The flat market is small and weighted towards SR1 in the city centre and SR6 around Roker and Seaburn. A reading of -1.5% over the year confirms a softer market in apartment stock, with none of the institutional city-centre development that lifts flat prices in Newcastle or Leeds.
Price Per Square Foot in Sunderland
Sunderland's per-square-foot rates run from £62 in SR1 up to £214 in SR6, with most of the city clustered between £90 and £180. Measuring by the square foot strips out how big the homes are and gives a cleaner read on what each location commands. SR6, covering Roker and Seaburn on the coast, tops the table on sea-front appeal, while the city-centre SR1 sits at the bottom on a thin sample.
| Rank | Area | Price Per Sq Ft |
|---|---|---|
| 1 | SR1 (City Centre) | £62 |
| 2 | SR8 (Peterlee) | £90 |
| 3 | SR5 (Southwick, Castletown) | £133 |
| 4 | SR2 (Hendon, Ashbrooke) | £137 |
| 5 | SR4 (Pallion, Millfield) | £142 |
| 6 | SR7 (Seaham) | £144 |
| 7 | DH5 (Hetton-le-Hole) | £151 |
| 8 | NE37 (Washington) | £160 |
| 9 | DH4 (Houghton-le-Spring) | £173 |
| 10 | SR3 (Tunstall, Ryhope) | £179 |
| 11 | NE38 (Washington) | £193 |
| 12 | SR6 (Roker, Seaburn) | £214 |
SR1 at £62 per square foot is the cheapest space in the city by a wide margin, but the figure rests on just 96 transactions analysed, the thinnest sample of any Sunderland postcode. The city centre is a small, flat-heavy market with low transaction volumes, so its headline numbers move sharply on a handful of sales and should be read with that in mind.
SR6 at £214 per square foot tops the table, drawn from 496 transactions. The coastal stretch of Roker and Seaburn carries the sea-front premium that runs through every measure for this postcode: the highest asking prices, the highest rents, and the lowest yield. Buyers paying the most per foot here are paying for the coast, not for rental return.
For Sale Asking Prices in Sunderland
Asking prices in Sunderland run from £63,655 in SR1 to £257,914 in SR6, a fourfold spread, with a city-wide mean of £163,026. Asking prices are what sellers and agents hope to achieve, not the sold prices buyers eventually pay, but the hierarchy they trace across the city is consistent: cheapest in the city centre and old industrial west, dearest on the coast and in the western commuter belt.
| Rank | Area | Asking Price |
|---|---|---|
| 1 | SR1 (City Centre) | £63,655 |
| 2 | SR8 (Peterlee) | £93,558 |
| 3 | SR5 (Southwick, Castletown) | £116,306 |
| 4 | NE37 (Washington) | £126,035 |
| 5 | SR4 (Pallion, Millfield) | £139,911 |
| 6 | DH5 (Hetton-le-Hole) | £162,871 |
| 7 | SR2 (Hendon, Ashbrooke) | £166,463 |
| 8 | SR7 (Seaham) | £177,543 |
| 9 | NE38 (Washington) | £187,390 |
| 10 | DH4 (Houghton-le-Spring) | £211,342 |
| 11 | SR3 (Tunstall, Ryhope) | £253,331 |
| 12 | SR6 (Roker, Seaburn) | £257,914 |
SR1 at £63,655 is the lowest asking price in Sunderland and one of the lowest of any English postcode on this site. It is also the smallest and most flat-dominated market, where city-centre apartment stock and a low transaction count keep prices down. The figure is genuine, but the pool of stock behind it is shallow.
SR5 at £116,306 and SR4 at £139,911 are the more representative entry points for a buy-to-let investor, and they are where the yields are strongest. Both sit below the city-wide Land Registry average of £145,546, both carry hundreds of transactions a year, and both deliver semi-detached family stock rather than the thin flat market of the city centre.

House Price Growth in Sunderland
SR5 Southwick posted the strongest five-year growth in the city at 27.3%, with SR4 Pallion close behind at 24.3%, while the picture is far more mixed over shorter timeframes. The city splits between postcodes that have climbed steadily and a coastal and commuter tier that has softened. Five of the twelve postcodes are negative over one year, a reminder that Sunderland's recovery has been uneven.
| Area | 1 Year | 3 Years | 5 Years |
|---|---|---|---|
| SR5 (Southwick, Castletown) | 5.9% | 12.2% | 27.3% |
| SR4 (Pallion, Millfield) | 8.9% | 13.5% | 24.3% |
| NE37 (Washington) | 6.0% | 26.6% | 13.9% |
| NE38 (Washington) | 5.8% | 19.6% | 10.1% |
| SR3 (Tunstall, Ryhope) | -6.5% | -8.1% | 9.3% |
| SR8 (Peterlee) | 9.5% | 4.6% | 8.1% |
| DH4 (Houghton-le-Spring) | -6.0% | -4.5% | 7.5% |
| SR2 (Hendon, Ashbrooke) | 6.1% | 3.6% | 4.5% |
| SR1 (City Centre) | 18.9% | -36.4% | 1.3% |
| SR7 (Seaham) | -7.3% | 9.6% | -4.3% |
| SR6 (Roker, Seaburn) | -10.0% | -8.0% | -6.9% |
| DH5 (Hetton-le-Hole) | -7.5% | -8.4% | -7.8% |
SR5 leads on five-year growth at 27.3%, with SR4 close behind at 24.3%. These two western postcodes pair their growth with the city's top yields, an unusual combination that puts income and capital appreciation in the same place. NE37 Washington stands out over three years at 26.6%, reflecting the pull of the Nissan plant and the IAMP on its doorstep.
SR1's swing from 18.9% over one year to -36.4% over three is the clearest sign of a thin market. With only six sales a month, the city-centre average lurches on a few transactions, so its growth figures are volatile rather than a reliable trend. SR6, SR7 and DH5 sit at the bottom, with the coastal and Hetton stock softening across most timeframes.
Monthly Property Sales in Sunderland
SR4 is the busiest postcode in Sunderland at 41 sales a month, while the city-centre SR1 sees just 6, the thinnest market of the twelve. Transaction volume tells an investor how easy it will be to buy and, later, to sell. The turnover rate, the share of homes changing hands each year, ranges from 11% in DH4 up to 33% in SR4.
| Area | Sales Per Month | Turnover | Asking Price |
|---|---|---|---|
| SR4 (Pallion, Millfield) | 41 | 33% | £139,911 |
| SR8 (Peterlee) | 38 | 21% | £93,558 |
| SR3 (Tunstall, Ryhope) | 35 | 18% | £253,331 |
| SR7 (Seaham) | 30 | 12% | £177,543 |
| SR2 (Hendon, Ashbrooke) | 29 | 13% | £166,463 |
| DH4 (Houghton-le-Spring) | 27 | 11% | £211,342 |
| SR6 (Roker, Seaburn) | 26 | 13% | £257,914 |
| SR5 (Southwick, Castletown) | 22 | 24% | £116,306 |
| NE38 (Washington) | 22 | 26% | £187,390 |
| DH5 (Hetton-le-Hole) | 20 | 18% | £162,871 |
| NE37 (Washington) | 16 | 17% | £126,035 |
| SR1 (City Centre) | 6 | 27% | £63,655 |
SR4 leads on both volume and turnover, with 41 sales a month and a third of its homes changing hands each year. For an investor that depth matters: a postcode where stock moves quickly is one where you can buy without overpaying and sell without waiting. SR4 pairs that liquidity with the city's second-highest yield, which is a rare combination.
SR1's six sales a month is the thinnest market in Sunderland. The 27% turnover looks high, but on a small base of city-centre flats it reflects a handful of transactions rather than a deep, active market. NE37 Washington is also quiet at 16 sales a month, despite strong recent growth, so buyers there should expect fewer options at any one time.
How Long Properties Take to Sell in Sunderland
SR4 clears fastest in Sunderland at about 87 days, while DH4 Houghton-le-Spring and SR6 Roker both take roughly 277 days, more than three times as long. Days on market is the typical time a home is listed before it sells; months of unsold stock measures how much for-sale supply is queued at the current rate of sales. The gap between the two ends of the city is wide enough to change a holding-cost calculation.
| Area | Avg Days to Sell | Months of Unsold Stock | Market |
|---|---|---|---|
| SR4 (Pallion, Millfield) | 87 | 2.9 | Seller's market |
| SR5 (Southwick, Castletown) | 105 | 3.4 | Seller's market |
| NE38 (Washington) | 122 | 4.0 | Seller's market |
| SR8 (Peterlee) | 132 | 4.3 | Seller's market |
| DH5 (Hetton-le-Hole) | 160 | 5.3 | Seller's market |
| NE37 (Washington) | 169 | 5.6 | Seller's market |
| SR1 (City Centre) | 169 | 5.6 | Seller's market |
| SR3 (Tunstall, Ryhope) | 179 | 5.9 | Seller's market |
| SR2 (Hendon, Ashbrooke) | 217 | 7.1 | Balanced market |
| SR7 (Seaham) | 254 | 8.3 | Balanced market |
| DH4 (Houghton-le-Spring) | 277 | 9.1 | Balanced market |
| SR6 (Roker, Seaburn) | 277 | 9.1 | Balanced market |
The headline yield never tells you how long your money is tied up at the end. SR4 turns over in under three months, so an investor can move on quickly, while DH4 and SR6 carry around nine months of unsold stock. The higher-priced western and coastal postcodes are the slowest to shift, which is the cost that sits behind their lower yields and longer holding periods.
What Type of Property Can You Buy in Sunderland?
Semi-detached and terraced houses dominate Sunderland's working housing stock, with semis the largest single type in most postcodes, while flats are heavily concentrated in the city-centre SR1. The mix of housing shapes which strategy fits each area. The figures below are drawn from 2021 Census records for each postcode.
| Area | Detached | Semi-detached | Terraced | Flats |
|---|---|---|---|---|
| SR1 (City Centre) | 4.0% | 8.8% | 16.4% | 70.7% |
| SR2 (Hendon, Ashbrooke) | 17.8% | 36.8% | 27.8% | 17.6% |
| SR3 (Tunstall, Ryhope) | 31.2% | 44.4% | 16.0% | 8.4% |
| SR4 (Pallion, Millfield) | 17.7% | 50.1% | 26.9% | 5.4% |
| SR5 (Southwick, Castletown) | 10.7% | 54.6% | 23.6% | 11.1% |
| SR6 (Roker, Seaburn) | 21.8% | 44.1% | 23.7% | 10.4% |
| SR7 (Seaham) | 35.0% | 44.8% | 17.6% | 2.6% |
| SR8 (Peterlee) | 29.2% | 30.4% | 36.1% | 3.8% |
| DH4 (Houghton-le-Spring) | 35.5% | 39.1% | 21.6% | 2.1% |
| DH5 (Hetton-le-Hole) | 23.4% | 32.9% | 39.0% | 4.2% |
| NE37 (Washington) | 25.8% | 30.5% | 32.3% | 11.3% |
| NE38 (Washington) | 49.6% | 23.3% | 20.5% | 6.6% |
SR4 and SR5 are the semi-detached heartland, at 50.1% and 54.6%, and they are exactly the postcodes carrying the strongest yields. That alignment is no accident: the three-bed semi is the workhorse of the Sunderland rental market, affordable to buy and easy to let to local families. SR8 Peterlee and DH5 Hetton lean towards terraced stock at 36.1% and 39.0%, the lower-cost end of the market.
SR1 is the outlier at 70.7% flats, by far the highest flat share in the city. The city-centre apartment market is small and distinct, with the lowest prices, the lowest transaction volumes, and a tenant base weighted towards single lets rather than the family housing that drives the rest of Sunderland.
Flats cover both purpose-built blocks and conversions. A small number of non-standard dwellings is excluded, so rows may not add up to 100%.

Sunderland Rental Market Analysis
Monthly rents in Sunderland range from £585 in SR8 to £828 in SR6, with gross rental yields from 3.5% in SR3 up to 12.0% in the thin city-centre SR1. For investors asking is buy to let worth it in a low-priced market, Sunderland's appeal is that modest rents still convert into strong yields because the purchase prices are so low. The sections below break rents, yields, and tenant affordability down postcode by postcode. Browse current buy-to-let homes for sale across the region.
Average Rent & Gross Rental Yields in Sunderland
Gross rental yields in Sunderland run from 3.5% in SR3 to 12.0% in SR1, though the most investable yields sit in SR5 at 7.7% and SR4 at 6.2%. The cheapest postcodes deliver the highest returns, the familiar pattern across the city, but the very top of the table needs reading with care. SR1's 12.0% rests on a city-centre flat market of only six sales a month, so the deeper, more reliable yields are the western semi-detached postcodes below it.
| Area | Average Monthly Rent | Asking Price | Gross Yield |
|---|---|---|---|
| SR1 (City Centre) | £636 | £63,655 | 12.0% |
| SR5 (Southwick, Castletown) | £751 | £116,306 | 7.7% |
| SR8 (Peterlee) | £585 | £93,558 | 7.5% |
| NE37 (Washington) | £680 | £126,035 | 6.5% |
| SR4 (Pallion, Millfield) | £726 | £139,911 | 6.2% |
| SR2 (Hendon, Ashbrooke) | £700 | £166,463 | 5.0% |
| NE38 (Washington) | £748 | £187,390 | 4.8% |
| DH5 (Hetton-le-Hole) | £624 | £162,871 | 4.6% |
| SR7 (Seaham) | £651 | £177,543 | 4.4% |
| DH4 (Houghton-le-Spring) | £714 | £211,342 | 4.1% |
| SR6 (Roker, Seaburn) | £828 | £257,914 | 3.9% |
| SR3 (Tunstall, Ryhope) | £731 | £253,331 | 3.5% |
SR5 at 7.7% is the strongest investable yield in Sunderland. A £116,306 asking price against a £751 monthly rent gives a return well above what a southern market could offer, and SR5 backs it with real depth: hundreds of transactions a year, 27.3% five-year growth, and the Nissan plant and IAMP jobs on its doorstep. For an income investor this is the postcode the data keeps pointing at.
SR1 at 12.0% tops the table on paper, but it is the city's thinnest market. The £63,655 asking price reflects a small, flat-dominated city-centre stock with only six sales a month, so the headline yield is real for the few properties that trade but hard to scale across a portfolio. SR3 at 3.5% sits at the other end, where the £253,331 asking price in Tunstall and Ryhope compresses the return despite a solid £731 rent.
Gross Rental Yield by Postcode
Is Sunderland Rent High?
Monthly rents in Sunderland take between 21.5% and 30.3% of the local median gross monthly salary, so every postcode but one sits at or below the 30% affordability threshold. The widely used rule of thumb is that rent should not exceed 30% of gross income. On that measure Sunderland is one of the more affordable rental markets in England for tenants, which matters to a landlord because affordable rents come with fewer arrears and longer tenancies.
The median gross weekly salary in Sunderland is £629.70, which works out at about £2,729 per month or £32,744 per year. That is below the North East regional median of £669.90 per week and the Great Britain median of £752.40 per week. Data from the Nomis Labour Market Profile (ASHE 2025).
| Rank | Area | Rent as % of Income |
|---|---|---|
| 1 | SR6 (Roker, Seaburn) | 30.3% |
| 2 | SR5 (Southwick, Castletown) | 27.5% |
| 3 | NE38 (Washington) | 27.4% |
| 4 | SR3 (Tunstall, Ryhope) | 26.8% |
| 5 | SR4 (Pallion, Millfield) | 26.6% |
| 6 | DH4 (Houghton-le-Spring) | 26.2% |
| 7 | SR2 (Hendon, Ashbrooke) | 25.6% |
| 8 | NE37 (Washington) | 24.9% |
| 9 | SR7 (Seaham) | 23.9% |
| 10 | SR1 (City Centre) | 23.3% |
| 11 | DH5 (Hetton-le-Hole) | 22.9% |
| 12 | SR8 (Peterlee) | 21.5% |
SR8 Peterlee is the most affordable to rent in, at 21.5% of local income, with a £585 monthly rent against a £2,729 salary. That headroom is what keeps tenancies stable. SR6 Roker is the only postcode to nudge past 30%, at 30.3%, where coastal rents of £828 a month stretch the local median, though tenants drawn to the sea front are often dual-income households rather than single earners.
How Big Is Sunderland's Private Rented Sector?
The private rented sector is largest in the city-centre SR1 at 31.8% of households and in SR2 at 20.6%, and smallest out in NE38 Washington at 9.7%. The share of homes already rented privately is a read on the depth of the established tenant pool. The table below shows household tenure by postcode.
| Area | Owned Outright | Owned with Mortgage | Private Rented | Social Rented |
|---|---|---|---|---|
| SR1 (City Centre) | 5.3% | 4.1% | 31.8% | 58.6% |
| SR2 (Hendon, Ashbrooke) | 31.8% | 30.7% | 20.6% | 16.7% |
| DH5 (Hetton-le-Hole) | 35.4% | 29.6% | 18.8% | 15.9% |
| SR8 (Peterlee) | 33.3% | 27.1% | 16.8% | 22.6% |
| SR4 (Pallion, Millfield) | 33.9% | 30.1% | 15.5% | 20.3% |
| SR5 (Southwick, Castletown) | 31.1% | 24.4% | 15.2% | 29.0% |
| SR6 (Roker, Seaburn) | 44.9% | 30.2% | 13.2% | 11.3% |
| DH4 (Houghton-le-Spring) | 34.8% | 37.6% | 12.4% | 14.9% |
| NE37 (Washington) | 36.6% | 27.8% | 12.3% | 22.8% |
| SR7 (Seaham) | 44.2% | 35.6% | 11.5% | 8.5% |
| SR3 (Tunstall, Ryhope) | 38.6% | 30.8% | 11.2% | 18.8% |
| NE38 (Washington) | 40.3% | 38.2% | 9.7% | 11.5% |
SR1 has the deepest private rented sector at 31.8%, but its tenure tells a fuller story: 58.6% of city-centre households are in social housing and fewer than one in ten owns. This is a low-ownership, rental-heavy district rather than a thriving private market, which fits the thin sales volumes seen elsewhere in its data. SR2 Hendon, at 20.6% private rented with a more balanced ownership base, is the more conventional landlord postcode.
The western and Washington postcodes, SR3, NE37 and NE38, carry smaller private rented shares of around 10% to 12%, with higher owner-occupation. A thinner rented sector there means fewer comparable tenancies to benchmark against, though strong owner-occupier demand supports values. SR5 pairs a modest 15.2% private rented share with the city's largest social-rented sector at 29.0%, a sign of how much of its stock sits at the affordable end.
Local Housing Allowance Rates in Sunderland
All twelve Sunderland postcodes fall within the single Sunderland Broad Rental Market Area, where Local Housing Allowance runs from £73.95 a week for a shared room to £161.10 a week for a four-bedroom home. Local Housing Allowance is the most a tenant on housing benefit can claim towards rent, so for that part of the market it works as an effective rent floor. Because the whole city shares one rate, those figures apply identically across every postcode. To check the rate for a specific address, use the government's official Local Housing Allowance calculator.
| Property Size | Weekly LHA Rate | Monthly Equivalent |
|---|---|---|
| Shared accommodation | £73.95 | £320 |
| 1 bedroom | £97.81 | £424 |
| 2 bedrooms | £109.32 | £474 |
| 3 bedrooms | £126.58 | £549 |
| 4 bedrooms | £161.10 | £698 |
The two-bedroom rate of £109.32 a week is about £474 a month, which sits below Sunderland's £585 to £828 open-market rents but is close enough that a benefits-backed tenancy is workable across much of the city, especially in the lower-cost SR8, SR5 and DH5 stock. In a low-rent market like Sunderland the gap between the LHA rate and the market rent is narrower than in higher-priced cities, so housing-benefit tenancies are a more realistic part of the picture here than in a Cheshire or southern postcode.
Buy-to-Let Considerations
Are House Prices High in Sunderland? Price-to-Earnings Ratios
Buying in Sunderland costs between 1.9 and 7.9 times the local median annual salary, and ten of the twelve postcodes sit below the national affordability benchmark. This is based on the Nomis Labour Market Profile for Sunderland, which puts the median gross annual income for residents at £32,744.
The national benchmark for price-to-earnings is 7.4x (England's average sold price of £289,946 divided by the Great Britain median annual salary of £39,125). Sunderland is one of the most affordable cities in the country against local incomes: only SR3 and SR6, the two priciest coastal and western postcodes, exceed the national benchmark.
| Rank | Area | Price-to-Earnings Ratio |
|---|---|---|
| 1 | SR1 (City Centre) | 1.9x |
| 2 | SR8 (Peterlee) | 2.9x |
| 3 | SR5 (Southwick, Castletown) | 3.6x |
| 4 | NE37 (Washington) | 3.8x |
| 5 | SR4 (Pallion, Millfield) | 4.3x |
| 6 | DH5 (Hetton-le-Hole) | 5.0x |
| 7 | SR2 (Hendon, Ashbrooke) | 5.1x |
| 8 | SR7 (Seaham) | 5.4x |
| 9 | NE38 (Washington) | 5.7x |
| 10 | DH4 (Houghton-le-Spring) | 6.5x |
| 11 | SR3 (Tunstall, Ryhope) | 7.7x |
| 12 | SR6 (Roker, Seaburn) | 7.9x |
SR5 at 3.6x and SR4 at 4.3x are the figures an income investor will keep coming back to. A property at three or four times local earnings is comfortably inside the national benchmark, and these are the same postcodes that carry the strongest yields, so affordability and return line up. SR1's 1.9x is the lowest in the city, but it reflects the thin city-centre flat market rather than typical family stock.
SR6 at 7.9x and SR3 at 7.7x are the only postcodes above the national 7.4x benchmark. Both are coastal or western family areas, Roker on the sea front and Tunstall to the south, where owner-occupier demand pushes prices above what the local median income would support. For an investor these are growth-and-amenity postcodes rather than yield plays.
Deposit Requirements in Sunderland
A 30% deposit on a buy-to-let property in Sunderland runs from £19,097 in SR1 to £77,374 in SR6. The gap between the cheapest and most expensive deposit is £58,277. At the lower end, those are some of the smallest entry costs of any English city, which is the heart of Sunderland's appeal to a cash-conscious investor building a portfolio.
Beyond the deposit, the stamp duty calculation and other buy-to-let running costs shape the total capital you need going in.
| Rank | Area | 30% Deposit Required |
|---|---|---|
| 1 | SR1 (City Centre) | £19,097 |
| 2 | SR8 (Peterlee) | £28,067 |
| 3 | SR5 (Southwick, Castletown) | £34,892 |
| 4 | NE37 (Washington) | £37,810 |
| 5 | SR4 (Pallion, Millfield) | £41,973 |
| 6 | DH5 (Hetton-le-Hole) | £48,861 |
| 7 | SR2 (Hendon, Ashbrooke) | £49,939 |
| 8 | SR7 (Seaham) | £53,263 |
| 9 | NE38 (Washington) | £56,217 |
| 10 | DH4 (Houghton-le-Spring) | £63,403 |
| 11 | SR3 (Tunstall, Ryhope) | £75,999 |
| 12 | SR6 (Roker, Seaburn) | £77,374 |
SR5 needs a £34,892 deposit for the city's strongest investable yield at 7.7%, and SR4 a £41,973 deposit for 6.2%. Those are the figures that make Sunderland work for an income strategy: a deposit under £42,000 buys into a postcode with hundreds of sales a year, semi-detached family stock, and a yield a southern market cannot match. SR8 Peterlee comes in cheaper still at £28,067 for a 7.5% yield, with more terraced stock.
At the top, SR6 Roker and SR3 Tunstall need around £76,000 to £77,000, more than double the SR5 deposit. These are the coastal and western postcodes where capital and amenity, not rental yield, are doing the work, with returns of 3.9% and 3.5% and the slowest selling times in the city at around 277 days.

What the Sunderland Data Tells Buy-to-Let Investors
Sunderland is an income market, and the data points squarely at the western semi-detached postcodes. SR5 carries the strongest investable yield at 7.7% on a £116,306 asking price. It also grew 27.3% over five years and sits on the doorstep of the Nissan plant, so the income comes with growth and a long-dated employer behind it. SR4 sits alongside it at 6.2%, the busiest market in the city with 41 sales a month, where a £41,973 deposit buys into stock that lets to local families and sells quickly. For buying an investment property in Sunderland, these are the postcodes the numbers keep returning to.
The headline 12.0% yield in SR1 is real but narrow. The city-centre flat market trades only six times a month, is 70.7% flats and 58.6% social-rented, and its growth figures lurch from +18.9% to -36.4% depending on the timeframe. That is a postcode for a specific city-centre flat play, not a base for a scalable portfolio. The honest top of the reliable yield table is SR5 and SR8, not SR1.
At the other end, SR6 Roker and SR3 Tunstall are the coastal and western premium tier: the highest prices, the highest rents, the lowest yields at 3.9% and 3.5%, and the slowest sales at around 277 days. They suit a growth-and-amenity buyer rather than an income investor. Buyers who want to come in below the asking prices in any of these postcodes often work the off-market property route before stock reaches the portals, or look at below market value properties.
The wider case rests on jobs and affordability rather than population growth. A shrinking headcount and below-average wages keep prices low, but Nissan's £3 billion of committed investment and the Riverside Sunderland regeneration give the rental base a long runway. With deposits starting under £35,000 for the best yields, Sunderland reads as one of the clearest income plays in England, with the cycle history showing the returns have historically come through rent rather than capital growth.
How Sunderland Compares
Sunderland's mean asking price of £163,026 is the lowest of the four North East locations compared here, and SR1's thin city-centre market hands it the group's highest top yield at 12.0%, though the deeper investable yields sit at SR5's 7.7%. The comparison places Sunderland alongside three nearby markets, each with a different investor profile. The mean asking price and mean monthly rent are simple averages across all postcodes with data. Top gross yield is the single highest postcode yield in each location.
| Location | Mean Asking Price | Mean Monthly Rent | Mean Gross Yield | Top Yield (postcode) |
|---|---|---|---|---|
| Sunderland | £163,026 | £698 | 5.1% | 12.0% (SR1) |
| Middlesbrough | £187,754 | £743 | 4.7% | 8.2% (TS1, TS3) |
| Durham | £190,986 | £793 | 5.0% | 5.5% (DH7, DH9) |
| Newcastle | £262,699 | £1,122 | 5.1% | 9.3% (NE1) |
Sunderland is the cheapest entry of the four at £163,026 mean asking price, well below Middlesbrough at £187,754 and Durham at £190,986, and roughly £100,000 under Newcastle. That low base is what lifts its yields: SR1's 12.0% top reading and SR5's 7.7% investable return on modest rents only work because the purchase prices are so low.
On headline top yields Sunderland's SR1 reads highest at 12.0%, though on a thin city-centre market; Newcastle reaches 9.3% and Middlesbrough 8.2% on deeper stock, and both cost far more to enter. Durham is the outlier on income at a 5.5% top yield, trading rental return for the stability of a cathedral-and-university city. Sunderland's pitch within this group is the lowest entry cost and the smallest deposits, paired with a yield that still clears most southern markets comfortably. For a data-driven comparison across every UK location, see our highest-yielding areas guide.
Frequently Asked Questions
Is Sunderland a good place to invest in buy-to-let?
For income, yes, and the reason is affordability. Sunderland's average sold price of £145,546 is 49.8% below the England average and 10.0% below the North East regional figure, so the same rent converts into a much higher yield than it would in a pricier market. The best investable yields sit at 7.7% in SR5 and 6.2% in SR4, on asking prices under £140,000.
The caveat is that this is a low-wage market with a slightly shrinking population, so the case is built on rent and jobs, not capital growth. Nissan's £3 billion of committed investment and the Riverside Sunderland regeneration give the rental base a long runway, but an investor banking on fast price rises is in the wrong city.
What are the best areas in Sunderland for property investment?
For yield, the western semi-detached postcodes lead. SR5 Southwick and Castletown delivers the strongest reliable return at 7.7%, with 27.3% five-year growth and the Nissan plant nearby, while SR4 Pallion and Millfield pairs a 6.2% yield with the busiest market in the city at 41 sales a month. SR8 Peterlee is the cheapest way in, at a £28,067 deposit for a 7.5% yield.
SR1 in the city centre shows a 12.0% yield on paper, but with only six sales a month and a stock that is 70.7% flats, it is a thin and specialised market rather than a portfolio base. At the premium end, SR6 Roker and SR3 Tunstall are coastal and family areas with low yields around 3.5% to 3.9%, better suited to a growth-and-amenity buyer.
What are average house prices and rents in Sunderland?
On the Land Registry index, Sunderland's average sold price is £145,546, about 49.8% below the England average of £289,946. By type, detached homes average £262,418, semi-detached £155,837, terraced £126,010 and flats £80,840. Asking prices by postcode run from £63,655 in SR1 up to £257,914 in SR6, with a city-wide mean of £163,026.
Monthly rents range from £585 in SR8 Peterlee to £828 in SR6 Roker. Because the purchase prices are so low, those modest rents still produce strong yields, from 3.5% in SR3 up to 7.7% in the deeper SR5 market.
What type of property is most common in Sunderland?
Semi-detached houses, in most postcodes. They run from around 23% of the stock in NE38 Washington up to 54.6% in SR5, and they are the workhorse of the local rental market, affordable to buy and easy to let to families. Terraced houses are the next largest type, concentrated in SR8 Peterlee at 36.1% and DH5 Hetton at 39.0%.
Flats are scarce across most of the city but dominate the city-centre SR1, at 70.7% of its stock, by far the highest flat share of any Sunderland postcode. That makes SR1 a distinct apartment market sitting apart from the family housing that drives the rest of the city.
How affordable is Sunderland for tenants?
Very, by national standards. Rents take between 21.5% and 30.3% of the local median monthly salary of £2,729, so every postcode but SR6 Roker sits at or below the widely used 30% affordability threshold. SR8 Peterlee is the most affordable at 21.5%, where a £585 rent leaves real headroom against local wages.
For a landlord, affordable rents tend to mean fewer arrears and longer tenancies, which is part of why a low-wage market like Sunderland can still be a steady income proposition. The flip side is that rents are capped by what local tenants can pay, so there is limited room to push them higher.
How has the Nissan plant affected Sunderland's property market?
Nissan's plant on the city's northern edge is the largest car factory in the UK and the single biggest employer in the area. The November 2023 commitment of up to £2 billion to build a gigafactory and three electric models safeguarded 7,000 Nissan jobs and around 30,000 in the supply chain, taking total investment since 2021 to roughly £3 billion.
For a buy-to-let investor the effect is on the rental base rather than on prices directly. The postcodes nearest the plant and the International Advanced Manufacturing Park, SR5 and the Washington NE37 and NE38 areas, draw a steady stream of manufacturing and supply-chain tenants, which underpins demand in exactly the postcodes that carry the strongest yields.
Is there demand for student accommodation in Sunderland?
There is, centred on the University of Sunderland's city-centre and St Peter's campuses, so the demand sits mainly in SR1 and SR2. The low rents and small flat market make the city-centre stock workable for student lets, though student tenancies bring summer voids and more hands-on management than a standard family let, so factor that in. For the purpose-built end of the market, see our guide to student property investment.
How do I buy an investment property in Sunderland?
Start by deciding whether you are buying for income or for growth, because the two goals point to different parts of the city. For income, SR5 (7.7% yield) and SR4 (6.2%) in the west are where the numbers work, with deposits from around £35,000. For growth or amenity, the coastal and western premium postcodes like SR6 and SR3 cost more and yield less. Budget for a 30% deposit, which runs from £19,097 in SR1 to £77,374 in SR6.
Beyond what is listed openly, many experienced investors buy below asking through off-market property channels. To see what is available now, browse current buy-to-let property for sale across the region.
Ready to buy property?
Access off-market investment properties with an average 8%+ annual gross yield (beating the UK's typical 3-5%).
Get property alerts