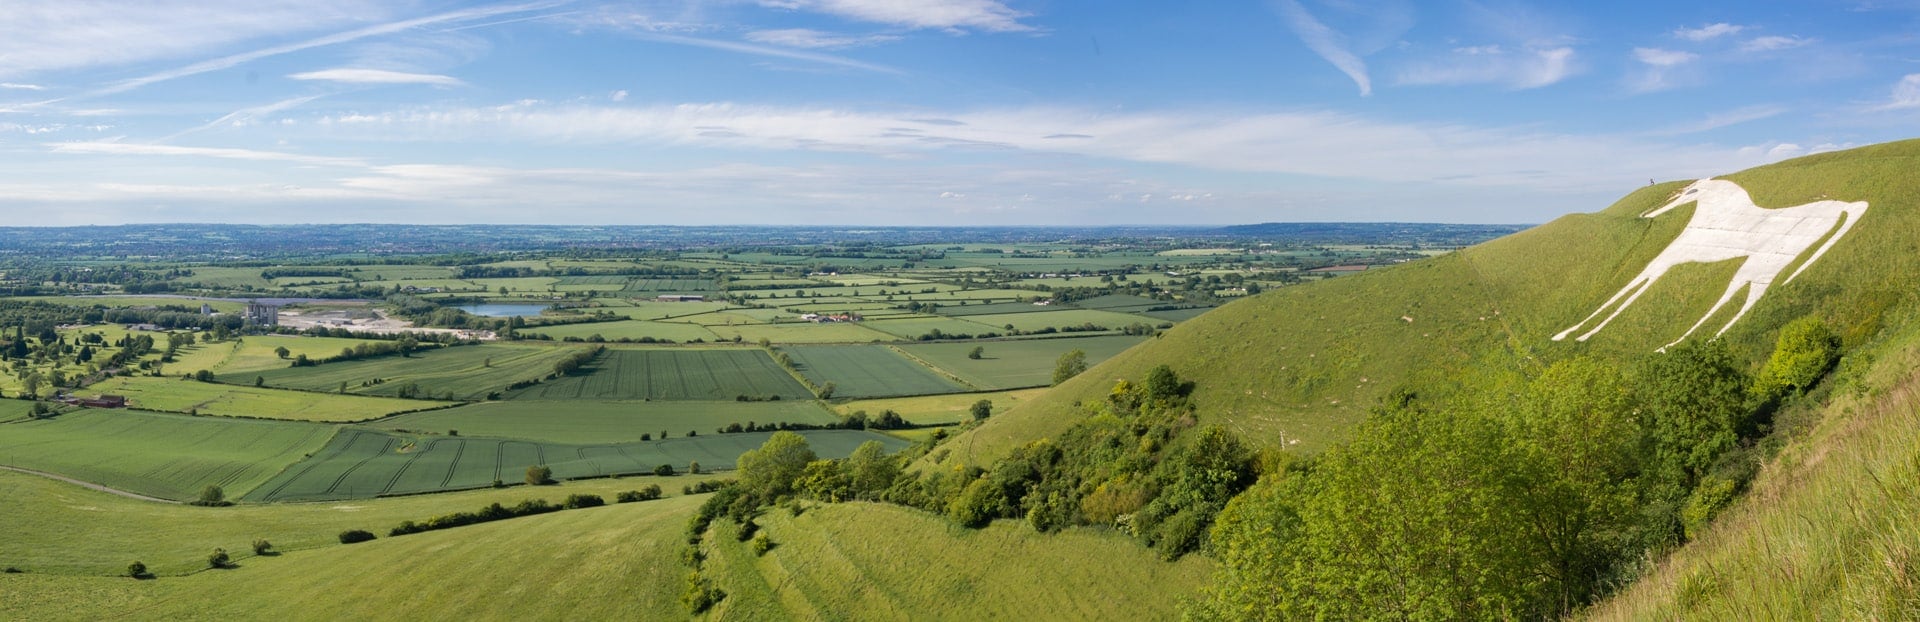
Wiltshire is a landlocked county in South West England, running from the edge of the Cotswolds down to the chalk of Salisbury Plain, with Swindon in its north-east corner and the cathedral city of Salisbury in the south. Land Registry puts the average Wiltshire home at £324,123 as of March 2026. That is about 11.8% above the England average of £289,946, so this is a county where the buyer pays a premium before a single tenant has moved in.
The gap between what you pay and what you earn is the whole story here. Across Wiltshire's PropertyData postcodes the best gross yield on offer is 5.2%, and it sits in Swindon, the cheapest of the two towns we cover. Salisbury tops out at 4.6% off a much higher price base. So the county sorts itself neatly: the yield is in the north around the M4, the price and the prestige are in the south around the cathedral.
On the county average of £324,123, a 30% deposit is £97,237 before stamp duty and fees. That number moves a long way depending on what you buy. A flat averages £156,280, a detached house £510,949, so the deposit alone ranges from roughly £47,000 to £153,000 inside the same county. Below are the two Wiltshire towns we cover in depth, then the county market in full.
Article updated: July 2026
Explore Wiltshire town guides
Compare local yields and sold prices across Wiltshire's town guides before the county market analysis.
The Wiltshire property market
Wiltshire has one of the longer records in the Land Registry, and the arc is easy to read. In January 1995 the average home here changed hands for £65,798. By September 2007 it had reached £225,427, the peak before the financial crisis. Prices then fell to £184,443 by April 2009, a drop of about 18% over eighteen months, and it took until October 2014 for the county average to climb back above its old 2007 peak.
From there the recovery ran hard. The all-time high was £332,852 in October 2022, just as mortgage rates jumped. Since then the market has drifted back a little, and at £324,123 in March 2026 the county sits around 2.6% below that 2022 high. Over the five years from March 2021 the average is up 13.5%, from £285,517, so the recent run has been steady rather than dramatic. Over the full thirty years since 1995 the average home has risen roughly 393%.
Where Wiltshire really spreads out is by property type, and this is what drives the yield map. A detached house averages £510,949 and a flat £156,280, a gap of £354,669. A detached home costs more than three times a flat. Semi-detached sits at £323,436 and terraced at £262,018, both close to the county average. For a landlord that spread matters more than the headline number: the cheaper the property type, the smaller the deposit and the higher the yield tends to run, which is why the flats and terraces of Swindon do the earning and the detached stock does the capital growth.
- All property types
- Detached
- Semi-detached
- Terraced
- Flats
- All property types
- Detached
- Semi-detached
- Terraced
- Flats

Best areas to invest in Wiltshire
Ranked by top gross yield, this is how the two Wiltshire towns we cover compare on price, deposit and income. The deposit column is 30% of the mean asking price.
| Area | Mean Asking Price | 30% Deposit | Top Gross Yield |
|---|---|---|---|
| Swindon | £349,254 | £104,776 | 5.2% |
| Salisbury | £437,020 | £131,106 | 4.6% |
The single highest yield in the county belongs to SN2 in north Swindon, at 5.2% off an average asking price of £249,402. Two more Swindon postcodes follow closely: SN3 at 5.0% and SN1 at 4.9%. In Salisbury the best reading is SP1 at 4.6%, though it comes off a much steeper £345,513. That is the county's income ceiling in one line: the numbers that pay best are the cheaper Swindon outcodes, and the further south and west you go, the more you pay for the same rent.
Beyond the two towns we cover in depth, Wiltshire's map is filled with smaller market towns that carry their own quiet rental demand and very little investor competition. Chippenham, Trowbridge, Devizes, Melksham, Warminster and Calne all sit in the £260,000 to £360,000 band on the county's own PropertyData postcodes, and villages such as Corsham, Marlborough and Bradford on Avon run well above that. We do not hold postcode-level yield data on every one of these, so treat them as places to research rather than ranked picks, but the pattern holds: cheaper towns near the M4 earn better than the picture-postcard villages of the west.
Wiltshire's commuter and rural markets
The M4 corridor and Swindon
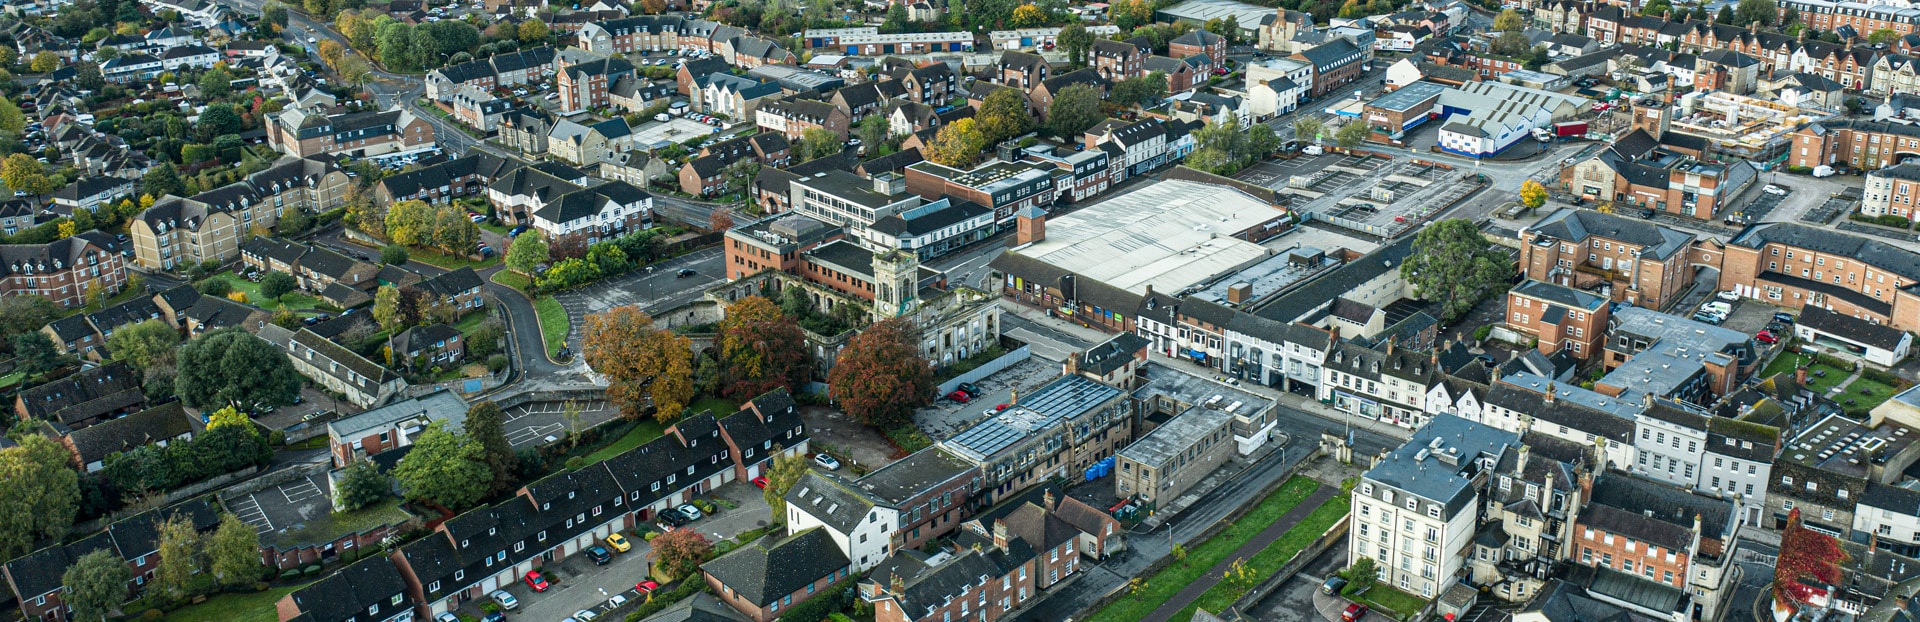
Swindon is the engine of the county's rental market, and it is the value end of it. The average home sold for £257,024, which is about 11.4% below the England average, and over five years Swindon prices are up 16.2%, a shade ahead of the county as a whole. It sits on the Great Western Main Line, with the fastest trains reaching London Paddington in around 44 minutes, and on the M4 at junctions 15 and 16. That combination of a sub-£260,000 average and a genuine one-hour London commute is what pushes the yields up to 5.2%.
The economy underneath those numbers is built on rail heritage and modern distribution. Swindon grew up around the Great Western Railway works, and today its employers lean towards logistics, financial services and manufacturing, with names such as Nationwide Building Society and BMW's Mini plant among the larger ones. It is also the largest population centre in the UK without its own university, so this is a working-tenant market of commuters and local employees, not a student one.
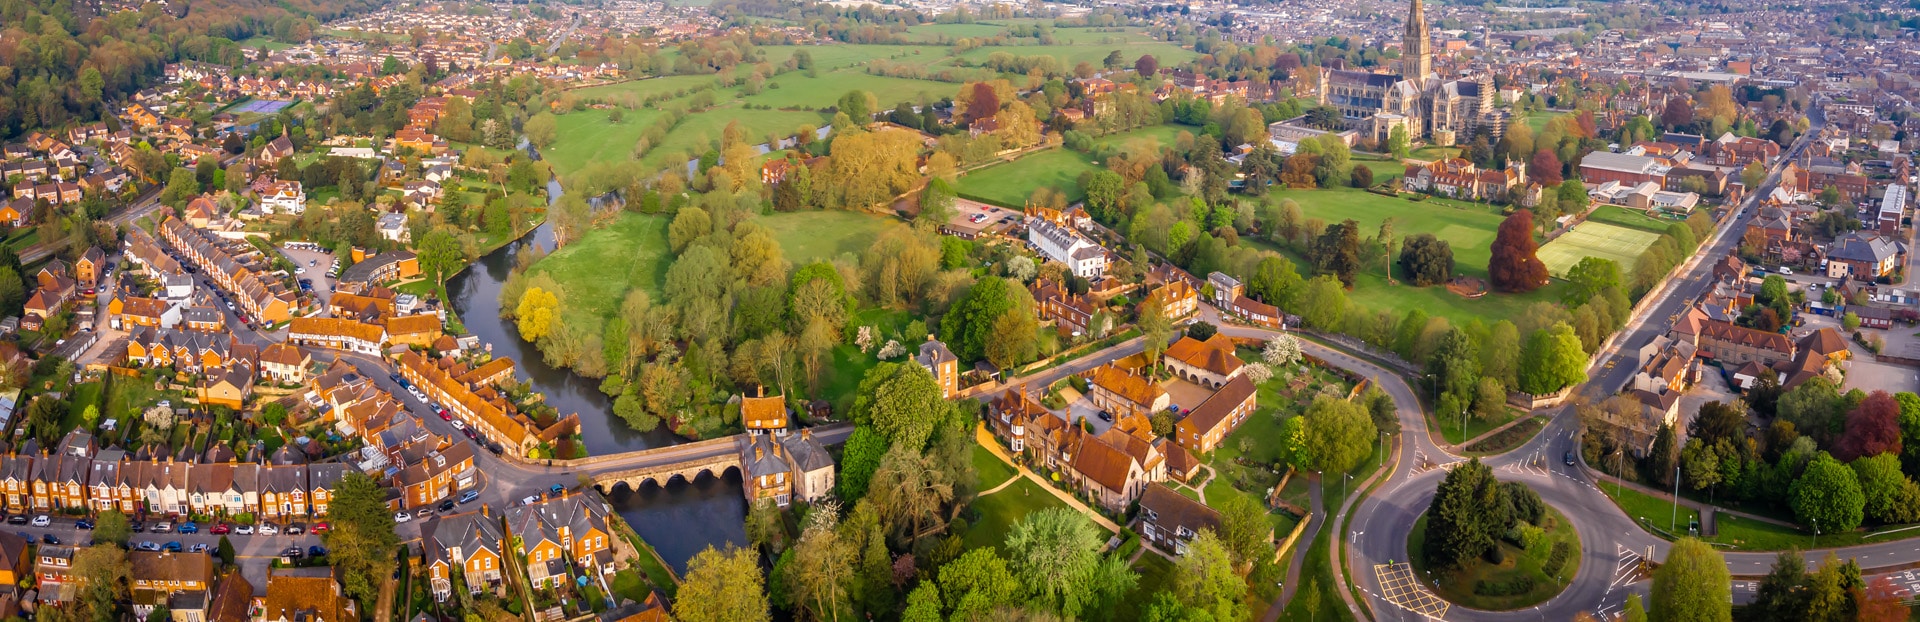
Salisbury and the south
Salisbury is the county's premium market. Homes there sold for an average £324,123, about 11.8% above England, and the mean asking price of £437,020 is the highest of the two towns we cover. Five-year growth of 13.5% matches the wider county. The pull here is a genuine cathedral city, with Salisbury Cathedral and its 404-foot spire, the tallest in the country, and Stonehenge eight miles away on Salisbury Plain. Salisbury station runs the West of England line to London Waterloo and the Wessex line towards Southampton, so it draws commuters and second-home money that keep prices firm and yields lower than the north.
The wider south and west of Wiltshire is chalk downland, small towns and a large military footprint on Salisbury Plain, one of the biggest Army training areas in the country. That military presence underpins steady rental demand in towns such as Warminster and Amesbury without ever generating the volume of a city. It is a thinner, more spread-out market than Swindon, and the data reflects that: fewer postcodes, higher prices, lower yields.
What a Wiltshire buy-to-let deposit costs
Because Wiltshire's stock ranges from sub-£160,000 flats to half-million-pound detached houses, the deposit you need swings widely by property type. At a 30% deposit, here is what each type costs going in, based on the county-wide Land Registry averages.
| Property type | Average Wiltshire price | 30% deposit |
|---|---|---|
| Detached | £510,949 | £153,285 |
| Semi-detached | £323,436 | £97,031 |
| Terraced | £262,018 | £78,605 |
| Flat | £156,280 | £46,884 |
On the county average of £324,123 the deposit is £97,237. The spread between the cheapest and dearest type is the thing to note: a Wiltshire flat needs about £46,884 down, a detached house £153,285, a difference of more than £106,000 for the same 30% inside the same county. That is why the income and the accessible money live at the flat-and-terrace end, and the capital value lives in the detached stock.
How to invest in Wiltshire
Every Wiltshire purchase above the threshold carries stamp duty, and the second-property surcharge applies to buy-to-let. On a £324,123 county-average home the bill runs into five figures once the surcharge is added, so it belongs in your deposit maths from the start. Our stamp duty calculator works out the figure for any Wiltshire price and situation.
If you are weighing Wiltshire against its neighbours, both border counties we cover in depth read differently: Somerset to the west and Hampshire to the south-east each carry their own price and yield profile worth comparing before you commit. For the wider national picture, our guide to the best places to buy property across the UK sets Wiltshire's numbers against every other region we track.
When you are ready to move, we help investors three ways. You can browse current buy-to-let deals for sale, look at the full range of investment property we work with, or focus on discounted and below-market-value stock where the numbers can stack up harder from day one.
Frequently Asked Questions
What is the average house price in Wiltshire?
The average Wiltshire home sold for £324,123 in March 2026, according to HM Land Registry. That is about 11.8% above the England average of £289,946. Prices peaked at £332,852 in October 2022 and have drifted back roughly 2.6% since, while over five years the county is up 13.5%.
Which part of Wiltshire has the best rental yields?
The strongest gross yields sit in Swindon, in the county's north-east, where the SN2 postcode reads 5.2% off an average asking price of £249,402. SN3 and SN1 follow at 5.0% and 4.9%. Salisbury tops out lower at 4.6% because its prices are far higher. As a rule, the cheaper northern towns near the M4 return more income than the pricier south and west.
Where is the cheapest place to buy in Wiltshire?
Of the two towns we cover in depth, Swindon is the cheaper, with an average sold price of £257,024, about 11.4% below the England average. Smaller market towns such as Trowbridge, Melksham and Calne also sit below the county average of £324,123, while the villages of west Wiltshire and the city of Salisbury run well above it.
What do the numbers say about buy-to-let in Swindon?
Swindon carries the county's highest yields, up to 5.2%, alongside its lowest prices, an average of £257,024 sold, and five-year growth of 16.2%. It sits on the Great Western Main Line with London Paddington around 44 minutes away and two M4 junctions, and its economy runs on logistics, financial services and manufacturing rather than students. That is a lower price base and a higher income reading than anywhere else in the county.
Does Wiltshire have a student rental market?
Not a significant one. Swindon is the largest population centre in the UK without its own university, and Salisbury has no major university either. Wiltshire's rental demand comes from commuters, local employees and the county's military presence on Salisbury Plain, not from students, so the HMO-and-student model that drives yields in places like Nottingham or Leeds does not apply here.
How much deposit do I need for a Wiltshire buy-to-let?
At a 30% deposit, the county average of £324,123 needs £97,237 before stamp duty and fees. It varies sharply by property type: a flat averaging £156,280 needs about £46,884 down, while a detached house averaging £510,949 needs £153,285. The cheaper types in Swindon are where the accessible deposits and the higher yields sit.
Ready to buy property?
Access off-market investment properties with an average 8%+ annual gross yield (beating the UK's typical 3-5%).
Get property alerts