Middlesbrough is a town on Teesside, in the North East of England. Average sold prices in Middlesbrough sit at £138,207 on the HM Land Registry House Price Index, 52.3% below England's £289,946 and among the lowest of any town in the country. That price base is the whole story here. A buyer can pick up a terraced home in TS1 or TS3 for under £100,000, which is why the gross yields at the cheaper end reach 8.2%, near the top of what England's rental markets produce. Middlesbrough grew its population 3.98% between the 2011 and 2021 censuses, from 138,412 to 143,926 residents.
The low prices reflect genuine local economics. Median gross weekly earnings of £676.50 sit just above the North East average of £669.90 but well below the Great Britain figure of £752.40, and the employment rate of 67.5% is some way under the national 75.6%. For an investor that combination cuts two ways: the entry cost is among the cheapest in England, but the tenant base leans more on wages and benefits than a higher-priced market. The spread runs from TS1 at £85,496 to TS9 at £309,590, so the borough holds both genuine high-yield stock and a quieter commuter-belt tail.
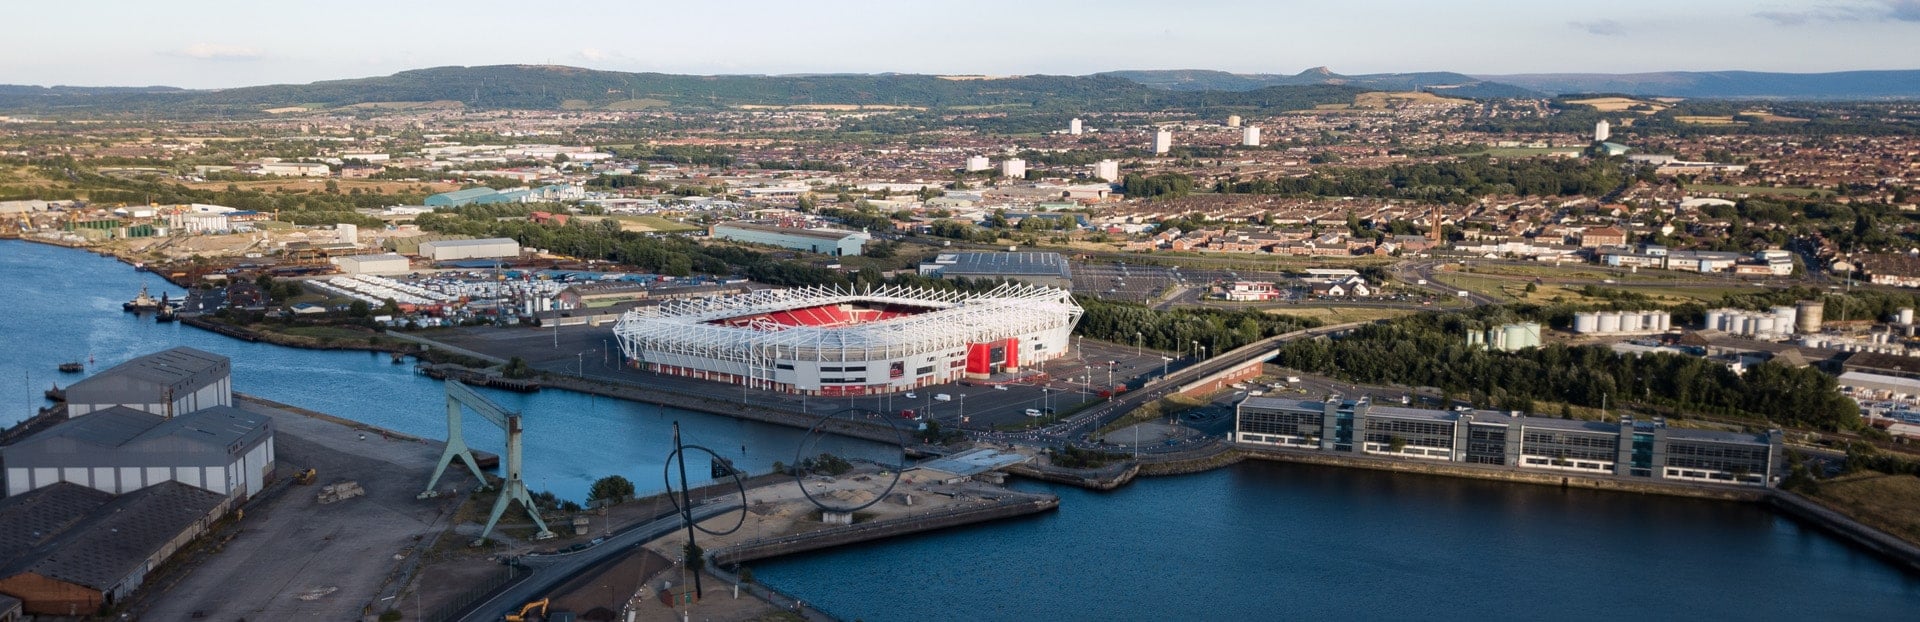
This guide covers the unitary authority of Middlesbrough (ONS code E06000002) across postcodes TS1, TS3, TS4, TS5, TS6, TS7, TS8, TS9, and TS17. Middlesbrough sits on the south bank of the River Tees in the North East, at the heart of the wider Teesside conurbation alongside Stockton-on-Tees and Redcar. Its industrial waterfront is now the site of Teesworks, the UK's largest freeport.
Article updated: July 2026

Why Invest in Middlesbrough?
Middlesbrough's population grew 3.98% between the 2011 and 2021 censuses, from 138,412 to 143,926 residents, slower than the England and Wales average of 6.3%. The town built its name on iron and steel, exporting the metal that built bridges from Sydney Harbour to the Tyne. That industrial base shrank over decades, and the local economy has been rebuilding around the river ever since. For an investor the appeal is straightforward: some of the cheapest housing stock in England, paired with a regeneration programme on the waterfront that is now drawing billions in private money.
The local employment rate of 67.5% sits below both the North East average and the Great Britain figure of 75.6%, and unemployment at 7.7% is higher than the national rate. This is an honest part of the picture. Middlesbrough's tenant demand leans more heavily on lower-wage employment and the benefits market than a town like Chester or York, which is why the Local Housing Allowance rate, covered in detail below, matters more here. Teesside University, with a campus in the town centre, adds a student population that supports rental demand in TS1.
Median gross annual earnings in Middlesbrough are £35,177, which is just above the North East regional median of £34,835 but 10.1% below the Great Britain median of £39,125. Lower wages mean lower rents in cash terms, but because prices are lower still, the yield maths works in the investor's favour. The combination that defines Middlesbrough is a low price base against modest but real local demand, rather than the high-wage, high-price profile of southern markets.
Middlesbrough Economic Summary
- Population (Middlesbrough): 143,926 (2021 Census). Growth of 3.98% from 2011.
- Median annual salary: £35,177 (local), £34,835 (North East), £39,125 (Great Britain)
- Employment rate: 67.5% (local), 75.6% (Great Britain)
- Unemployment rate: 7.7% (local)
- Key employment sectors: Health and social work, wholesale and retail, education, manufacturing, public administration
Source: ONS Census 2021, Nomis Labour Market Profile (ASHE 2025, Employment Oct 2024-Sep 2025)
Regeneration and Investment in Middlesbrough
Net Zero Teesside, a roughly £4 billion gas power and carbon capture project led by bp and Equinor on the Teesside Freeport, is the largest investment on the river since the original ICI works. It anchors a regeneration programme that runs from the industrial waterfront into the town centre, and it is the clearest reason the long-term jobs picture in Middlesbrough is improving rather than drifting.
- Net Zero Teesside Power (Active, ~£4 billion): Led by bp and Equinor on the Teesworks site, the gas-fired power station with carbon capture reached financial close in 2024, with construction contracts worth around £4 billion across the project and the linked Northern Endurance Partnership pipeline. It is expected to create and support up to 4,000 jobs through construction and operation, with first power targeted later this decade. Teesworks is the UK's largest freeport and industrial zone, also home to the £950 million SeAH Wind monopile factory. Updates at Teesworks.
- Crown Square, Gresham (Active, £200 million): Developers iMpec and Buccleuch Property, working with the Middlesbrough Development Corporation, secured approval in 2025 for a £200 million scheme in the Gresham area of the town centre. The plans include more than 230 build-to-rent homes, student accommodation for over 400, a Fairfield by Marriott hotel, and offices, with construction expected to begin in summer 2025. It is the town's largest central regeneration in a generation and adds purpose-built rental stock directly in TS1. Updates at Middlesbrough Council.
- Teesside Freeport and Tees Valley investment (Active): The Teesside Freeport, the largest in the UK at around 4,500 acres, spans Middlesbrough, Redcar and Stockton and offers tax and customs incentives that have drawn clean energy, offshore wind and advanced manufacturing occupiers to the south bank of the Tees. The jobs created across these sites underpin tenant demand in the more affordable Middlesbrough postcodes within commuting distance.
Source: Office for National Statistics - Population for Middlesbrough

Middlesbrough Property Market Analysis
Average property prices in Middlesbrough have risen 264.3% since January 1995, from £37,933 to £138,207. The sections below trace that journey cycle by cycle, then drill into current postcode-level data for sold prices, price per square foot, asking prices, growth trends, and monthly transaction volumes.
When was the last house price crash in Middlesbrough?
Middlesbrough is its own unitary authority, so all sold property prices from HM Land Registry are recorded at borough level. The Land Registry House Price Index tracks average prices from January 1995 to March 2026, covering 31 years of market cycles.
The 1995 to 2008 climb: Middlesbrough started at £37,933 in January 1995. Prices crept up through the late 1990s, reaching £40,238 by December 2000, then accelerated sharply through the 2000s housing boom. By December 2005 the average had more than doubled to £97,798, and the market peaked at £119,946 in January 2008.
2008 to 2013, a long, deep decline: Middlesbrough's downturn was harsher and slower than the national picture. Prices fell from the January 2008 peak of £119,946 to a trough of £92,181 in February 2013, a decline of 23.1% over five years. The worst year-on-year reading was -10.7% in August 2008. England's fall over the same crash was around 18%, so Middlesbrough's low-wage, low-equity market took a deeper hit and was slower to find a floor. The trough did not arrive until 2013, years after many southern markets had begun recovering.
2013 to 2019, a flat decade: Prices bounced off the 2013 trough but went almost nowhere for years. By December 2015 the average stood at £103,332, and by December 2019 it had inched only to £104,252. Middlesbrough spent the second half of the 2010s broadly flat, while prices in the South of England climbed steadily.
The pre-crash peak was not regained until January 2022. It took 14 years for Middlesbrough's average to climb back above its January 2008 peak of £119,946, when prices reached £121,003 in January 2022. That is one of the longest recoveries of any English market, and it shows how heavily the post-2008 decade weighed on the town.
2020 to 2022, the pandemic catch-up: The stamp duty holiday and a shift towards lower-cost regions finally moved Middlesbrough. Prices rose from £109,221 in December 2020 to £118,689 by December 2021, then £132,067 by December 2022, growth of 11.3% over that year. The cheap end of the market saw the strongest demand as buyers priced out elsewhere looked north.
2023 to present: Higher mortgage rates cooled the market. Prices held at £131,492 by December 2023 before rising to £135,828 in December 2024 and reaching an all-time high of £140,907 in November 2025. The latest reading has eased back slightly to £138,207 in March 2026, up 1.1% on the year. The current price stands 15.2% above the January 2008 pre-crash peak.
Long-term growth summary:
- 5 years (March 2021 to March 2026): 18.9% growth (£116,214 to £138,207)
- 10 years (March 2016 to March 2026): 37.6% growth (£100,424 to £138,207)
- 15 years (March 2011 to March 2026): 42.3% growth (£97,146 to £138,207)
- 20 years (March 2006 to March 2026): 38.6% growth (£99,687 to £138,207)
- 30 years (January 1995 to March 2026): 264.3% growth (£37,933 to £138,207)
Middlesbrough's 23.1% crash was deeper than the national average, and its 14-year recovery to the pre-crash peak was one of the slowest in England. The 30-year return of 264.3% is solid but trails higher-value markets, which is the trade-off of a low price base: the capital growth is steadier and slower, while the income return is among the highest in the country. An investor who bought at the exact peak in January 2008 would have waited until 2022 just to break even on the Land Registry average.
- All property types
- Detached
- Semi-detached
- Terraced
- Flats
- All property types
- Detached
- Semi-detached
- Terraced
- Flats
Sold House Prices in Middlesbrough
The average sold price across all property types in Middlesbrough is £138,207, which is 52.3% below the England average of £289,946 as of March 2026. That discount is one of the deepest of any town in the country, and it widens as you move down the property ladder. Detached houses sit 47.2% below England, but flats are 65.3% below. The pattern reflects a market where the affordable family stock is the core, and the smaller units sell for very little against national prices.
| Property Type | Middlesbrough Average | England Average | Difference |
|---|---|---|---|
| Detached houses | £248,376 | £470,492 | -47.2% |
| Semi-detached houses | £149,354 | £288,185 | -48.2% |
| Terraced houses | £108,410 | £243,788 | -55.5% |
| Flats and maisonettes | £74,383 | £214,563 | -65.3% |
| All property types | £138,207 | £289,946 | -52.3% |
Detached houses at £248,376 carry the smallest discount at 47.2% below England's £470,492. Middlesbrough's detached stock concentrates in TS7 (Nunthorpe, Marton) and TS8 (Coulby Newham, Stainton), the southern suburbs where family buyers compete for larger homes. Annual growth of 1.0% points to a steady rather than rising market at the top of the range.
Semi-detached houses at £149,354 are 48.2% below England's £288,185. This is the backbone of Middlesbrough's housing, found across nearly every postcode and especially in TS5 (Linthorpe, Acklam) and TS6 (Eston, Grangetown). Annual growth of 1.6% is the strongest of the four types, which makes the semi-detached the type doing most of the recent price work in the town.
Terraced houses at £108,410 sit 55.5% below England's £243,788. The terraced stock is densest in TS1 (Town Centre, Gresham) and TS3 (Park End, Berwick Hills), and at this price it is the engine of Middlesbrough's high-yield buy-to-let market. Annual growth of 1.4% sits just behind the semi-detached.
Flats and maisonettes at £74,383 show the deepest discount at 65.3% below England's £214,563. Middlesbrough is not a flat market in the way a big city is. The limited apartment stock is concentrated in TS1 around the town centre and university, and with annual change of -4.5% the flat segment is the one part of the market still drifting down rather than recovering.
Price Per Square Foot in Middlesbrough
£178 per square foot separates Middlesbrough's cheapest postcode from its most expensive, with TS1 at £84 and TS9 at £262. Measuring by the square foot controls for how big the homes are, so it compares the locations themselves rather than the house types. TS9 (Stokesley, Great Ayton) commands the highest rate by a wide margin, reflecting the rural village stock in the Cleveland Hills foothills south of the town.
| Rank | Area | Price Per Sq Ft |
|---|---|---|
| 1 | TS1 (Town Centre, Gresham) | £84 |
| 2 | TS3 (Park End, Berwick Hills) | £101 |
| 3 | TS4 (Longlands, Easterside) | £143 |
| 4 | TS6 (Eston, Grangetown) | £152 |
| 5 | TS5 (Linthorpe, Acklam) | £162 |
| 6 | TS17 (Thornaby, Ingleby Barwick) | £195 |
| 7 | TS7 (Nunthorpe, Marton) | £208 |
| 8 | TS8 (Coulby Newham, Stainton) | £210 |
| 9 | TS9 (Stokesley, Great Ayton) | £262 |
TS1 at £84 per square foot is the cheapest bricks-and-mortar value in the borough and one of the lowest in England. This covers the town centre, the university quarter and the terraced streets of Gresham. Based on 335 transactions analysed, TS1's space costs 68% less per square foot than TS9's. For a cash-yield strategy, this is where the numbers are most generous.
TS9 at £262 per square foot tops the table, more than three times TS1's rate. When buyers pay this much per square foot they are paying for setting rather than size. TS9 covers Stokesley and Great Ayton, semi-rural villages on the edge of the North York Moors that draw owner-occupiers rather than tenants. All 244 transactions analysed confirm a consistent premium over the rest of Middlesbrough.
For Sale Asking Prices in Middlesbrough
TS1 at £85,496 and TS9 at £309,590 sit 262% apart, the widest asking-price spread you will find across nine postcodes in a single town. That hierarchy follows the sold-price and square-foot picture, but the gap is more extreme. The mean asking price across all nine Middlesbrough postcodes is £187,754.
| Rank | Area | Asking Price |
|---|---|---|
| 1 | TS1 (Town Centre, Gresham) | £85,496 |
| 2 | TS3 (Park End, Berwick Hills) | £98,326 |
| 3 | TS4 (Longlands, Easterside) | £137,829 |
| 4 | TS6 (Eston, Grangetown) | £162,878 |
| 5 | TS5 (Linthorpe, Acklam) | £189,106 |
| 6 | TS17 (Thornaby, Ingleby Barwick) | £203,802 |
| 7 | TS8 (Coulby Newham, Stainton) | £219,196 |
| 8 | TS7 (Nunthorpe, Marton) | £283,560 |
| 9 | TS9 (Stokesley, Great Ayton) | £309,590 |
TS1 at £85,496 is the lowest asking price in Middlesbrough and the only postcode where a typical purchase sits below £90,000. The step up to TS3 is just £12,830, so the two cheapest postcodes form a tight, affordable band where the highest yields are found. For an investor with a fixed budget, TS1 and TS3 buy the most rental income per pound spent.
TS9's £309,590 is more than three and a half times TS1's asking price. Stokesley and Great Ayton are commuter villages, not part of the urban Middlesbrough market, and they read as premium owner-occupier territory. As the rental data below shows, no rental yield figure is recorded for TS9, which fits a market that sells to buyers rather than landlords.

House Price Growth in Middlesbrough
TS1 leads Middlesbrough on growth, up 44.2% over five years, the strongest reading in the town and well clear of the rest. Five of the nine postcodes grew across all three timeframes, and only TS7 is negative over five years. The cheapest postcodes, TS1 and TS3, have grown fastest, which is the pandemic catch-up story showing up at postcode level.
| Area | 1 Year | 3 Years | 5 Years |
|---|---|---|---|
| TS1 (Town Centre, Gresham) | 3.2% | 9.8% | 44.2% |
| TS6 (Eston, Grangetown) | -3.7% | 3.8% | 30.1% |
| TS3 (Park End, Berwick Hills) | 2.3% | 4.7% | 25.5% |
| TS4 (Longlands, Easterside) | -1.6% | -0.8% | 17.1% |
| TS5 (Linthorpe, Acklam) | 0.2% | 6.5% | 10.8% |
| TS17 (Thornaby, Ingleby Barwick) | 0.1% | 1.3% | 9.7% |
| TS9 (Stokesley, Great Ayton) | 3.3% | 4.4% | 8.2% |
| TS8 (Coulby Newham, Stainton) | 1.6% | 0.0% | 6.2% |
| TS7 (Nunthorpe, Marton) | -3.4% | -9.9% | -2.9% |
TS1 at 44.2% over five years posted the strongest growth in Middlesbrough by a clear margin. The town-centre and Gresham stock started from the lowest base in the borough, and the post-pandemic surge in low-cost housing pushed it hardest. TS1 is also positive across all three timeframes, pairing that growth with the joint-highest yield in the town.
TS7 is the only postcode down over five years at -2.9%, with the weakest three-year reading at -9.9%. Nunthorpe and Marton are the premium southern suburbs, where larger detached homes have softened while the cheaper stock recovered. The pattern across the table is consistent: in Middlesbrough, recent growth has favoured the affordable postcodes over the expensive ones.
Monthly Property Sales in Middlesbrough
Monthly transaction volumes range from 12 sales in TS9 to 53 in TS17, with 217 sales a month across the nine postcodes. Even the quietest village postcode sees regular turnover, and the busiest, TS17, sells more homes each month than the next two postcodes combined. Turnover rates run from 10% in TS9 to 23% in TS17.
| Area | Sales Per Month | Turnover | Asking Price |
|---|---|---|---|
| TS17 (Thornaby, Ingleby Barwick) | 53 | 23% | £203,802 |
| TS5 (Linthorpe, Acklam) | 37 | 13% | £189,106 |
| TS6 (Eston, Grangetown) | 24 | 15% | £162,878 |
| TS8 (Coulby Newham, Stainton) | 23 | 17% | £219,196 |
| TS7 (Nunthorpe, Marton) | 21 | 12% | £283,560 |
| TS3 (Park End, Berwick Hills) | 19 | 18% | £98,326 |
| TS1 (Town Centre, Gresham) | 14 | 15% | £85,496 |
| TS4 (Longlands, Easterside) | 14 | 16% | £137,829 |
| TS9 (Stokesley, Great Ayton) | 12 | 10% | £309,590 |
TS17's 23% turnover is the highest in Middlesbrough, with 53 sales a month against a relatively modern housing stock in Ingleby Barwick and Thornaby. A high turnover rate means homes change hands often, which matters to a landlord because it signals an easy exit when the time comes to sell. TS3 follows at 18%, pairing its low prices with an active market.
TS9 records the fewest sales at 12 a month and the lowest turnover at 10%. The village stock in Stokesley and Great Ayton is held for longer and trades less often, which is typical of higher-value rural postcodes. For an income investor that low liquidity is a reason to focus on the busier, cheaper postcodes nearer the town.
How Long Properties Take to Sell in Middlesbrough
TS17 (Thornaby, Ingleby Barwick) clears fastest at about 160 days, while TS9 (Stokesley, Great Ayton) sits for roughly 435 days, nearly three times as long. Days on market is the typical time a home is listed before it sells, and the months of unsold stock shows how much for-sale supply is queued at the current sales rate. The gap between TS17 and TS9 is a real holding cost an investor carries on the way out.
| Area | Avg Days to Sell | Months of Unsold Stock | Market |
|---|---|---|---|
| TS17 (Thornaby, Ingleby Barwick) | 160 | 5.3 | Seller's market |
| TS4 (Longlands, Easterside) | 169 | 5.6 | Seller's market |
| TS3 (Park End, Berwick Hills) | 179 | 5.9 | Seller's market |
| TS8 (Coulby Newham, Stainton) | 179 | 5.9 | Seller's market |
| TS6 (Eston, Grangetown) | 190 | 6.3 | Balanced market |
| TS1 (Town Centre, Gresham) | 203 | 6.7 | Balanced market |
| TS7 (Nunthorpe, Marton) | 234 | 7.7 | Balanced market |
| TS5 (Linthorpe, Acklam) | 254 | 8.3 | Balanced market |
| TS9 (Stokesley, Great Ayton) | 435 | 14.3 | Buyer's market |
The high-yield postcodes also sell quickly. TS3 and TS4 both clear inside 180 days in a seller's market, so the income postcodes are not income traps where capital sits stuck. TS9 is the exception at 435 days and 14.3 months of stock, the one buyer's market in Middlesbrough, which is another reason the rural premium postcodes suit owner-occupiers more than landlords.
What Type of Property Can You Buy in Middlesbrough?
The housing mix swings sharply by postcode, from terraced-and-flat TS1 where detached homes are just 8.4% of stock, to TS8 and TS9 where detached houses make up 61.1%. That spread shapes which strategy fits where. The figures below are drawn from 2021 Census records for each postcode.
| Area | Detached | Semi-detached | Terraced | Flats |
|---|---|---|---|---|
| TS1 (Town Centre, Gresham) | 8.4% | 8.9% | 40.6% | 41.9% |
| TS3 (Park End, Berwick Hills) | 6.6% | 40.7% | 34.4% | 18.1% |
| TS4 (Longlands, Easterside) | 11.5% | 46.5% | 28.7% | 13.3% |
| TS5 (Linthorpe, Acklam) | 15.5% | 50.8% | 24.8% | 8.9% |
| TS6 (Eston, Grangetown) | 14.4% | 52.9% | 22.5% | 10.2% |
| TS7 (Nunthorpe, Marton) | 43.0% | 34.4% | 13.8% | 8.5% |
| TS8 (Coulby Newham, Stainton) | 61.1% | 23.5% | 10.1% | 5.3% |
| TS9 (Stokesley, Great Ayton) | 61.1% | 21.0% | 15.1% | 2.4% |
| TS17 (Thornaby, Ingleby Barwick) | 34.3% | 35.0% | 20.2% | 10.5% |
TS1 is the only postcode where flats and terraces dominate, together making up more than 80% of the stock, with detached homes a tiny 8.4%. That is the small-unit, low-cost housing that drives the buy-to-let market, and it lines up with TS1 carrying the lowest asking price and the joint-highest yield in the town. The town-centre flats suit single lets and student sharers from nearby Teesside University.
TS8 and TS9 sit at the other end, both 61.1% detached with the smallest flat shares in the borough. These are owner-occupier postcodes built around family homes, which matches their premium asking prices and the absence of strong rental yields. TS5 and TS6 are the semi-detached heartland, each above 50% semis, the classic mid-market stock that lets steadily across Middlesbrough.
Flats here combine purpose-built blocks and converted units. A small number of mobile and temporary dwellings is not shown, so rows may not total 100%.

Middlesbrough Rental Market Analysis
Monthly rents in Middlesbrough run from £586 in TS1 to £848 in TS7, with gross rental yields from 3.6% to 8.2% across the eight postcodes that carry rental data. For investors asking is buy to let worth it in Middlesbrough, the sections below break down rents, yields and tenant affordability postcode by postcode. If you are weighing how to build a property portfolio in the North East, Middlesbrough offers some of the highest gross yields in England against a tenant base that depends more on the local jobs picture. Browse current buy-to-let homes for sale across the region.
Average Rent & Gross Rental Yields in Middlesbrough
Gross rental yields in Middlesbrough peak at 8.2% in both TS1 and TS3, and fall to 3.6% in TS7. The two cheapest postcodes deliver the highest yields, and the most expensive delivers the lowest. TS7 charges the highest rent at £848 a month but ranks last for yield because its £283,560 asking price is more than three times TS1's.
| Area | Average Monthly Rent | Asking Price | Gross Yield |
|---|---|---|---|
| TS1 (Town Centre, Gresham) | £586 | £85,496 | 8.2% |
| TS3 (Park End, Berwick Hills) | £668 | £98,326 | 8.2% |
| TS4 (Longlands, Easterside) | £753 | £137,829 | 6.6% |
| TS6 (Eston, Grangetown) | £702 | £162,878 | 5.2% |
| TS5 (Linthorpe, Acklam) | £787 | £189,106 | 5.0% |
| TS17 (Thornaby, Ingleby Barwick) | £789 | £203,802 | 4.6% |
| TS8 (Coulby Newham, Stainton) | £814 | £219,196 | 4.5% |
| TS7 (Nunthorpe, Marton) | £848 | £283,560 | 3.6% |
| TS9 (Stokesley, Great Ayton) | Not enough data | £309,590 | Not enough data |
TS1 and TS3 share the top yield at 8.2%. TS1 pairs the lowest rent in the town, £586 a month, with the lowest asking price, £85,496, and the maths still produces the joint-best return. A 30% deposit of £25,649 buys into the highest-yielding postcode in Middlesbrough, which is among the cheapest ways into a high-yield English market anywhere.
TS7 at 3.6% sits at the bottom of the priced yield rankings. The £848 monthly rent is the highest in the borough, but the £283,560 asking price compresses the return. TS9, the most expensive postcode, has too few rental listings to record a reliable rent or yield, so it carries an asking price but no income figure. In Middlesbrough the premium postcodes earn their keep through price, not rental income.
Gross Rental Yield by Postcode
Is Middlesbrough Rent High?
Monthly rents in Middlesbrough take between 20.0% and 28.9% of the local median gross monthly salary, so every postcode sits comfortably below the 30% affordability threshold. The widely cited line for rent affordability is 30% of gross income, and unusually for a buy-to-let town, no Middlesbrough postcode crosses it. That headroom is a direct result of low rents against a wage base that, while modest, still covers the cost of renting locally.
The median gross weekly salary in Middlesbrough is £676.50, which equates to £2,932 per month or £35,177 per year. This is just above the North East regional median of £669.90 a week and below the Great Britain median of £752.40 a week. Data from the Nomis Labour Market Profile (ASHE 2025).
| Rank | Area | Rent as % of Income |
|---|---|---|
| 1 | TS7 (Nunthorpe, Marton) | 28.9% |
| 2 | TS8 (Coulby Newham, Stainton) | 27.8% |
| 3 | TS17 (Thornaby, Ingleby Barwick) | 26.9% |
| 4 | TS5 (Linthorpe, Acklam) | 26.8% |
| 5 | TS4 (Longlands, Easterside) | 25.7% |
| 6 | TS6 (Eston, Grangetown) | 23.9% |
| 7 | TS3 (Park End, Berwick Hills) | 22.8% |
| 8 | TS1 (Town Centre, Gresham) | 20.0% |
| Not enough data | TS9 (Stokesley, Great Ayton) | Not enough data |
TS1 at 20.0% is the most affordable for tenants in the town, with a £586 rent against a £2,932 monthly salary leaving real headroom. That affordability matters to a landlord because it correlates with lower arrears and fewer voids: a tenant who is not stretched tends to stay put. The high-yield postcodes here are also the most affordable to rent, which is a healthier combination than a market where the best yields come from rents tenants struggle to pay.
TS7 at 28.9% is the least affordable, but it is still under the 30% threshold. The £848 rent in Nunthorpe and Marton suits dual-income professional households rather than single earners on the median salary, which is the same demographic that drives the premium asking prices in those suburbs.
How Big Is Middlesbrough's Private Rented Sector?
The private rented sector is deepest in TS1, where 40.7% of households rent privately, and thinnest in TS8 at 8.9%. The share of homes already rented privately is a guide to how established the local tenant pool is. The table below shows household tenure by postcode.
| Area | Owned Outright | Owned with Mortgage | Private Rented | Social Rented |
|---|---|---|---|---|
| TS1 (Town Centre, Gresham) | 11.5% | 7.4% | 40.7% | 39.5% |
| TS3 (Park End, Berwick Hills) | 17.7% | 17.6% | 22.3% | 41.7% |
| TS4 (Longlands, Easterside) | 19.4% | 27.5% | 21.3% | 31.1% |
| TS17 (Thornaby, Ingleby Barwick) | 29.2% | 38.5% | 18.6% | 12.5% |
| TS5 (Linthorpe, Acklam) | 32.5% | 35.7% | 17.7% | 13.6% |
| TS9 (Stokesley, Great Ayton) | 53.2% | 26.6% | 13.8% | 6.1% |
| TS6 (Eston, Grangetown) | 27.1% | 25.3% | 12.1% | 35.0% |
| TS7 (Nunthorpe, Marton) | 40.8% | 39.9% | 9.8% | 9.0% |
| TS8 (Coulby Newham, Stainton) | 43.5% | 37.6% | 8.9% | 9.7% |
TS1 has by far the largest private rented sector at 40.7%, the deepest tenant pool in the borough and a sign of an established lettings market around the town centre and university. It pairs that with a 39.5% social rented share, so owner-occupation in TS1 is the exception rather than the rule. TS3 and TS4 also carry sizeable rented sectors above 21%, and both sit among the higher-yield postcodes.
TS8 and TS7 have the smallest private rented sectors at 8.9% and 9.8%, with owner-occupation above 80% in both. These are settled family-ownership postcodes where rental stock is scarce. For a landlord, the read is clear: the established rental demand sits in the cheaper northern and central postcodes, not the southern suburbs.
On the rental supply side, TS1, TS3, TS5 and TS17 have enough homes advertised to read the market with confidence, and all four currently favour landlords or sit balanced. In TS3, around 38 homes were on the rental market, letting in roughly 48 days, which points to firm tenant demand against limited supply. TS17 lets even faster, in about 59 days, while TS1 takes a steadier 122 days across a larger pool of town-centre stock.
Local Housing Allowance Rates in Middlesbrough
All nine Middlesbrough postcodes fall within the Teesside Broad Rental Market Area, where Local Housing Allowance runs from £66.50 a week for a shared room to £172.60 a week for a four-bedroom home. Local Housing Allowance is the most a tenant on housing support can receive towards rent, so for that part of the market it sets an effective floor. Because Middlesbrough's tenant base depends more on the benefits market than higher-wage towns, this rate carries more weight here than in most of England. The rates below apply across the whole of Middlesbrough. To check the current rate for a specific address, you can use the government's official Local Housing Allowance calculator.
| Property Size | Weekly LHA Rate | Monthly Equivalent |
|---|---|---|
| Shared accommodation | £66.50 | £288 |
| 1 bedroom | £94.36 | £409 |
| 2 bedrooms | £109.32 | £474 |
| 3 bedrooms | £126.58 | £549 |
| 4 bedrooms | £172.60 | £748 |
The two-bedroom LHA rate of £109.32 a week works out at around £474 a month, which sits below the £586 to £848 open-market rents recorded across Middlesbrough's postcodes. A benefit-backed tenancy therefore lands under market rent, and the stock that fits within these rates is concentrated in TS1 and TS3, where both prices and rents are lowest. In a town where a large share of households rent socially or claim support, letting at or near the LHA rate is a realistic strategy rather than a fallback, which is part of why the cheaper postcodes hold their tenant demand.
Buy-to-Let Considerations
Are House Prices High in Middlesbrough? Price-to-Earnings Ratios
Buying a property in Middlesbrough takes between 2.4 and 8.8 times the median annual salary, and most postcodes sit below the national benchmark. This is based on the Nomis Labour Market Profile for Middlesbrough showing the median gross annual income for Middlesbrough residents is £35,177.
The national benchmark for price-to-earnings is 7.4x (England's average sold price of £289,946 divided by the Great Britain median annual salary of £39,125). Seven of Middlesbrough's nine postcodes sit below that national benchmark, meaning they are more affordable relative to local incomes than the England average is relative to national incomes.
| Rank | Area | Price-to-Earnings Ratio |
|---|---|---|
| 1 | TS1 (Town Centre, Gresham) | 2.4x |
| 2 | TS3 (Park End, Berwick Hills) | 2.8x |
| 3 | TS4 (Longlands, Easterside) | 3.9x |
| 4 | TS6 (Eston, Grangetown) | 4.6x |
| 5 | TS5 (Linthorpe, Acklam) | 5.4x |
| 6 | TS17 (Thornaby, Ingleby Barwick) | 5.8x |
| 7 | TS8 (Coulby Newham, Stainton) | 6.2x |
| 8 | TS7 (Nunthorpe, Marton) | 8.1x |
| 9 | TS9 (Stokesley, Great Ayton) | 8.8x |
TS1 at 2.4x is the most affordable entry in Middlesbrough and one of the lowest price-to-earnings ratios you will find anywhere in England. A home at little more than two years of local earnings is what makes the high yields possible. TS3 at 2.8x is barely behind, so the two top-yielding postcodes are also the two most affordable against local wages.
TS9 at 8.8x and TS7 at 8.1x are the only postcodes above the national benchmark. These are the rural and suburban premium areas where larger homes push the ratio up. For an investor the message is consistent across every measure on this page: the value sits in the cheaper postcodes, and the price ladder above them buys lifestyle rather than yield.
Deposit Requirements in Middlesbrough
A 30% deposit on a buy-to-let property in Middlesbrough ranges from £25,649 in TS1 to £92,877 in TS9. The gap between the cheapest and most expensive deposit is £67,228, but the figure that stands out is the bottom of the range: a deposit under £26,000 buys into the highest-yielding postcode in the town. For investors comparing Middlesbrough with other markets, these deposit requirements are among the lowest in England, which is what lets a smaller pot of capital go further here.
Beyond the deposit, the stamp duty calculation and other running costs of a buy-to-let affect the total capital required.
| Rank | Area | 30% Deposit Required |
|---|---|---|
| 1 | TS1 (Town Centre, Gresham) | £25,649 |
| 2 | TS3 (Park End, Berwick Hills) | £29,498 |
| 3 | TS4 (Longlands, Easterside) | £41,349 |
| 4 | TS6 (Eston, Grangetown) | £48,863 |
| 5 | TS5 (Linthorpe, Acklam) | £56,732 |
| 6 | TS17 (Thornaby, Ingleby Barwick) | £61,141 |
| 7 | TS8 (Coulby Newham, Stainton) | £65,759 |
| 8 | TS7 (Nunthorpe, Marton) | £85,068 |
| 9 | TS9 (Stokesley, Great Ayton) | £92,877 |
TS1 is the cheapest way into Middlesbrough at a £25,649 deposit, and it buys the joint-highest yield. Stepping up to TS3 costs only £3,849 more for the same 8.2% yield in a slightly larger semi-detached and terraced market. The two cheapest postcodes are not just the highest-yielding, they are also where a deposit under £30,000 is enough to get started, which is rare for a market producing returns this high.
At the top end, TS9's £92,877 deposit is more than three and a half times TS1's, and it buys a rural village home with no recorded rental yield. The contrast frames the whole town: a small deposit in TS1 or TS3 chases income, while a large one in TS7 or TS9 chases lifestyle and slow, steady capital. The deposit you bring decides which Middlesbrough you are buying into.

What the Middlesbrough Data Tells Buy-to-Let Investors
In Middlesbrough the cheapest way in is also the highest-yielding, and by a wide margin. TS1 carries the joint-top yield at 8.2%, the lowest asking price for an investment property in Middlesbrough at £85,496, the strongest five-year growth at 44.2%, and the most affordable prices against local earnings at 2.4 times income. A 30% deposit there is £25,649, the lowest in the town, for a home renting at £586 a month.
TS3 shadows TS1 closely, sharing the 8.2% top yield on a £98,326 asking price, with 25.5% five-year growth and a deeper supply of semi-detached and terraced family stock. Together TS1 and TS3 form the income core of Middlesbrough, where the high yields, low deposits and quick selling times all line up. TS4 at 6.6% is the next step out, still a strong yield on a £137,829 asking price.
The southern suburbs read differently. TS7 carries the highest rent at £848 a month, but with a 3.6% yield and a price-to-earnings ratio of 8.1x, the premium price does more for the rent than for the return. TS9 sits outside the rental market altogether, a rural village postcode that sells to owner-occupiers and takes 435 days to do it. Buyers chasing a discount to asking often work the off-market property routes, which matters more in the slower premium postcodes than in the brisk TS1 and TS3.
Middlesbrough has no selective licensing scheme covering the whole borough, though a scheme runs in part of the town, so landlords should check the current position for their specific area on the council's property licensing pages. With wages and employment below the national average, the town's gross yields are among the highest in England, while long-run price growth is slower and the tenant base more sensitive to the local economy.
How Middlesbrough Compares
Middlesbrough's mean asking price of £187,754 is the third lowest of five North East locations compared here, yet its top yield of 8.2% comfortably clears Durham's 5.5%, with only the coastal cities reading higher. The comparison below places Middlesbrough alongside four nearby markets, each with a different investor profile. The mean asking price and mean monthly rent are simple averages across all postcodes with data. Top gross yield is the single highest postcode yield in each location.
| Location | Mean Asking Price | Mean Monthly Rent | Mean Gross Yield | Top Yield (postcode) |
|---|---|---|---|---|
| Sunderland | £163,026 | £698 | 5.1% | 12.0% (SR1) |
| Hull | £175,684 | £742 | 5.1% | 9.7% (HU2) |
| Middlesbrough | £187,754 | £743 | 4.7% | 8.2% (TS1, TS3) |
| Durham | £190,986 | £793 | 5.0% | 5.5% (DH7, DH9) |
| Newcastle | £262,699 | £1,122 | 5.1% | 9.3% (NE1) |
Middlesbrough sits in the middle of this group on price at £187,754, just below Durham and above Sunderland and Hull. Its 8.2% top yield outpaces Durham's 5.5% comfortably, but trails Hull's 9.7%, Newcastle at 9.3%, and the thin-market 12.0% that tops Sunderland's table. The mean rent of £743 is among the lowest here, which is the flip side of the low asking prices.
For investors prioritising raw yield, Sunderland's SR1 reads highest on a thin market, while Hull and Newcastle deliver the strongest returns on deeper stock, though Newcastle does so on a much higher mean asking price. Sunderland has the lowest mean asking price in the group, while Durham trades yield for a more stable, university-anchored tenant base. Middlesbrough's pitch is the balance: a low asking price and a high yield together, with the Teesworks regeneration as the longer-term tailwind. For a data-driven comparison across the country, see our guide to the highest-yielding areas for buy-to-let.
Frequently Asked Questions
Is Middlesbrough a good place to live for buy-to-let tenants?
It works for tenants on a budget, and that is the heart of the proposition. Rents here are low in cash terms, from £586 a month in TS1, and they take only 20% to 29% of the typical local wage, so renting in Middlesbrough is genuinely affordable. For a landlord, affordable rent tends to mean a tenant who can keep paying and stays put.
The honest caveat is the jobs picture. Employment sits at 67.5%, below the national 75.6%, and wages are lower than the Great Britain average. The town centre and the cheaper northern postcodes lean on lower-wage work and the benefits market, so tenant demand there is steadier at the affordable end than at the top.
What are the best areas in Middlesbrough for property investment?
If income is the goal, the two town-centre postcodes lead and there is little to separate them. TS1 (Town Centre and Gresham) is the cheapest way in at £85,496 and carries the joint-top yield at 8.2%, with the strongest five-year growth in the town at 44.2%. TS3 (Park End and Berwick Hills) matches that 8.2% yield on a slightly higher £98,326 price, with a deeper supply of semi-detached and terraced family homes.
If you want a bit more property for a still-strong yield, TS4 at 6.6% on a £137,829 price is the next step. The southern suburbs, TS7, TS8 and TS9, are where prices climb and yields fall, so they suit capital-led buyers and owner-occupiers more than income investors. In short, the value sits in the cheaper northern and central postcodes.
Why are property prices so low in Middlesbrough?
It comes down to local economics. The average sold price is £138,207, 52.3% below the England average, and that reflects a town with lower wages, an employment rate of 67.5% and a long industrial decline that the local economy is still recovering from. Prices fell harder than the national average in the 2008 crash and took 14 years to regain their pre-crash peak.
For an investor, low prices are not automatically a problem. They are the reason gross yields reach 8.2% in TS1 and TS3, among the highest in England. The trade-off is slower capital growth and a tenant base more exposed to the local jobs market.
Can I find buy-to-let property under £100,000 in Middlesbrough?
Yes, and that is unusual for a market producing yields this high. Two whole postcodes average under £100,000: TS1 (Town Centre, Gresham) at £85,496 and TS3 (Park End, Berwick Hills) at £98,326, both carrying the joint-top 8.2% gross yield. By property type, terraced houses across Middlesbrough average £108,410 and flats just £74,383 on the Land Registry index, so sub-£100,000 stock is the norm rather than the exception in the cheaper areas. If a low asking price is the priority, TS1 and TS3 terraces are the place to look, or explore below market value properties to buy below those figures.
Is there demand for student accommodation in Middlesbrough?
Yes, and it concentrates in the town centre. Teesside University's main campus sits in TS1, where the low rents, £586 a month on average, make shared student lets workable. TS1 also has the largest flat and terraced stock in the borough and the deepest private rented sector at 40.7%, so the supporting market is already in place. Student lets come with summer voids and more hands-on management than a standard tenancy, so factor that in. For the purpose-built end of the market, see our guide to student property investment.
On the HMO side, a sample of current TS1 room adverts puts a double room with a shared bathroom at around £96 a week, with most between £72 and £120 (the middle 80% of 24 adverts). That was the only room type with enough live listings for a reliable figure, so ensuite and single-room rents in Middlesbrough are harder to pin down. For how the numbers work on a shared house, see our HMO investment guide.
How will Teesworks affect Middlesbrough property prices?
It is a long-term tailwind rather than an overnight one. Teesworks and the Teesside Freeport are drawing billions in clean-energy and manufacturing investment, with Net Zero Teesside alone worth around £4 billion and supporting up to 4,000 jobs. More secure local employment supports rental demand, which is the mechanism that feeds through to property over time.
The effect will not be uniform. The jobs land on the industrial south bank of the Tees, so the postcodes within commuting distance and the more affordable rental areas stand to benefit most. As with any large scheme, the impact builds over years as sites are completed and hiring ramps up, not in a single price jump.
What are average house prices in Middlesbrough?
The average sold price across Middlesbrough is £138,207 on the Land Registry index, about 52.3% below the England average of £289,946 as of March 2026. Asking prices by postcode run from £85,496 in TS1 (Town Centre, Gresham) up to £309,590 in TS9 (Stokesley, Great Ayton), with a town-wide mean of £187,754. By type, detached homes average £248,376, semi-detached £149,354, terraced £108,410 and flats £74,383.
Through a buy-to-let lens, TS1 and TS3 are the cheapest entries and the joint-highest-yielding at 8.2%, while TS9 is the dearest and falls outside the rental market.
What are the Local Housing Allowance rates in Middlesbrough?
All nine Middlesbrough postcodes fall in the Teesside Broad Rental Market Area, so they share one set of rates. As of June 2026, Local Housing Allowance runs at £66.50 a week for a shared room, £94.36 for a one-bed, £109.32 for two beds, £126.58 for three and £172.60 for four. That figure is the most a tenant on housing support can claim towards rent, and in a town where the benefits market is a meaningful share of tenant demand, it effectively sets a rent floor for that part of the market.
What type of property is most common in Middlesbrough?
It varies more by postcode here than in most towns. Semi-detached houses dominate the mid-market postcodes, above 50% of stock in TS5 and TS6, while detached homes make up 61.1% of TS8 and TS9 in the southern suburbs. The smaller stock that usually suits buy-to-let, terraces and flats, is concentrated in TS1, where they make up more than 80% of homes between them. So the housing you buy depends heavily on which part of Middlesbrough you choose.
How do I buy an investment property in Middlesbrough?
Decide first whether you are buying for income or for growth, because in Middlesbrough that points you at opposite ends of the town. For income, TS1 (Town Centre, Gresham) and TS3 (Park End, Berwick Hills) are the cheapest entries at £85,496 and £98,326 and carry the joint-top 8.2% yield. For slower, steadier capital, the southern suburbs like TS7 and TS9 cost more and yield less. Budget for a 30% deposit, which runs from £25,649 in TS1 to £92,877 in TS9.
Beyond what is listed openly, plenty of experienced investors buy below asking through off-market property channels. To see what is available now, browse investment properties or buy-to-let homes for sale.
Ready to buy property?
Access off-market investment properties with an average 8%+ annual gross yield (beating the UK's typical 3-5%).
Get property alerts