Newham is a borough of east London. Terraced houses in Newham sell for an average of £450,437, which is 84.8% above the England average of £243,788 and the widest premium of any property type in the borough. That single figure captures how East London prices work: the modest two-up-two-down that costs £150,000 in the North West carries a London tag here, and it is the terraces, not the detached stock, that stretch furthest above the national line. Across all property types the Newham average sits at £384,258 on the HM Land Registry House Price Index, 32.5% above England yet well below the £542,378 London average, which is what keeps the borough on the affordable end of the capital.
Newham's population reached 351,036 at the 2021 Census, a 13.98% rise from 307,984 in 2011 and one of the fastest growth rates of any London borough. The median gross weekly salary of £819.10 sits below the London median of £892.60 but above the Great Britain figure of £752.40, and the local employment rate of 66.2% runs under the national 75.6%, so the tenant base leans towards a younger, lower-earning, high-turnover population rather than the settled professional demographic of outer London. For investors, the spread runs from IG11 in Barking at a £309,058 asking price up to E20 at the Olympic Park at £591,224, a two-tier borough where the highest yields sit with the cheapest postcodes.
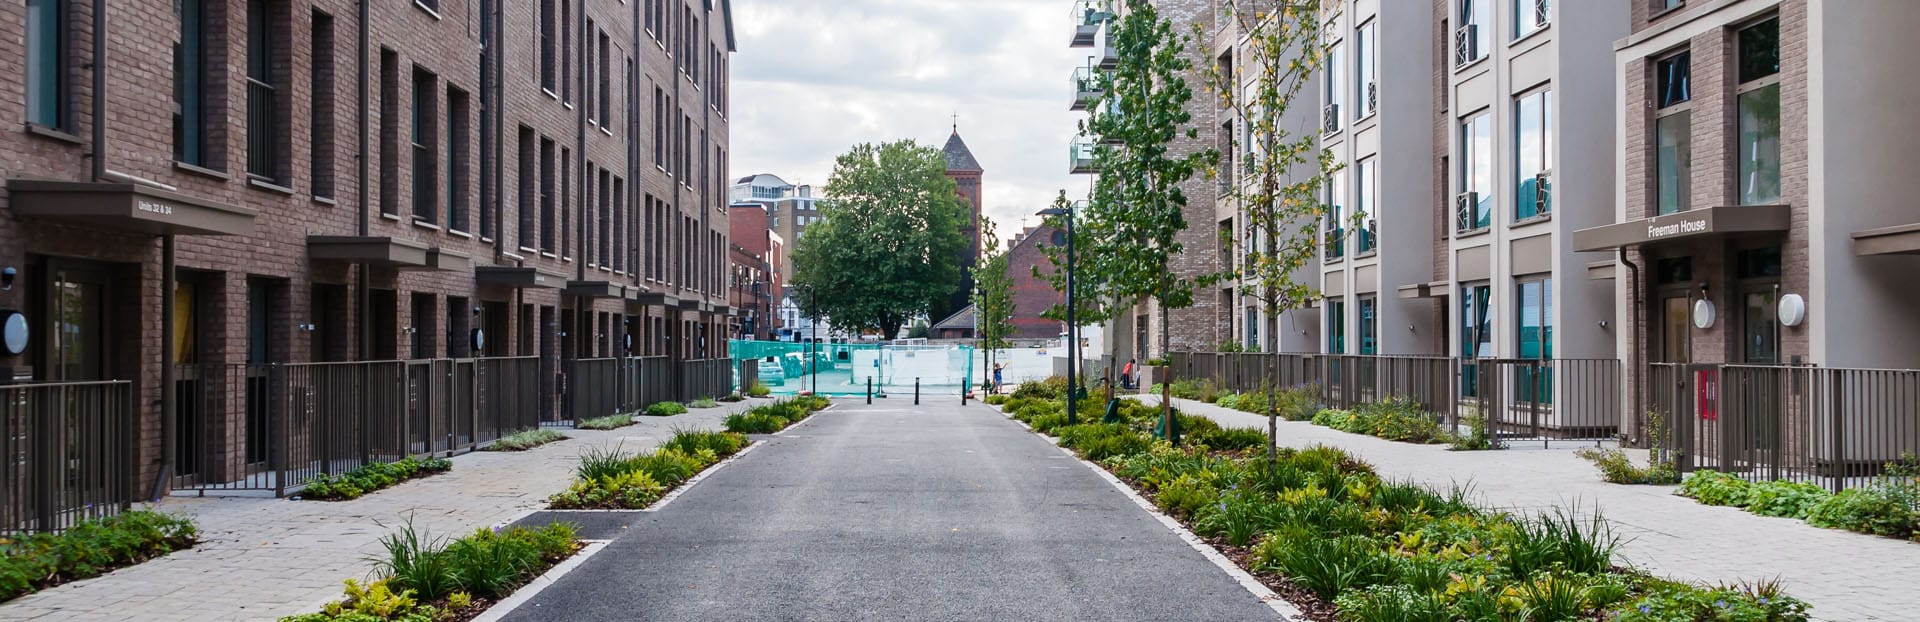
This guide covers the London Borough of Newham (ONS code E09000025) across the E6, E7, E12, E13, E15, E16 and E20 postcodes, plus IG11 to the east in Barking. Newham sits in East London, bordered by Tower Hamlets to the west, Hackney and Waltham Forest to the north, Redbridge to the east and the River Thames to the south. The wider East London market also takes in Barking and Redbridge next door.
Article updated: July 2026

Why Invest in Newham?
Newham added 43,052 residents between the 2011 and 2021 censuses, a 13.98% rise to 351,036 people that ranks it among the fastest-growing local authorities in the country. That growth rate is more than double the England and Wales average of 6.3%, and it is the demand side of the buy-to-let equation: more people, arriving faster than the housing stock can expand, in a borough where more than a third of homes are already rented privately. Newham's pull is proximity and price. It sits directly east of the City and Canary Wharf, with fares and prices that undercut the boroughs immediately west of it.
The local employment rate of 66.2% is below both the London average and the Great Britain figure of 75.6%, and unemployment at 6.2% runs above the national line. This is a working borough rather than a wealthy one, and the tenant base reflects that: younger households, a large share of service and logistics workers around the Royal Docks and Stratford, and students at the two University of East London campuses. Rents are set by London demand rather than by local wages, which is why affordability runs tight across every postcode.
The median gross weekly salary in Newham is £819.10, which works out at £42,595 a year. That is below the London median of £892.60 a week but comfortably above the Great Britain median of £752.40. Newham is one of the best-connected boroughs in London, served by the Elizabeth line, the Jubilee line, the DLR, London Overground and national rail from Stratford, with London City Airport inside the borough. That connectivity is what lets a borough with below-average local wages sustain above-average rents, because the tenant pool reaches across the whole East London jobs market.
Newham Economic Summary
- Population (Newham): 351,036 (2021 Census). Growth of 13.98% from 2011.
- Median annual salary: £42,595 (local), London £892.60 per week, £39,125 (Great Britain)
- Employment rate: 66.2% (local), 75.6% (Great Britain)
- Unemployment rate: 6.2% (local)
- Key employment sectors: Transport and storage, wholesale and retail, accommodation and food, health and social work, construction
Source: ONS Census 2021, Nomis Labour Market Profile (ASHE 2025, Employment 2024-2025)
Regeneration and Investment in Newham
Newham is the most heavily regenerated borough in East London, anchored by the Queen Elizabeth Olympic Park in Stratford and the multi-billion-pound Royal Docks Enterprise Zone in the south. The 2012 Olympic legacy turned a former industrial site into the East Village housing district, the London Stadium and the Westfield Stratford City centre, and the development pipeline around it is still running more than a decade on.
- Queen Elizabeth Olympic Park and Stratford (E20, ongoing): The 2012 Olympic site has become East Village, a permanent residential neighbourhood, alongside the London Stadium, the Here East technology campus and the East Bank cultural quarter bringing the BBC, Sadler's Wells, the V&A and University College London to Stratford. The E20 postcode was created for the Olympic Park and remains the borough's newest and most expensive market. Updates at Queen Elizabeth Olympic Park.
- Royal Docks Enterprise Zone (E16, active): The former Royal Docks in the south of the borough form one of London's designated Enterprise Zones, with billions of pounds of investment planned across new homes, business space and public realm along the Thames. The zone covers Canning Town, Silvertown and North Woolwich, the E16 postcode that already carries the deepest for-sale stock in Newham. Updates at Royal Docks Enterprise Zone.
- Silvertown Tunnel (E16, opened 2025): The new road tunnel under the Thames links Silvertown in Newham to the Greenwich Peninsula, opening in 2025 to improve cross-river connectivity in the south of the borough. Better road links into South East London widen the commuter catchment for the Royal Docks residential schemes. Updates at Transport for London.
Newham Property Market Analysis
Average property prices in Newham have risen 586.9% since January 1995, from £55,939 to £384,258, but the more revealing figure is the recent fall from the March 2024 high of £445,489. The sections below break down that journey cycle by cycle, then drill into current postcode-level data for sold prices, price per square foot, asking prices, growth trends, and monthly transaction volumes.
When was the last house price crash in Newham?
Newham's sold prices are recorded by HM Land Registry at borough level, covering the London Borough of Newham as a whole. The Land Registry House Price Index tracks average prices from January 1995 to March 2026, spanning 31 years of market cycles.
The 1995 to 2008 boom: Newham started at £55,939 in January 1995. By December 2000 the average had reached £104,145, and the early-2000s London surge carried it to £206,513 by December 2005. Growth kept running until the market peaked at £247,223 in January 2008, more than four times its 1995 level.
2008 to 2009, the financial crisis: Prices fell from the January 2008 peak of £247,223 to a trough of £190,613 in June 2009, a decline of 22.9% over 17 months. The worst year-on-year reading was -21.0% in June 2009. Newham's fall was steeper than the England correction, reflecting the exposure of a lower-priced London market where more buyers were stretched at the top of the boom.
Recovery, 2010 to 2014: Prices climbed off the trough, reaching £217,382 by December 2010 and £239,851 by December 2013. The average first passed the pre-crash peak of £247,223 in April 2014, at £253,363. It took just over six years to recover, faster than many markets outside London.
The 2014 to 2016 Olympic surge: Stratford's post-Olympic transformation and a wider East London re-rating turbocharged Newham. Prices jumped to £367,117 by June 2016, a year-on-year gain of 19.8%, and reached £369,117 by December 2016. In two and a half years the borough added more than £115,000 to its average price.
2017 to 2019, the plateau: Growth flattened after the surge. The average moved from £369,117 in December 2016 to £377,286 by December 2019, annual growth easing to 1.7% as the post-Olympic re-rating ran out of road.
2020 to 2024, the pandemic run: The stamp duty holiday and renewed demand pushed prices to £399,010 by December 2020 and £427,572 by December 2022. The average reached its all-time high of £445,489 in March 2024.
2024 to present, the easing: Since that March 2024 peak, Newham has softened. Prices fell to £428,508 by December 2024, £399,866 by December 2025 and £384,258 by March 2026, a drop of 13.7% from the high and a -6.5% year-on-year reading at the latest month. The current price is 55.4% above the January 2008 pre-crash peak but below where the borough stood two years ago.
Long-term growth summary:
- 5 years (March 2021 to March 2026): -7.0% (£413,082 to £384,258)
- 10 years (March 2016 to March 2026): 9.4% growth (£351,211 to £384,258)
- 15 years (March 2011 to March 2026): 82.1% growth (£211,034 to £384,258)
- 20 years (March 2006 to March 2026): 89.9% growth (£202,396 to £384,258)
- 30 years (January 1995 to March 2026): 586.9% growth (£55,939 to £384,258)
Newham's 22.9% crash was deeper than the national fall, and its 30-year return of 586.9% is among the strongest in the country, built on the Olympic re-rating that reset the whole borough. The stand-out feature of the current data is the last two years: after the March 2024 high of £445,489, the average has given back 13.7%, and the five-year return is now negative. An investor who bought at the March 2024 peak is holding a paper loss, while one who bought at the 2009 trough has more than doubled their money on the Land Registry average.
- All property types
- Detached
- Semi-detached
- Terraced
- Flats
- All property types
- Detached
- Semi-detached
- Terraced
- Flats
Sold House Prices in Newham
The average sold price across all property types in Newham is £384,258, which is 32.5% above the England average of £289,946 as of March 2026. Unlike most of the country, that premium widens rather than narrows as you move down the property ladder. Detached houses carry the smallest premium at 51.1% above England, while terraced houses sit 84.8% above and flats 49.5% above. In Newham the everyday London home, the terrace and the flat, is what pays the London tax.
| Property Type | Newham Average | England Average | Difference |
|---|---|---|---|
| Detached houses | £710,799 | £470,492 | +51.1% |
| Semi-detached houses | £492,637 | £288,185 | +70.9% |
| Terraced houses | £450,437 | £243,788 | +84.8% |
| Flats and maisonettes | £320,871 | £214,563 | +49.5% |
| All property types | £384,258 | £289,946 | +32.5% |
Detached houses at £710,799 carry the smallest premium over England at 51.1%, though they are rare in Newham. Genuine detached stock is scattered across the older residential fringes of Forest Gate and Manor Park rather than concentrated anywhere, and annual change of -3.7% shows the top of the market easing alongside the borough average.
Semi-detached houses at £492,637 sit 70.9% above England's £288,185. The semi-detached stock concentrates in the inter-war streets of East Ham, Manor Park and Plaistow, and forms the family-home end of Newham's lettings market. Annual change of -4.2% tracks the wider softening from the 2024 high.
Terraced houses at £450,437 carry the widest premium in the borough at 84.8% above England's £243,788. Victorian and Edwardian terraces are the dominant house type across East Ham, Forest Gate and Plaistow, and they are the workhorse of Newham buy-to-let, suited to family lets and to conversion into shared houses. Annual change of -4.3% puts terraces in line with the borough's recent correction.
Flats and maisonettes at £320,871 sit 49.5% above England's £214,563, a far larger premium than the discount flats show almost everywhere else in the country. Newham is a flat-heavy borough, weighted towards the new-build blocks of Stratford, Canning Town and the Royal Docks, and those apartments carry a London price. Annual change of -8.0% is the steepest fall of any property type, reflecting how much new-build flat stock has come to market at once.
Price Per Square Foot in Newham
Bricks-and-mortar value in Newham runs from £432 per square foot in IG11 up to £758 in E20, a £326 gap across a single borough. Measuring by the square foot strips out how big the homes are and compares the underlying value of each location. E20 (Olympic Park, Stratford City) commands the highest rate by a clear margin, the price of the borough's newest, best-connected apartment stock.
| Rank | Area | Price Per Sq Ft |
|---|---|---|
| 1 | IG11 (Barking) | £432 |
| 2 | E13 (Plaistow) | £461 |
| 3 | E6 (East Ham, Beckton) | £464 |
| 4 | E12 (Manor Park) | £479 |
| 5 | E7 (Forest Gate) | £545 |
| 6 | E15 (Stratford) | £561 |
| 7 | E16 (Canning Town, Royal Docks) | £572 |
| 8 | E20 (Olympic Park, Stratford City) | £758 |
IG11 at £432 per square foot is the cheapest space in the borough, drawn from 492 transactions in Barking to the east of Newham proper. The older terraced and post-war stock around Barking town centre gives the most floor area for the money, which is why IG11 also carries the lowest asking price and the highest yield.
E20 at £758 per square foot tops the table on a smaller sample of 64 transactions, the price of the purpose-built apartments of East Village and the Olympic Park. Paying £758 a foot buys the newest stock in the best-connected corner of the borough, but it also means the least floor area for each pound spent, which is what compresses the E20 yield despite its high rents.
For Sale Asking Prices in Newham
IG11 at £309,058 and E20 at £591,224 sit 91.3% apart, the widest asking-price spread in the borough. That hierarchy tracks sold prices, running from the older stock in Barking up to the new-build core at the Olympic Park. The mean asking price across all eight Newham postcodes is £437,735.
| Rank | Area | Asking Price |
|---|---|---|
| 1 | IG11 (Barking) | £309,058 |
| 2 | E13 (Plaistow) | £395,305 |
| 3 | E6 (East Ham, Beckton) | £408,193 |
| 4 | E15 (Stratford) | £432,654 |
| 5 | E16 (Canning Town, Royal Docks) | £436,794 |
| 6 | E12 (Manor Park) | £443,999 |
| 7 | E7 (Forest Gate) | £484,652 |
| 8 | E20 (Olympic Park, Stratford City) | £591,224 |
IG11 at £309,058 is the only postcode where a Newham purchase falls below £350,000, and it sits £86,247 below the next-cheapest, E13. That is the biggest step between any two adjacent postcodes in the table. For an investor with a fixed budget, IG11 in Barking offers the most property for the money and the lowest barrier to entry.
E20's £591,224 asking price stands £106,572 clear of the next postcode, E7. The Olympic Park stock is premium owner-occupier and professional-renter territory, priced for its new-build quality and its Elizabeth line and Jubilee line connections. The yield data below confirms that the extra outlay buys connectivity and newness rather than income.

House Price Growth in Newham
E20 posted the strongest five-year growth in Newham at 34.7%, while E16 recorded the weakest at -12.1%, a 47-point spread across a single borough. Only four of the eight postcodes delivered positive five-year returns, and the recent picture is softer still, with six of the eight negative over the past year. The table below ranks each postcode by its five-year figure.
| Area | 1 Year | 3 Years | 5 Years |
|---|---|---|---|
| E20 (Olympic Park, Stratford City) | -5.7% | 5.0% | 34.7% |
| E7 (Forest Gate) | 8.2% | 8.1% | 18.9% |
| E6 (East Ham, Beckton) | 2.6% | 3.9% | 13.5% |
| E12 (Manor Park) | -1.6% | 6.6% | 12.1% |
| IG11 (Barking) | -5.8% | -1.9% | 0.7% |
| E13 (Plaistow) | -0.7% | -7.2% | -2.2% |
| E15 (Stratford) | -3.0% | -1.2% | -2.7% |
| E16 (Canning Town, Royal Docks) | -6.7% | -5.1% | -12.1% |
E20 at 34.7% over five years leads the borough, though it has slipped 5.7% over the past year. The Olympic Park stock re-rated hard as East Village matured and the East Bank cultural quarter took shape, and the recent dip reflects the wider easing from the 2024 high rather than a change in the area's trajectory.
E7 at 18.9% over five years is one of only two postcodes positive across all three timeframes, up 8.2% over the year and 8.1% over three years, and the stronger of the pair alongside E6. Forest Gate has drawn buyers priced out of the boroughs to the west, and its Elizabeth line station has made it one of the more resilient parts of Newham.
E16 at -12.1% over five years is the weakest reading, down across all three timeframes. Canning Town and the Royal Docks have absorbed the largest volume of new-build flats in the borough, and that steady stream of supply has held prices back even as the area regenerates.
Monthly Property Sales in Newham
Transaction volumes range from 3 sales a month in E20 to 32 in E16, with turnover rates from 4% up to 13%. The busiest markets by volume sit in the dense flat postcodes of Canning Town and East Ham, while the newest, most expensive corner at the Olympic Park barely trades. Turnover, the share of stock changing hands each year, tells a slightly different story from raw volume.
| Area | Sales Per Month | Turnover | Asking Price |
|---|---|---|---|
| E16 (Canning Town, Royal Docks) | 32 | 4% | £436,794 |
| E6 (East Ham, Beckton) | 29 | 12% | £408,193 |
| IG11 (Barking) | 21 | 6% | £309,058 |
| E15 (Stratford) | 19 | 5% | £432,654 |
| E7 (Forest Gate) | 19 | 13% | £484,652 |
| E13 (Plaistow) | 14 | 7% | £395,305 |
| E12 (Manor Park) | 8 | 8% | £444,999 |
| E20 (Olympic Park, Stratford City) | 3 | 7% | £591,224 |
E7 at 13% turnover is the highest in the borough, closely followed by E6 at 12%. Forest Gate combines steady buyer demand with a deep pool of terraced family stock, so a larger share of its homes change hands each year. For a landlord, higher turnover means an easier exit when the time comes to sell.
E16 records the most transactions at 32 a month but the lowest turnover at 4%, because Canning Town and the Royal Docks hold a very large stock of flats. A high absolute number of sales is a small slice of a huge market. E15 and E16, the two Royal Docks and Stratford flat postcodes, sit at the bottom on turnover, where new-build apartments take longer to clear.
How Long Properties Take to Sell in Newham
Every Newham postcode currently reads as a buyer's or balanced market, with months of unsold stock running from 7.1 in E7 (Forest Gate) up to 33.3 in E16 (Canning Town, Royal Docks). Months of unsold stock measures how much for-sale supply is sitting there at the current rate of sales, so a higher figure means a slower, more crowded market to sell into. The number climbs sharply as you move from the terraced house postcodes into the new-build flat districts.
| Area | Months of Unsold Stock | Sales Per Month | Market |
|---|---|---|---|
| E7 (Forest Gate) | 7.1 | 20 | Balanced market |
| E6 (East Ham, Beckton) | 8.3 | 29 | Balanced market |
| E12 (Manor Park) | 12.5 | 9 | Buyer's market |
| E13 (Plaistow) | 12.5 | 16 | Buyer's market |
| E20 (Olympic Park, Stratford City) | 12.5 | 3 | Buyer's market |
| IG11 (Barking) | 16.7 | 21 | Buyer's market |
| E15 (Stratford) | 20.0 | 19 | Buyer's market |
| E16 (Canning Town, Royal Docks) | 33.3 | 32 | Buyer's market |
How fast you can get back out is the figure a headline yield never shows, and in Newham it splits along house-versus-flat lines. E7 and E6, the terraced postcodes of Forest Gate and East Ham, clear in 7 to 8 months of stock, close to a balanced market. E16 at 33.3 months is the opposite, a Royal Docks flat market carrying years of unsold supply at the current sales rate. For a buy-to-let buyer, the terraced postcodes offer not just steadier prices but a far quicker exit than the new-build flat districts.
What Type of Property Can You Buy in Newham?
Flats are the largest single category in six of Newham's eight postcodes, from 39.9% of stock in E7 up to 94.9% in E20, while terraced houses dominate the older residential postcodes. The housing mix shapes which strategy fits where, splitting the borough between the new-build flat core and the Victorian terraced fringes. The figures below are drawn from 2021 Census records for each postcode.
| Area | Detached | Semi-detached | Terraced | Flats |
|---|---|---|---|---|
| E6 (East Ham, Beckton) | 5.6% | 13.2% | 28.6% | 52.5% |
| E7 (Forest Gate) | 7.1% | 13.0% | 39.9% | 39.9% |
| E12 (Manor Park) | 7.0% | 16.6% | 39.9% | 36.3% |
| E13 (Plaistow) | 6.6% | 12.6% | 39.0% | 41.7% |
| E15 (Stratford) | 3.1% | 8.6% | 21.2% | 65.7% |
| E16 (Canning Town, Royal Docks) | 4.8% | 12.3% | 23.7% | 59.1% |
| E20 (Olympic Park, Stratford City) | 0.7% | 1.0% | 3.3% | 94.9% |
| IG11 (Barking) | 4.5% | 16.7% | 36.5% | 42.0% |
E20 is almost entirely flats at 94.9%, with houses making up barely 5% of its stock. The Olympic Park was built as a high-density apartment district, so a buy-to-let purchase there means a flat, aimed at professional renters using the Elizabeth line and Jubilee line. The near-total absence of houses is what marks E20 out from the rest of the borough.
E7 and E12, Forest Gate and Manor Park, hold the largest terraced shares at 39.9% each. Those Victorian and Edwardian terraces are the stock that suits family lets and shared houses, and they line up with the two postcodes' stronger medium-term growth. The older residential north of the borough is where houses, rather than flats, drive the rental market.
The flats figure covers both purpose-built blocks and conversions, and a small share of non-standard dwellings is left out, so rows may not add up to exactly 100%.

Newham Rental Market Analysis
Monthly rents in Newham range from £1,748 in IG11 to £3,024 in E20, with gross rental yields from 5.1% to 6.8% across all eight postcodes. For investors asking is buy to let worth it in Newham, the sections below break down rents, yields, and tenant affordability postcode by postcode. If you are looking at how to build a property portfolio in East London, Newham's combination of fast population growth and deep rental demand offers volume that the pricier boroughs to the west cannot match. Browse current buy-to-let homes for sale across the region.
Average Rent & Gross Rental Yields in Newham
Gross rental yields in Newham range from 5.1% in E7 to 6.8% in IG11. The cheapest postcode delivers the highest yield and one of the most expensive delivers the lowest. E20 charges the highest monthly rent at £3,024 but returns 6.1% because its £591,224 asking price is 91.3% higher than IG11's.
| Area | Average Monthly Rent | Asking Price | Gross Yield |
|---|---|---|---|
| IG11 (Barking) | £1,748 | £309,058 | 6.8% |
| E15 (Stratford) | £2,279 | £432,654 | 6.3% |
| E6 (East Ham, Beckton) | £2,117 | £408,193 | 6.2% |
| E16 (Canning Town, Royal Docks) | £2,240 | £436,794 | 6.2% |
| E13 (Plaistow) | £2,002 | £395,305 | 6.1% |
| E20 (Olympic Park, Stratford City) | £3,024 | £591,224 | 6.1% |
| E12 (Manor Park) | £2,028 | £443,999 | 5.5% |
| E7 (Forest Gate) | £2,070 | £484,652 | 5.1% |
IG11 at 6.8% pairs the lowest asking price with the lowest rent, £1,748 a month, yet still delivers the best yield in the borough. A 30% deposit of £92,717 gets an investor into the highest-yielding postcode, over in Barking rather than in Newham proper.
E7 at 5.1% sits at the bottom of the yield table. Forest Gate's £2,070 monthly rent is mid-table, but its £484,652 asking price, the second-highest in the borough, pulls the income return down. In E7 the price reflects the area's growth record and Elizabeth line connectivity rather than its rental income.
Gross Rental Yield by Postcode
Is Newham Rent High?
Monthly rents in Newham consume between 49.2% and 85.2% of the local median gross monthly salary, so every postcode sits well above the affordability line. The widely cited threshold for rent affordability is 30% of gross income. No Newham postcode comes close to it on the local median wage, which is the clearest sign that borough rents are set by London-wide demand rather than by what Newham residents earn.
The median gross weekly salary in Newham is £819.10, which equates to £3,550 per month or £42,595 per year. This is below the London median of £892.60 per week but above the Great Britain median of £752.40 per week. Data from the Nomis Labour Market Profile (ASHE 2025).
| Rank | Area | Rent as % of Income |
|---|---|---|
| 1 | E20 (Olympic Park, Stratford City) | 85.2% |
| 2 | E15 (Stratford) | 64.2% |
| 3 | E16 (Canning Town, Royal Docks) | 63.1% |
| 4 | E6 (East Ham, Beckton) | 59.6% |
| 5 | E7 (Forest Gate) | 58.3% |
| 6 | E12 (Manor Park) | 57.1% |
| 7 | E13 (Plaistow) | 56.4% |
| 8 | IG11 (Barking) | 49.2% |
IG11 at 49.2% is the most affordable for tenants, and it is still well above the 30% mark. A £1,748 monthly rent against a £3,550 local monthly salary shows how far Newham rents outrun local pay. In practice, tenants across the borough share, commute in on higher outside wages, or spend a large slice of income on housing, which is why household sharing and turnover run high.
E20 at 85.2% is the least affordable by a wide margin. The £3,024 rent at the Olympic Park reflects new-build apartments let to professional households and sharers earning well above the Newham median, typically people working in the City or Canary Wharf rather than locally. The single-earner median wage does not describe the E20 tenant.
How Big Is Newham's Private Rented Sector?
The private rented sector runs from 25.3% of households in IG11 up to 53.7% in E20, so in the newest postcode more than half of all homes are already let privately. The share of homes already rented privately is a guide to the size of the established tenant pool, and in Newham it is one of the deepest of any London borough. The table below shows household tenure by postcode.
| Area | Owned Outright | Owned with Mortgage | Private Rented | Social Rented |
|---|---|---|---|---|
| E20 (Olympic Park, Stratford City) | 5.3% | 25.0% | 53.7% | 12.8% |
| E15 (Stratford) | 9.9% | 18.6% | 44.5% | 24.1% |
| E16 (Canning Town, Royal Docks) | 7.3% | 17.0% | 38.8% | 34.4% |
| E7 (Forest Gate) | 20.0% | 19.9% | 38.3% | 20.5% |
| E12 (Manor Park) | 21.5% | 19.3% | 36.4% | 21.6% |
| E13 (Plaistow) | 13.7% | 18.7% | 34.1% | 31.5% |
| E6 (East Ham, Beckton) | 10.6% | 22.3% | 34.0% | 31.3% |
| IG11 (Barking) | 12.4% | 30.1% | 25.3% | 30.4% |
E20 has the largest private rented sector in the borough at 53.7%, with owner-occupation almost non-existent at just 5.3% owned outright. The Olympic Park was built and sold largely to landlords and investors, so it operates as a rental district first and foremost, which is exactly why its yields hold up despite the highest prices. E15 in neighbouring Stratford is similar at 44.5% privately rented.
IG11 has the smallest private rented sector at 25.3%, balanced by the highest mortgaged ownership at 30.1% and a large social-rented share of 30.4%. Barking is more of an owner-occupier and social-housing market than the Newham flat postcodes, though a quarter of its homes still let privately, a deep enough pool for a borough this size.
Across the E-postcodes rental listings are plentiful, and the market currently favours landlords: E7, E12, E13 and E16 all read as a landlord's market on current supply, with homes letting in around 35 to 40 days. Only IG11 in Barking reads as balanced, taking closer to 94 days to let, so rental demand is markedly stronger in Newham proper than over the eastern border.
Local Housing Allowance Rates in Newham
Newham straddles two Broad Rental Market Areas: the seven E-postcodes fall in Outer East London, where Local Housing Allowance runs to £448.77 a week for a four-bedroom home, while IG11 in Barking sits in Outer North East London on slightly lower rates. Local Housing Allowance sets the maximum housing support a tenant on benefits can receive, so it acts as a rent floor for landlords letting to that part of the market. The rates below apply from June 2026, and because the borough spans two market areas the figures differ between the E-postcodes and Barking. To check the current rate for a specific address, you can use the government's official Local Housing Allowance calculator.
| Property Size | Outer East London (E6-E20) | Outer North East London (IG11) |
|---|---|---|
| Shared accommodation | £129.18 | £126.54 |
| 1 bedroom | £276.16 | £230.14 |
| 2 bedrooms | £322.19 | £287.67 |
| 3 bedrooms | £385.48 | £345.21 |
| 4 bedrooms | £448.77 | £414.25 |
The two-bedroom rate is £322.19 a week, about £1,396 a month, across the seven Outer East London postcodes, and £287.67 a week, about £1,246 a month, in IG11. Both sit below the £1,748 to £3,024 open-market rents recorded across the borough, so a benefit-backed tenancy at the LHA rate comes in under Newham's market rents. The stock that fits within those rates concentrates in the cheaper older terraces of IG11 and the East Ham end of E6.
Buy-to-Let Considerations
Are House Prices High in Newham? Price-to-Earnings Ratios
Purchasing a property in Newham requires between 7.3 and 13.9 times the median annual salary. This is based on the Nomis Labour Market Profile for Newham showing the median gross annual income for Newham residents is £42,595.
The national benchmark for price-to-earnings is 7.4x (England's average sold price of £289,946 divided by the Great Britain median annual salary of £39,125). One of Newham's eight postcodes (IG11) sits just below that national benchmark, meaning it is marginally more affordable relative to local incomes than the England average is relative to national incomes.
| Rank | Area | Price-to-Earnings Ratio |
|---|---|---|
| 1 | IG11 (Barking) | 7.3x |
| 2 | E13 (Plaistow) | 9.3x |
| 3 | E6 (East Ham, Beckton) | 9.6x |
| 4 | E15 (Stratford) | 10.2x |
| 5 | E16 (Canning Town, Royal Docks) | 10.3x |
| 6 | E12 (Manor Park) | 10.4x |
| 7 | E7 (Forest Gate) | 11.4x |
| 8 | E20 (Olympic Park, Stratford City) | 13.9x |
IG11 at 7.3x is the only Newham postcode below the national benchmark of 7.4x, and the most affordable entry point in the borough relative to local earnings. Barking's older stock keeps the ratio down, which is the same feature driving its higher yield and lower deposit.
E20 at 13.9x sits well above the national benchmark. At nearly fourteen times the local median salary, the Olympic Park is priced for buyers earning far more than the Newham median, or for investors treating it as a rental asset rather than an owner-occupier home. The elevated ratio is what compresses the E20 yield despite its high rents.
Deposit Requirements in Newham
A 30% deposit on a buy-to-let property in Newham ranges from £92,717 in IG11 to £177,367 in E20. The gap between the cheapest and most expensive deposit is £84,650, close to the cost of a whole second deposit in IG11. For investors comparing Newham with other East London locations, these deposits sit below Redbridge and Tower Hamlets but above the outer boroughs further from the City.
Beyond the deposit, the stamp duty calculation and other ongoing rental costs affect the total capital required.
| Rank | Area | 30% Deposit Required |
|---|---|---|
| 1 | IG11 (Barking) | £92,717 |
| 2 | E13 (Plaistow) | £118,592 |
| 3 | E6 (East Ham, Beckton) | £122,458 |
| 4 | E15 (Stratford) | £129,796 |
| 5 | E16 (Canning Town, Royal Docks) | £131,038 |
| 6 | E12 (Manor Park) | £133,200 |
| 7 | E7 (Forest Gate) | £145,396 |
| 8 | E20 (Olympic Park, Stratford City) | £177,367 |
IG11 is the cheapest way into the borough at a £92,717 deposit, for the highest yield at 6.8%. Stepping up to E13 in Plaistow costs about £25,875 more and moves the money into Newham proper, closer to the Elizabeth line and the Stratford jobs market, though on a lower 6.1% yield. IG11 keeps the entry cost down; the E-postcodes trade that for connectivity and rental depth.
At the top, E7 and E20 are the two most expensive deposits, £145,396 and £177,367, but they earn their keep differently. E7 in Forest Gate has the borough's most consistent growth record, up across one, three and five years, on a 5.1% yield. E20 at the Olympic Park has the highest rent and the deepest rental sector but the lowest affordability and a softening one-year figure. The extra outlay comes with prices up across all three windows in E7, and the deepest rental sector but the lowest affordability in E20.

What the Newham Data Tells Buy-to-Let Investors
In Newham the cheapest way in is also the highest-yielding postcode, and it sits just over the border in Barking. IG11 has the top yield at 6.8%, the lowest asking price for buying an investment property at £309,058, and the only price-to-earnings ratio in the borough below the national benchmark at 7.3x. A 30% deposit there is £92,717, the lowest in the guide, for a home renting at £1,748 a month.
Within Newham proper, the yield band is tight, running from 6.3% in E15 down to 5.1% in E7, so the choice comes down to growth record and property type rather than headline income. E7 in Forest Gate and E6 in East Ham are the two postcodes that grew across every timeframe, with E7 the stronger at 8.2% over a year, 8.1% over three and 18.9% over five, though E7 also carries the lowest yield at 5.1% and the second-highest deposit. E20 at the Olympic Park has the strongest five-year growth at 34.7% and the deepest rental sector, but the highest deposit and the tightest affordability.
The stand-out feature of the current data is the two years since the March 2024 high. The borough average has fallen 13.7%, the five-year return is now negative at -7.0%, and six of the eight postcodes are down over the past year. That is a buyer's market on most postcodes, and buyers who want to come in below asking often work the off-market property in Newham and below-market-value channels before a home reaches the portals.
Newham operates a borough-wide selective licensing scheme across most of its private rented stock, so a licence is needed to let out most properties, and an HMO licence applies to shared houses. The requirement and the exempt wards are set out on the council's property licensing pages. With fast population growth, a deep rental sector and rents set by London demand rather than local wages, Newham reads as a high-yield, high-turnover East London market, currently priced below where it stood two years ago.
How Newham Compares
Newham's mean asking price of £437,735 is the second-lowest of five East London locations compared here, yet its top yield of 6.8% is the highest of the group. The comparison below places Newham alongside four nearby boroughs, each with a different investor profile. The mean asking price and mean monthly rent are simple averages across all postcodes with data. Top gross yield is the single highest postcode yield in each location.
| Location | Mean Asking Price | Mean Monthly Rent | Mean Gross Yield | Top Yield (postcode) |
|---|---|---|---|---|
| Bexley | £428,037 | £1,762 | 4.9% | 6.3% (SE28) |
| Newham | £437,735 | £2,189 | 6.0% | 6.8% (IG11) |
| Greenwich | £464,537 | £2,045 | 5.3% | 6.3% (SE28) |
| Waltham Forest | £518,892 | £1,997 | 4.6% | 6.3% (E15) |
| Tower Hamlets | £520,706 | £2,473 | 5.7% | 6.5% (E3) |
Newham is the second-cheapest location in this comparison at £437,735 mean asking price, behind only Bexley, yet its top yield of 6.8% leads the group. That combination of a low asking price and the highest yield is what marks it out among its neighbours. Greenwich and Waltham Forest both top out at 6.3% on higher prices.
For investors prioritising income, Tower Hamlets pairs the highest mean rent in the table at £2,473 with a 6.5% top yield, but at a mean asking price nearly £83,000 above Newham's. Newham offers a lower asking price with a comparable rent, which is what drives its yield to the top of the group. For a data-driven comparison across all UK locations, see our best places to invest in buy-to-let guide.
Frequently Asked Questions
Is Newham a good place to live for buy-to-let tenants?
It works for tenants who want London access at a lower rent, but the numbers are tight. The local employment rate is 66.2%, below the national 75.6%, and the median wage of £819.10 a week runs under the London figure, so many tenants earn most of their income outside the borough. Rents take at least half of the local median salary in every postcode, which is why household sharing and turnover run high.
What makes it easy to rent in is connectivity. The Elizabeth line, Jubilee line, DLR and national rail out of Stratford put the City and Canary Wharf within a short commute, so the tenant pool reaches across the whole East London jobs market rather than just Newham itself.
What are the best areas in Newham for property investment?
The borough splits along income-versus-growth lines. The cheapest way in is IG11 in Barking, at £309,058, and it carries the highest yield at 6.8%, so it leans towards income, though it sits just over the eastern border. E15 in Stratford follows on yield at 6.3% and puts you next to the Olympic Park and Westfield.
For growth, E7 in Forest Gate and E6 in East Ham are the two postcodes positive across one, three and five years, with E7 the stronger at 8.2%, 8.1% and 18.9% and helped by its Elizabeth line station, while E20 at the Olympic Park has the strongest five-year figure at 34.7%. So if income matters most, IG11 leads on yield and price; if a consistent growth record matters more, E7 has delivered the highest figures across every timeframe.
How does Newham compare to Tower Hamlets for buy-to-let?
They sit at different price points for a similar rent. Tower Hamlets has a higher mean asking price of £520,706 against Newham's £437,735, and a higher mean rent of £2,473 against £2,189, but its top yield of 6.5% comes in below Newham's 6.8%. Newham's lower asking price is what pushes its yield ahead.
Tower Hamlets brings you closer to Canary Wharf and the City fringe, with a denser new-build market. Newham trades a little of that central position for a lower price and a marginally higher top yield. Which wins comes down to whether you are buying for the location or for the income.
Is there demand for student accommodation in Newham?
Yes, mostly around Stratford and the Royal Docks. The University of East London runs campuses at Stratford and at the Royal Albert Dock in E16, and the borough's lower rents relative to central London make shared student lets workable, particularly in the older terraced stock of E7 and E12. Student lets come with summer voids and more hands-on management than a standard tenancy, so factor that in. For the purpose-built end of the market, see our guide to student property investment.
On the HMO side, a sample of current room adverts puts a double with a shared bathroom at around £202 a week in E15 (Stratford) and £216 in E16 (Canning Town), with ensuite doubles in E16 nearer £289. Those were the room types with enough live adverts to read reliably. For how the numbers work on a shared house, see our HMO investment guide.
Do I need a licence to rent out a property in Newham?
In most cases, yes. Newham runs a borough-wide selective licensing scheme covering most private rented homes, so a licence is needed to let out the majority of properties. Shared houses need an HMO licence on top, and converting a house into a house in multiple occupation can also require planning permission. It is worth confirming the current rules with Newham Council before you buy, because the licensing position affects your costs and your letting strategy. For the wider picture on how these schemes work, see our guide to selective licensing schemes.
Can I find buy-to-let property under £350,000 in Newham?
On average, only over in Barking. That postcode, IG11, has a mean asking price of £309,058, the one below £350,000, so it is the natural place to look for a cheaper buy. Within Newham proper the cheapest postcode is E13 in Plaistow at £395,305, above that line on average. The way in below £350,000 elsewhere is by property type rather than postcode: older terraces and smaller flats in E6, E12 and E13 sit under their postcode averages. If a sub-£350,000 budget is the target, IG11 or the cheaper stock in East Ham and Plaistow is where to look, or explore below market value properties.
What type of property is most common in Newham?
Flats, in most of the borough. They are the largest single category in six of the eight postcodes, from 39.9% of stock in E7 (Forest Gate) up to 94.9% in E20 (Olympic Park), where houses barely exist. The exceptions are the older residential postcodes north of the borough: E7 and E12 (Manor Park) hold the largest terraced shares at 39.9% each, the Victorian and Edwardian stock that suits family lets and shared houses. So the split is roughly new-build flats in Stratford, Canning Town and the Royal Docks, and terraces across East Ham, Forest Gate and Manor Park.
What are average house prices in Newham?
The borough-wide average sold price is £384,258 on the Land Registry index, about 32.5% above the England average of £289,946 as of March 2026, and down 13.7% from the borough's March 2024 high of £445,489. Asking prices by postcode run from £309,058 in IG11 (Barking) up to £591,224 in E20 (Olympic Park), with a borough-wide mean of £437,735. By type, detached homes average £710,799, semi-detached £492,637, terraced £450,437 and flats £320,871.
Through a buy-to-let lens, IG11 is the cheapest entry and the highest-yielding at 6.8%, while E7 in Forest Gate is the dearest of the E-postcodes and the lowest-yielding at 5.1%.
How do I buy an investment property in Newham?
Start by deciding whether you are buying for income or for a growth record, because that points you at a different postcode. IG11 (Barking) is the cheapest entry at £309,058 and the highest-yielding at 6.8%. E7 (Forest Gate) pairs a 5.1% yield with the most consistent growth, up across one, three and five years. Budget for a 30% deposit, which runs from £92,717 in IG11 to £177,367 in E20.
Beyond what is listed openly, plenty of experienced investors buy below asking through off market property in a buyer's market like Newham's. To see what is available now, browse investment properties in Newham or buy-to-let homes for sale.
Ready to buy property?
Access off-market investment properties with an average 8%+ annual gross yield (beating the UK's typical 3-5%).
Get property alerts