Stoke-on-Trent is a city in Staffordshire, in the West Midlands. Average sold prices in Stoke-on-Trent sit at £150,990 on the HM Land Registry House Price Index, 47.9% below the England average of £289,946 and 35.2% below the West Midlands regional average of £232,897. That makes the city one of the cheapest places to buy in England, and the low price is what pushes gross yields above 5% across most of its inner postcodes. The local authority of Stoke-on-Trent recorded population growth of 3.8% between the 2011 and 2021 censuses, from 249,008 to 258,366 residents.
Stoke is six towns rather than one city: Hanley, Stoke, Burslem, Tunstall, Longton, and Fenton, all federated into a single authority in 1910. For an investor, the practical effect is a market that splits cleanly in two. The inner pottery towns carry low prices and the rental demand, with ST1 (Hanley) entering at £131,395 and returning a 6.9% gross yield. The rural-fringe postcodes towards the Staffordshire Moorlands run three to four times that price and carry little rental activity at all.
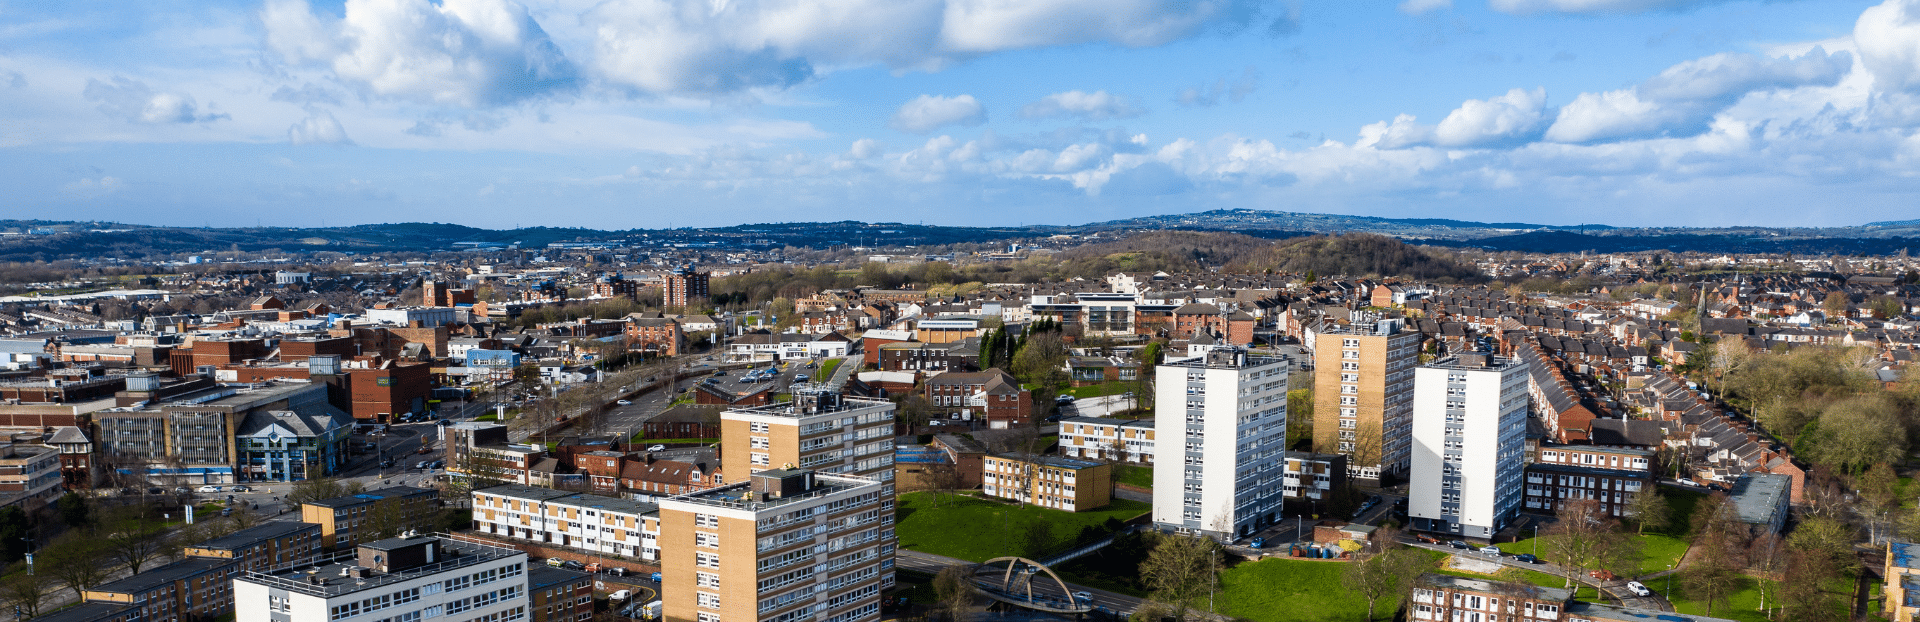
This guide covers the unitary authority of Stoke-on-Trent (ONS code E06000021) across ten postcodes: ST1, ST2, ST3, ST4, ST5, ST6, ST7, ST9, ST11, and ST12. Stoke sits in north Staffordshire on the West Coast Main Line, 45 minutes from Manchester and around 90 minutes from London. Investors comparing options in the region may also weigh up Wolverhampton and Derby. Browse all our Midlands location guides.
Article updated: July 2026

Why Invest in Stoke-on-Trent?
Stoke-on-Trent's population grew 3.8% between the 2011 and 2021 censuses, from 249,008 to 258,366 residents. That is slower than the England and Wales average of 6.3%, but the more useful number for a landlord is the makeup of that population rather than its growth rate. Two universities and a major teaching hospital anchor the tenant base, and the city sits on the West Coast Main Line with direct trains to Manchester in around 45 minutes and London in about 90.
Staffordshire University and Keele University between them bring roughly 20,000 students to the area. Keele sits just outside the city boundary, but its students rent across Stoke's postcodes, particularly ST4 and ST5. The Royal Stoke University Hospital is the city's largest single employer and a regional teaching hospital, which feeds steady demand for rented homes within reach of the site in ST4. Alongside healthcare and higher education, the economy now leans on distribution and logistics and advanced manufacturing, a long way from the pottery industry that built the towns.
Median gross annual earnings in Stoke-on-Trent are £32,622, which is below both the West Midlands median of £37,050 and the Great Britain median of £39,125. Lower wages would be a problem in a high-priced market, but here they sit next to some of the cheapest house prices in England. The result is the gap that defines Stoke for investors: rents are modest in cash terms, yet they hold up against purchase prices well enough to clear 5% in most of the inner postcodes.
Stoke-on-Trent Economic Summary
- Population: 258,366 (2021 Census). Growth of 3.8% from 2011.
- Median annual salary: £32,622 (Stoke-on-Trent), £37,050 (West Midlands), £39,125 (Great Britain)
- Employment rate: 72.7% (Stoke-on-Trent), 74.2% (West Midlands), 75.6% (Great Britain)
- Unemployment rate: 4.5% (local)
- Key employment sectors: Healthcare, distribution and logistics, advanced manufacturing, ceramics, higher education
Source: ONS Census 2021, Nomis Labour Market Profile (ASHE 2025, Employment Oct 2024-Sep 2025)
Regeneration and Investment in Stoke-on-Trent
Stoke-on-Trent has drawn down significant government funding for city centre regeneration, with three confirmed schemes now reshaping Hanley and the area around Stoke station. For an investor, the projects below matter less as headline numbers than as a signal of where new homes, workspace, and footfall are being concentrated.
- Goods Yard (Complete, £60 million including £16m Levelling Up Fund): Capital&Centric converted a derelict Victorian goods warehouse beside Stoke station into 174 rental apartments, 30,000 sq ft of workspace, and independent food and drink venues, with residents now moving in. The Sunday Times called it the biggest symbol of a Potteries renaissance. A completed build-to-rent scheme of this scale also sets a local reference point for new-build rents near the station. Updates at Capital&Centric.
- Etruscan Square (Preferred developer selected, £20 million government funding): A seven-acre cleared site in Hanley, on the former bus station and East-West Precinct land next to the city's main retail core, described by the council as one of the Midlands' largest city centre regeneration sites. Genr8 Kajima Regeneration was named preferred bidder in February 2025 to deliver mixed-tenure homes, leisure, and commercial space, with site investigations through 2025, preparation in 2026, and home-building targeted from 2027. Updates at Stoke-on-Trent City Council.
- 5,000 Homes Programme (Plans submitted): The council has put forward plans for nearly 5,000 new homes across 23 sites, with around 37% designated as affordable housing, almost 1,800 units. The programme responds to a housing register that has grown to over 3,138 households, a 41% rise in applicants in a single year, against a 13% fall in council stock over the past decade. Updates at Stoke-on-Trent City Council.

Source: Office for National Statistics - Population for Stoke-on-Trent
Stoke-on-Trent Property Market Analysis
Average property prices in Stoke-on-Trent have risen 405.4% since January 1995, from £29,876 to £150,990. The sections below walk through that journey cycle by cycle, then drill into current postcode-level data for sold prices, price per square foot, asking prices, growth trends, monthly sales, and selling times.
When was the last house price crash in Stoke-on-Trent?
Stoke-on-Trent is a unitary authority, so all sold property prices from HM Land Registry are recorded at this level. The Land Registry House Price Index tracks average prices from January 1995 to March 2026, covering 31 years of market cycles. The headline for any investor weighing downside is that Stoke crashed harder than the national average in 2008 and took longer than almost anywhere to recover.
The 1995 to 2007 boom: Stoke started at £29,876 in January 1995 and barely moved for five years, reaching only £34,431 by January 2000 while southern England raced ahead. Then it caught up fast. Cheap credit tripled prices through the early 2000s, with annual change topping 29% in the 2003 to 2005 window. The market peaked at £105,100 in October 2007, well beyond what local wages could support.
2008 to 2011, the crash and extended decline: From the £105,100 peak, prices fell to a trough of £81,517 in March 2011, a decline of 22.4% over more than three years. The worst year-on-year reading was -17.0% in March 2009. Stoke's fall was deeper than both the West Midlands and England, where the national drop ran to around 18%. The city's reliance on manufacturing and ceramics, both hit hard in the recession, stretched the decline into 2011 while much of England had already turned the corner in 2009.
2011 to 2013, stagnation: Prices bounced off the trough but went nowhere. By December 2013 the average sat at £87,345, still below the 2005 level. Stoke spent two years drifting in a narrow band, unable to build momentum.
2014 to 2018, the long recovery: Growth turned consistently positive from late 2013. Prices climbed from £87,538 in January 2014 to finally pass the pre-crash peak in August 2018 at £105,987. That recovery took close to eleven years from the October 2007 high, among the longest of any English city.
2019 to 2022, the pandemic surge: The stamp duty holiday and the shift to remote working pushed prices from £111,348 in January 2020 to £129,358 by January 2022, with affordability drawing in buyers priced out elsewhere.
2023, the rate shock: Higher mortgage rates cooled the market, easing prices back through 2023. The dip was brief and mild set against the 2008 crash.
2024 to present: Prices recovered to an all-time high of £152,725 in October 2025, then eased gently to £150,990 by the latest reading in March 2026. The current average is 43.7% above the pre-crash peak of £105,100.
Long-term growth summary:
- 5 years (March 2021 to March 2026): 25.3% growth (£120,505 to £150,990)
- 10 years (March 2016 to March 2026): 61.8% growth (£93,320 to £150,990)
- 15 years (March 2011 to March 2026): 85.2% growth (£81,517 to £150,990)
- 20 years (March 2006 to March 2026): 73.2% growth (£87,153 to £150,990)
- 30 years (January 1995 to March 2026): 405.4% growth (£29,876 to £150,990)
The 15-year figure beating the 20-year one is the tell. It shows how long Stoke spent recovering from the crash: someone who bought in 2006 has seen a smaller return than someone who bought at the 2011 trough, because the 2006 buyer had to climb back out of the 2008 hole first. The real gains came in the last decade, and an investor who happened to buy at the exact peak in October 2007 has waited a long time but is now 43.7% ahead on the Land Registry average. Stoke's £150,990 still sits at barely over half the England average, which is the reason its yields hold up.
- All property types
- Detached
- Semi-detached
- Terraced
- Flats
- All property types
- Detached
- Semi-detached
- Terraced
- Flats
Sold House Prices in Stoke-on-Trent
The average sold price across all property types in Stoke-on-Trent is £150,990, which is 47.9% below the England average of £289,946 as of March 2026. That discount runs across every property type, but it is widest at the cheaper end. Flats sit 56.9% below the England figure, while semi-detached houses are 43.6% below. The pattern reflects Stoke's housing mix: a deep stock of terraces and semis built for pottery workers, and a flat market that prices on local demand alone without the institutional premium that lifts apartment values in bigger cities.
| Property Type | Stoke-on-Trent Average | England Average | Difference |
|---|---|---|---|
| Detached houses | £236,884 | £470,492 | -49.7% |
| Semi-detached houses | £162,525 | £288,185 | -43.6% |
| Terraced houses | £128,210 | £243,788 | -47.4% |
| Flats and maisonettes | £92,561 | £214,563 | -56.9% |
| All property types | £150,990 | £289,946 | -47.9% |
Flats and maisonettes at £92,561 carry the deepest discount at 56.9% below England's £214,563. At that price a Stoke flat costs less than 43% of the England average for the same type. The stock is mostly converted Victorian terraces and purpose-built blocks near the Hanley and Stoke centres, which is where the cheapest entry points and the highest paper yields sit.
Terraced houses at £128,210 are 47.4% below England's £243,788. Terraces are the workhorse of Stoke's housing, thousands of them built for the pottery trade in the 19th century, and they define the inner postcodes. For a buy-to-let purchase, terraces in ST1, ST3, and ST6 pair a low purchase price with established rental demand.
Semi-detached houses at £162,525 show the narrowest gap at 43.6% below England. This is family stock, and the demand for it in ST3, ST5, and ST7 holds the discount tighter than the rest of the market.
Detached houses at £236,884 are 49.7% below England's £470,492. Stoke's detached market is concentrated in the outer postcodes, ST9, ST11, and ST12, where larger plots on the Staffordshire Moorlands fringe push asking prices up and rental activity down.

Price Per Square Foot in Stoke-on-Trent
Sold prices per square foot in Stoke-on-Trent run from £145 in ST1 (Hanley) to £279 in ST12 (Barlaston), a near-double spread within one authority. Price per square foot strips out the effect of property size and gives a cleaner read on location value. The four cheapest postcodes are all inner-city, and all four carry rental demand.
| Rank | Area | Price Per Sq Ft |
|---|---|---|
| 1 | ST1 (Hanley) | £145 |
| 2 | ST6 (Tunstall, Burslem) | £158 |
| 3 | ST4 (Stoke, Fenton, Trentham) | £174 |
| 4 | ST2 (Bentilee, Bucknall) | £189 |
| 5 | ST5 (Newcastle-under-Lyme) | £215 |
| 6 | ST3 (Longton, Meir) | £216 |
| 7 | ST7 (Kidsgrove, Alsager) | £242 |
| 8 | ST11 (Blythe Bridge) | £245 |
| 9 | ST9 (Endon, Werrington) | £263 |
| 10 | ST12 (Barlaston) | £279 |
ST1 at £145 per square foot is the cheapest bricks-and-mortar value in the city. That covers Hanley city centre, where terraces and conversions dominate. At the other end, ST12 (Barlaston) at £279 is paying almost double for a rural-fringe location that returns no rental yield data and averages just two sales a month. The pattern repeats through the table: the more you pay per square foot, the further you move from the rental market.
For Sale Asking Prices in Stoke-on-Trent
Asking prices in Stoke-on-Trent run from £131,395 in ST1 (Hanley) to £389,538 in ST12 (Barlaston), a spread of £258,143 across the ten postcodes. The mean asking price across all ten is £245,606. The table ranks every postcode from cheapest to dearest.
| Rank | Area | Asking Price |
|---|---|---|
| 1 | ST1 (Hanley) | £131,395 |
| 2 | ST6 (Tunstall, Burslem) | £158,640 |
| 3 | ST4 (Stoke, Fenton, Trentham) | £195,748 |
| 4 | ST2 (Bentilee, Bucknall) | £196,324 |
| 5 | ST3 (Longton, Meir) | £201,737 |
| 6 | ST5 (Newcastle-under-Lyme) | £233,382 |
| 7 | ST7 (Kidsgrove, Alsager) | £262,453 |
| 8 | ST11 (Blythe Bridge) | £323,136 |
| 9 | ST9 (Endon, Werrington) | £363,713 |
| 10 | ST12 (Barlaston) | £389,538 |
ST1 at £131,395 is the cheapest way into Stoke and the only postcode that comes in below £150,000. The step from ST1 to ST6 is around £27,000, and from there the table climbs steadily. For an investor working to a fixed budget, the bottom four postcodes (ST1, ST6, ST4, ST2) all sit under £200,000 and all four carry the inner-city housing stock that the rental market wants.
ST1 at £131,395 is less than a third of ST12 at £389,538. That range inside a single authority is wider than many investors expect. ST1 covers Hanley city centre, weighted towards terraces and conversions, while ST12 covers the village of Barlaston on the southern rural fringe, where detached houses on large plots set the price.

House Price Growth in Stoke-on-Trent
Five-year growth ranges from -2.1% in ST12 (Barlaston) to 32.8% in ST5 (Newcastle-under-Lyme). The table shows one-year, three-year, and five-year growth for all ten postcodes, ranked by five-year performance.
| Area | 1 Year | 3 Years | 5 Years |
|---|---|---|---|
| ST5 (Newcastle-under-Lyme) | -0.2% | 13.5% | 32.8% |
| ST3 (Longton, Meir) | 3.5% | 9.5% | 26.5% |
| ST6 (Tunstall, Burslem) | 3.4% | 7.6% | 22.6% |
| ST7 (Kidsgrove, Alsager) | 5.8% | 1.6% | 22.3% |
| ST1 (Hanley) | 4.6% | 7.6% | 19.5% |
| ST2 (Bentilee, Bucknall) | 0.5% | 5.6% | 17.9% |
| ST9 (Endon, Werrington) | 6.1% | 1.6% | 5.8% |
| ST11 (Blythe Bridge) | -7.0% | -4.5% | 3.2% |
| ST4 (Stoke, Fenton, Trentham) | -5.1% | 11.1% | 1.4% |
| ST12 (Barlaston) | -12.6% | -3.3% | -2.1% |
The four strongest five-year performers are all mid-priced postcodes with busy sales markets. ST5 (Newcastle-under-Lyme) leads at 32.8%, with ST3, ST6, and ST7 clustered between 22.3% and 26.5%. ST3 is the one to note: 26.5% over five years sits alongside a 5.1% yield and 51 sales a month, so growth and income are pulling in the same direction there.
The bottom of the table is the rural fringe. ST12 has fallen 12.6% over the past year and is down 2.1% over five, while ST11 dropped 7.0% in the year. These postcodes turn over two to five sales a month, so a single high or low sale moves the average sharply, and the figures are best read as thin rather than as a trend. ST4 is the odd one out: it grew 11.1% over three years but is down 5.1% in the past year and up only 1.4% over five, a softer recent run after an earlier rise.
Monthly Property Sales in Stoke-on-Trent
Monthly sales range from 2 in ST12 (Barlaston) to 68 in ST5 (Newcastle-under-Lyme). Turnover, which measures sales as a share of for-sale stock, adds a second read on how quickly a postcode's market moves. The table ranks every postcode by sales per month.
| Area | Sales Per Month | Turnover | Asking Price |
|---|---|---|---|
| ST5 (Newcastle-under-Lyme) | 68 | 17% | £233,382 |
| ST6 (Tunstall, Burslem) | 55 | 23% | £158,640 |
| ST4 (Stoke, Fenton, Trentham) | 52 | 18% | £195,748 |
| ST7 (Kidsgrove, Alsager) | 52 | 16% | £262,453 |
| ST3 (Longton, Meir) | 51 | 19% | £201,737 |
| ST1 (Hanley) | 27 | 27% | £131,395 |
| ST2 (Bentilee, Bucknall) | 23 | 24% | £196,324 |
| ST9 (Endon, Werrington) | 11 | 13% | £363,713 |
| ST11 (Blythe Bridge) | 5 | 6% | £323,136 |
| ST12 (Barlaston) | 2 | 5% | £389,538 |
ST1 (Hanley) shows the highest turnover at 27% on 27 sales a month, so although its volume is modest, the homes that come up sell at a faster clip than the rest of the city. For a landlord that points to a quicker exit when the time comes to sell. ST6 pairs strong volume with 23% turnover, the busiest of the higher-volume postcodes.
The outer postcodes tell the opposite story. ST12 (Barlaston) at two sales a month and 5% turnover, and ST11 at five sales and 6%, are slow markets where stock sits. That thin trading is the reason their growth figures swing so widely, and it is worth weighing against the higher asking prices the same postcodes carry.
How Long Properties Take to Sell in Stoke-on-Trent
Selling speed splits Stoke sharply: ST1 (Hanley) and ST2 (Bentilee, Bucknall) clear in about 117 days, while ST12 (Barlaston) sits unsold for roughly 608 days. Days on market is the typical time a home is up for sale before it sells, and the months of unsold stock shows how much for-sale supply is sitting there at the current rate of sales. It is the cost that disappears when postcodes are ranked on yield alone.
| Area | Avg Days to Sell | Months of Unsold Stock | Market |
|---|---|---|---|
| ST1 (Hanley) | 117 | 3.8 | Seller's market |
| ST2 (Bentilee, Bucknall) | 117 | 3.8 | Seller's market |
| ST6 (Tunstall, Burslem) | 127 | 4.2 | Seller's market |
| ST4 (Stoke, Fenton, Trentham) | 160 | 5.3 | Seller's market |
| ST3 (Longton, Meir) | 179 | 5.9 | Seller's market |
| ST5 (Newcastle-under-Lyme) | 179 | 5.9 | Seller's market |
| ST7 (Kidsgrove, Alsager) | 190 | 6.3 | Balanced market |
| ST9 (Endon, Werrington) | 234 | 7.7 | Balanced market |
| ST11 (Blythe Bridge) | 507 | 16.7 | Buyer's market |
| ST12 (Barlaston) | 608 | 20.0 | Buyer's market |
The inner towns are where homes move. ST1 and ST2 hold under four months of unsold stock, so a landlord buying there is in a postcode that sells when it needs to. That lines up with the same postcodes carrying the lowest prices and the highest yields, and it is the practical advantage that a yield figure on its own does not capture.
The rural fringe is the warning. ST12 at 20 months of unsold stock and ST11 at 16.7 are slow enough that a sale can take more than a year and a half to complete. A higher purchase price and a long wait to exit is a difficult combination for an income-focused investor, and it is the clearest reason the outer postcodes are owner-occupier rather than buy-to-let territory.
What Type of Property Can You Buy in Stoke-on-Trent?
The housing mix flips across the city: terraces and flats make up over half the stock in ST1 (Hanley), while detached homes account for nearly two-thirds in ST9 (Endon, Werrington). The blend of housing shapes which strategies fit each postcode. The figures below are drawn from 2021 Census records for each postcode.
| Area | Detached | Semi-detached | Terraced | Flats |
|---|---|---|---|---|
| ST1 (Hanley) | 10.1% | 32.4% | 40.0% | 17.4% |
| ST2 (Bentilee, Bucknall) | 18.7% | 54.7% | 16.2% | 10.3% |
| ST3 (Longton, Meir) | 29.0% | 48.7% | 14.1% | 8.2% |
| ST4 (Stoke, Fenton, Trentham) | 31.0% | 41.4% | 19.7% | 7.6% |
| ST5 (Newcastle-under-Lyme) | 48.9% | 32.5% | 11.4% | 4.7% |
| ST6 (Tunstall, Burslem) | 30.2% | 39.3% | 22.4% | 7.7% |
| ST7 (Kidsgrove, Alsager) | 45.4% | 37.1% | 14.1% | 3.0% |
| ST9 (Endon, Werrington) | 62.3% | 27.3% | 6.2% | 3.1% |
| ST11 (Blythe Bridge) | 47.0% | 38.7% | 9.5% | 4.3% |
| ST12 (Barlaston) | 45.6% | 39.3% | 9.7% | 5.3% |
ST1 (Hanley) holds the largest share of terraces at 40.0% and flats at 17.4%, with detached houses making up only a tenth of the stock. That is the smaller-unit housing that usually drives the buy-to-let market, and it lines up with ST1 carrying the lowest asking price and the highest yield in the city. The terraces suit standard family lets, while the flats and conversions near the centre work for single lets and sharers.
The outer postcodes are the mirror image. ST9 (Endon, Werrington) is 62.3% detached with just 6.2% terraced and 3.1% flats, and ST5, ST7, ST11, and ST12 all run close to or above half detached. That weighting towards larger owner-occupier homes matches their higher prices, slower sales, and thin rental data.
Flats combine purpose-built and converted units. A small share of mobile and temporary dwellings is not shown, so rows may not total 100%.
Stoke-on-Trent Rental Market Analysis
Monthly rents in Stoke-on-Trent range from £752 in ST1 (Hanley) to £982 in ST7 (Kidsgrove, Alsager), with gross rental yields from 4.5% to 6.9% across the six postcodes that carry rental data. For investors asking is buy-to-let worth it in Stoke, the sections below break down rents, yields, and tenant affordability postcode by postcode. If you are looking at how do I build a property portfolio in the Midlands, Stoke's combination of sub-£135,000 asking prices and yields above 5% across most inner postcodes is hard to match in the region. Browse current buy-to-let property for sale across the area.
Average Rent & Gross Rental Yields in Stoke-on-Trent
Gross rental yields in Stoke-on-Trent run from 4.5% in ST7 (Kidsgrove, Alsager) to 6.9% in ST1 (Hanley). The cheapest postcode delivers the highest yield, combining a monthly rent of £752 with the lowest asking price in the city. The table ranks all ten postcodes by yield, with six of ten returning rental data.
| Area | Average Monthly Rent | Asking Price | Gross Yield |
|---|---|---|---|
| ST1 (Hanley) | £752 | £131,395 | 6.9% |
| ST6 (Tunstall, Burslem) | £783 | £158,640 | 5.9% |
| ST3 (Longton, Meir) | £859 | £201,737 | 5.1% |
| ST4 (Stoke, Fenton, Trentham) | £812 | £195,748 | 5.0% |
| ST5 (Newcastle-under-Lyme) | £966 | £233,382 | 5.0% |
| ST7 (Kidsgrove, Alsager) | £982 | £262,453 | 4.5% |
| ST2 (Bentilee, Bucknall) | Not enough data | £196,324 | Not enough data |
| ST9 (Endon, Werrington) | Not enough data | £363,713 | Not enough data |
| ST11 (Blythe Bridge) | Not enough data | £323,136 | Not enough data |
| ST12 (Barlaston) | Not enough data | £389,538 | Not enough data |
ST1 at 6.9% combines the lowest asking price (£131,395) with the lowest rent (£752) yet still tops the yield table. A 30% deposit of £39,418 gets an investor into the highest-yielding postcode in the city, where the tenant pool runs from city centre workers to hospital staff and students within reach of Hanley.
ST6 (Tunstall, Burslem) at 5.9% is the runner-up, pairing a £783 rent with a £158,640 asking price. ST3, ST4, and ST5 all land at or just above 5.0%. ST7 (Kidsgrove, Alsager) sits at the bottom of the six on 4.5%, because its higher £262,453 asking price outpaces the £982 rent, the highest rent in the city. The pattern is consistent: the cheaper the postcode, the better the yield, because rents do not fall as fast as prices do.
The four postcodes without rental data (ST2, ST9, ST11, ST12) reflect thin landlord activity rather than no demand. PropertyData needs a minimum number of live rental listings to calculate a figure, and these postcodes do not consistently clear that bar. Three of the four are also the most expensive in the city, which fits a market weighted towards owner-occupiers.
Gross Rental Yield by Postcode

Is Stoke-on-Trent Rent High?
Monthly rents in Stoke-on-Trent take between 27.7% and 36.1% of the local median gross monthly salary. The widely cited threshold for rent affordability is 30% of gross income. Three of the six postcodes with rental data sit below that line, and three sit above it. The spread is narrow, which fits a city where both rents and wages are modest.
The median gross weekly salary in Stoke-on-Trent is £627.30, which equates to £2,718 per month or £32,622 per year. This is below the West Midlands regional median of £712.50 per week and the Great Britain median of £752.40 per week. Data from the Nomis Labour Market Profile (ASHE 2025).
| Rank | Area | Rent as % of Income |
|---|---|---|
| 1 | ST7 (Kidsgrove, Alsager) | 36.1% |
| 2 | ST5 (Newcastle-under-Lyme) | 35.5% |
| 3 | ST3 (Longton, Meir) | 31.6% |
| 4 | ST4 (Stoke, Fenton, Trentham) | 29.9% |
| 5 | ST6 (Tunstall, Burslem) | 28.8% |
| 6 | ST1 (Hanley) | 27.7% |
| - | ST2 (Bentilee, Bucknall) | Not enough data |
| - | ST9 (Endon, Werrington) | Not enough data |
| - | ST11 (Blythe Bridge) | Not enough data |
| - | ST12 (Barlaston) | Not enough data |
ST1, ST6, and ST4 all sit below 30% of income, which makes them the most affordable for tenants. Lower rent-to-income ratios tend to mean fewer void periods and less turnover, because tenants who are not stretched stay put. For a landlord that is a practical advantage that pairs neatly with ST1 and ST6 also being the two highest-yielding postcodes.
ST7 at 36.1% and ST5 at 35.5% are the least affordable on this measure, but the headline overstates the strain. Both carry the highest rents in the city, and the tenants paying them, professionals around Alsager and university-linked households in Newcastle-under-Lyme, often share larger homes, which brings the cost per person well below the figure for a single earner on the median wage.
How Big Is Stoke-on-Trent's Private Rented Sector?
The private rented sector is deepest in ST1 (Hanley), where it accounts for 31.4% of households, and thinnest in ST11 (Blythe Bridge) at 9.8%. The share of homes already rented privately is a guide to the size of the established tenant pool and the local lettings market. The table shows household tenure by postcode.
| Area | Owned Outright | Owned with Mortgage | Private Rented | Social Rented |
|---|---|---|---|---|
| ST1 (Hanley) | 25.9% | 23.5% | 31.4% | 18.3% |
| ST4 (Stoke, Fenton, Trentham) | 39.6% | 31.8% | 17.0% | 11.1% |
| ST6 (Tunstall, Burslem) | 39.5% | 28.3% | 16.2% | 15.6% |
| ST5 (Newcastle-under-Lyme) | 45.6% | 31.9% | 14.4% | 7.4% |
| ST7 (Kidsgrove, Alsager) | 47.0% | 32.8% | 13.2% | 6.3% |
| ST3 (Longton, Meir) | 40.1% | 28.5% | 12.8% | 18.0% |
| ST12 (Barlaston) | 41.3% | 36.1% | 11.7% | 10.7% |
| ST2 (Bentilee, Bucknall) | 34.8% | 25.7% | 11.7% | 27.0% |
| ST9 (Endon, Werrington) | 58.8% | 28.5% | 11.0% | 1.5% |
| ST11 (Blythe Bridge) | 48.8% | 31.1% | 9.8% | 9.8% |
ST1 (Hanley) has by far the largest private rented sector at 31.4% of households, almost twice the citywide pattern. A rented sector that size points to an active lettings market and a deep pool of existing tenants, which is the kind of structural demand that sits behind ST1's top yield. ST4 and ST6 follow at 17.0% and 16.2%, the two postcodes after Hanley where renting is most established.
The outer postcodes have the smallest rented sectors, with ST11, ST9, and ST2 all between 9.8% and 11.7%. ST9 (Endon, Werrington) shows the highest outright ownership in the city at 58.8% and almost no social housing, the profile of a settled owner-occupier area rather than a landlord market. Where there are enough live rental adverts to read the lettings market, the inner towns look the healthiest: a home in ST6 (Tunstall, Burslem) finds a tenant in around 65 days, and one in ST1 (Hanley) in about 83. Several of the thinner postcodes do not carry enough listings at any one time to read reliably.
Local Housing Allowance Rates in Stoke-on-Trent
Stoke-on-Trent spans three Broad Rental Market Areas, so Local Housing Allowance is not one set of rates across the city. Most of the city sits in the Staffordshire North area, but ST7 (Kidsgrove, Alsager) falls into South Cheshire and ST12 (Barlaston) into Mid Staffs, both of which run higher rates. Local Housing Allowance sets the maximum housing support a tenant on benefits can receive, so it acts as a rent floor for landlords letting to that part of the market. To check the current rate for a specific address, you can use the government's official Local Housing Allowance calculator.
| Property Size | Staffordshire North (most postcodes) | South Cheshire (ST7) | Mid Staffs (ST12) |
|---|---|---|---|
| Shared accommodation | £69.35 | £74.79 | £81.10 |
| 1 bedroom | £97.81 | £109.32 | £115.07 |
| 2 bedrooms | £110.47 | £132.33 | £143.84 |
| 3 bedrooms | £136.93 | £156.49 | £170.30 |
| 4 bedrooms | £184.11 | £228.99 | £228.99 |
Most of Stoke's postcodes (ST1 through ST6, plus ST9 and ST11) fall in the Staffordshire North area, where the two-bedroom rate of £110.47 a week works out at about £479 a month. That sits well below the £752 to £982 market rents recorded across the city, so a benefit-backed tenancy at the LHA rate comes in under open-market levels, with the stock that fits concentrated in the lower-priced inner postcodes. ST7 (Kidsgrove, Alsager) draws the higher South Cheshire rates, and ST12 (Barlaston) the higher Mid Staffs rates, both reflecting their position towards the edge of the authority. Rates are quoted per week and updated each April.
Buy-to-Let Considerations
Are House Prices High in Stoke-on-Trent? Price-to-Earnings Ratios
Purchasing a property in Stoke-on-Trent requires between 4.0 and 11.9 times the median annual salary. This is based on the Nomis Labour Market Profile for Stoke-on-Trent showing the median gross annual income for Stoke residents is £32,622.
The national benchmark for price-to-earnings is 7.4x (England's average sold price of £289,946 divided by the Great Britain median annual salary of £39,125). Five of Stoke's ten postcodes sit below that benchmark, meaning they are more affordable relative to local incomes than the England average is relative to national incomes.
| Rank | Area | Price-to-Earnings Ratio |
|---|---|---|
| 1 | ST1 (Hanley) | 4.0x |
| 2 | ST6 (Tunstall, Burslem) | 4.9x |
| 3 | ST4 (Stoke, Fenton, Trentham) | 6.0x |
| 4 | ST2 (Bentilee, Bucknall) | 6.0x |
| 5 | ST3 (Longton, Meir) | 6.2x |
| 6 | ST5 (Newcastle-under-Lyme) | 7.2x |
| 7 | ST7 (Kidsgrove, Alsager) | 8.0x |
| 8 | ST11 (Blythe Bridge) | 9.9x |
| 9 | ST9 (Endon, Werrington) | 11.1x |
| 10 | ST12 (Barlaston) | 11.9x |
ST1 at 4.0 times earnings is one of the lowest price-to-income ratios of any postcode in our database. A home priced at four times the local median salary is within reach of a single-income buyer on a standard mortgage. For an investor, a low ratio like this matters because it means owner-occupiers can compete for the same stock, which tends to support prices over time rather than leaving them dependent on landlord demand alone.
The outer postcodes climb into double digits, with ST9 at 11.1x and ST12 at 11.9x. Those ratios are calculated against the Stoke median wage, but the buyers in these postcodes are typically commuting professionals earning above it, so the figure overstates the local affordability gap. What it does confirm is that these are not buy-to-let markets.
Deposit Requirements in Stoke-on-Trent
A 30% deposit on a buy-to-let property in Stoke-on-Trent runs from £39,418 in ST1 (Hanley) to £116,861 in ST12 (Barlaston). The gap between the cheapest and most expensive deposit is £77,443, which is enough to fund a second deposit in ST1 with change to spare. Beyond the deposit, the stamp duty calculator buy to let and other buy to let costs add to the total capital required.
| Rank | Area | 30% Deposit Required |
|---|---|---|
| 1 | ST1 (Hanley) | £39,418 |
| 2 | ST6 (Tunstall, Burslem) | £47,592 |
| 3 | ST4 (Stoke, Fenton, Trentham) | £58,724 |
| 4 | ST2 (Bentilee, Bucknall) | £58,897 |
| 5 | ST3 (Longton, Meir) | £60,521 |
| 6 | ST5 (Newcastle-under-Lyme) | £70,015 |
| 7 | ST7 (Kidsgrove, Alsager) | £78,736 |
| 8 | ST11 (Blythe Bridge) | £96,941 |
| 9 | ST9 (Endon, Werrington) | £109,114 |
| 10 | ST12 (Barlaston) | £116,861 |
The deposit for ST1 at £39,418 is barely a third of what ST12 demands. For an investor with around £60,000 of capital, the bottom five postcodes are all in reach, and four of them (ST1, ST6, ST4, ST3) return gross yields between 5.0% and 6.9%. That is the practical appeal of Stoke's price structure: a low deposit puts more of the capital to work from day one, and the postcodes where the deposits are lowest are also where the yields are highest.

What the Stoke-on-Trent Data Tells Buy-to-Let Investors
In Stoke the cheapest way in is also the highest-yielding postcode. ST1 (Hanley) leads on yield at 6.9%, carries the lowest asking price for buying an investment property at £131,395, and is the most affordable against local earnings at 4.0 times income. A 30% deposit there is £39,418, the lowest in the city, for a home renting at £752 a month. It also has the deepest private rented sector at 31.4% and the fastest-selling market, so the demand and the exit route both line up behind the headline yield.
ST6 (Tunstall, Burslem) is the steady runner-up. It returns a 5.9% yield on a £158,640 asking price, with 22.6% growth over five years and a busy sales market behind it. ST3 (Longton, Meir) is where income and growth meet most evenly: 26.5% five-year growth alongside a 5.1% yield and 51 sales a month. ST5 (Newcastle-under-Lyme) tops the growth table at 32.8% over five years, though its higher asking price pulls the yield back to 5.0%.
The four postcodes with no rental data (ST2, ST9, ST11, ST12) sit apart from the rest. Three of the four are the most expensive in the city, they turn over a handful of sales a month, and ST11 and ST12 can take well over a year to sell. These are owner-occupier markets with thin landlord activity, and their swinging growth figures come from the low transaction volumes rather than any real trend. Buyers who want to come in below asking often look through off-market properties and BMV property channels.
Stoke-on-Trent does not currently operate a boroughwide selective licensing scheme for private lets, though mandatory HMO licensing still applies and the council has consulted on selective licensing in the past. Landlords should check the current position and factor in any licensing fees and property standards requirements on the council's property licensing pages before they budget the deal.
How Stoke-on-Trent Compares
Stoke-on-Trent has the lowest mean asking price (£245,606) and the lowest mean rent (£859) of the seven Midlands cities compared below, yet its 6.9% top yield is bettered only by Nottingham. The comparison places Stoke alongside six nearby cities at different price points. Mean asking price and mean rent are simple averages across all postcodes with data; top gross yield is the single highest postcode yield in each location.
| Location | Mean Asking Price | Mean Monthly Rent | Mean Gross Yield | Top Yield (postcode) |
|---|---|---|---|---|
| Nottingham | £242,515 | £1,053 | 5.2% | 8.2% (NG1, NG7) |
| Stoke-on-Trent | £245,606 | £859 | 4.2% | 6.9% (ST1) |
| Wolverhampton | £255,437 | £986 | 4.6% | 5.5% (WV1) |
| Birmingham | £274,029 | £1,111 | 4.9% | 7.2% (B18) |
| Derby | £282,243 | £984 | 4.2% | 5.8% (DE1) |
| Coventry | £293,448 | £1,085 | 4.4% | 6.9% (CV1) |
| Leicester | £300,970 | £1,058 | 4.2% | 7.3% (LE1) |
Stoke's mean rent of £859 is the lowest in this group, which reflects lower local wages rather than a weak rental market. The trade-off shows up in the yield column: Stoke's 6.9% top yield sits above Wolverhampton (5.5%) and Derby (5.8%) precisely because its purchase prices are so low, even though absolute rents trail the field.
Nottingham leads on yield at 8.2% at a similar mean asking price. Birmingham offers higher rents (£1,111) and a 7.2% top yield at a £28,000 price premium. Leicester and Coventry deliver 7.3% and 6.9% top yields but at mean asking prices approaching or above £290,000. For investors prioritising the lowest capital outlay, Stoke's £39,418 entry deposit via ST1 is the most accessible in this group, roughly half what a comparable yield costs in Leicester or Coventry. For a data-driven comparison across all UK locations, see our best buy-to-let areas guide.
Frequently Asked Questions
Is Stoke-on-Trent a good place to invest in buy-to-let?
It works well if your priority is yield on a small budget. Stoke has some of the cheapest house prices in England, with an average sold price of £150,990, around half the England average, and that low entry is what lifts gross yields above 5% across most of the inner postcodes. ST1 (Hanley) tops the city at 6.9%.
The trade-off is the city's history. Stoke crashed harder than the national average in 2008 and took close to eleven years to climb back, so it is a market where downside is a real part of the picture, not a footnote. The demand side is steady, though, with two universities, a major teaching hospital, and ongoing city centre regeneration all feeding the inner-town rental market.
What are the best areas for buy-to-let in Stoke-on-Trent?
The inner pottery towns, and ST1 (Hanley) leads on almost every measure. It carries the highest yield at 6.9% on the cheapest asking price in the city, £131,395, and nearly a third of its homes are already rented privately, so the tenant demand sits behind the numbers rather than being a hope. ST6 (Tunstall, Burslem) is the steady runner-up at a 5.9% yield with 22.6% five-year growth.
If you want growth alongside income, ST3 (Longton, Meir) pairs 26.5% five-year growth with a 5.1% yield and a busy sales market. The outer postcodes (ST9, ST11, ST12) are best left to owner-occupiers: high prices, no rental data, and homes that can take well over a year to sell.
What is a good rental yield in Stoke-on-Trent?
Five of the six postcodes with rental data clear 5.0%, and ST1 (Hanley) reaches 6.9%, so a yield in the mid-5s upwards is a realistic target in the inner towns. ST6 returns 5.9%, with ST3, ST4, and ST5 all sitting at or just above 5.0%, and ST7 (Kidsgrove, Alsager) the lowest of the six at 4.5% because its higher purchase price outpaces the rent.
Those are gross figures, before management, maintenance, voids, and finance costs, so the net return will be lower. They hold up because rents in Stoke do not fall as fast as prices do, which is the whole reason a cheap city can out-yield a dearer one.
What are average house prices in Stoke-on-Trent?
The average sold price across Stoke-on-Trent is £150,990 on the Land Registry index, about 47.9% below the England average of £289,946 as of March 2026. Asking prices by postcode run from £131,395 in ST1 (Hanley) up to £389,538 in ST12 (Barlaston), with a citywide mean of £245,606. By type, detached homes average £236,884, semi-detached £162,525, terraced £128,210, and flats £92,561.
Through a buy-to-let lens, ST1 is the cheapest entry and the highest-yielding at 6.9%, while the outer postcodes are the dearest and carry no rental data.
What type of property is most common in Stoke-on-Trent?
It depends which part of the city. In ST1 (Hanley) terraces are the largest single type at 40.0%, with flats adding another 17.4%, the smaller-unit stock that usually drives buy-to-let. Move out to the rural fringe and the picture flips: ST9 (Endon, Werrington) is 62.3% detached, and ST5, ST7, ST11, and ST12 all run close to or above half detached.
For a landlord that split matters, because the terraces and flats in the inner towns are where the rental demand and the higher yields sit, while the detached stock in the outer postcodes is owner-occupier territory.
Is there demand for student accommodation in Stoke-on-Trent?
Yes. Staffordshire University and Keele University bring around 20,000 students to the area between them, and they rent across the city, with ST4 and ST5 the main draws. ST4 (Stoke, Fenton, Trentham) sits close to the Royal Stoke University Hospital as well, so it draws both students and hospital staff.
On the shared-house side, a sample of current room adverts puts a double room with an ensuite at around £141 a week in ST5 and £132 in ST4, with shared-bathroom doubles closer to £105 to £111. Student and shared lets come with summer voids and more hands-on management than a single tenancy, so factor that in. For how the numbers work on a shared house, see our complete guide to investing in HMOs.
How does Stoke-on-Trent compare to Nottingham for investment?
They have almost the same mean asking price (Stoke £245,606 against Nottingham £242,515), but Nottingham delivers a higher top yield at 8.2% versus 6.9% and a higher mean rent at £1,053 versus £859. Nottingham has a larger student population and a deeper, more established city centre rental market.
Stoke's edge is the inner-city asking price. ST1 at £131,395 needs a 30% deposit of just £39,418, which is the cheapest way into either city. If the smallest possible capital outlay is the priority, Stoke wins; if top-line yield and a bigger rental market matter more, Nottingham does.
Is Stoke-on-Trent a nice place to live?
The city has changed a lot since the pottery industry declined. The city centre regeneration includes the completed £60 million Goods Yard development beside Stoke station and the planned Etruscan Square scheme in Hanley, and the wider area runs from the market town of Newcastle-under-Lyme to the Staffordshire Moorlands countryside on its eastern edge. The population of 258,366 grew 3.8% between the 2011 and 2021 censuses.
For tenants, the practical draws are affordability and connectivity: low rents by national standards, two universities, a major hospital, and direct trains to Manchester in around 45 minutes and London in about 90.
How do I buy an investment property in Stoke-on-Trent?
Start by deciding whether you are buying for income or for growth, because that points you at a different postcode. ST1 (Hanley) is the cheapest entry at £131,395 and the highest-yielding at 6.9%, so it leans towards income. ST3 (Longton, Meir) and ST5 (Newcastle-under-Lyme) carry the stronger five-year growth. Budget for a 30% deposit, which runs from £39,418 in ST1 up to £116,861 in ST12.
Beyond what is listed openly, experienced investors often buy below asking through off market properties and BMV properties. To see what is available now, browse investment properties or buy-to-let homes for sale.
Ready to buy property?
Access off-market investment properties with an average 8%+ annual gross yield (beating the UK's typical 3-5%).
Get property alerts