
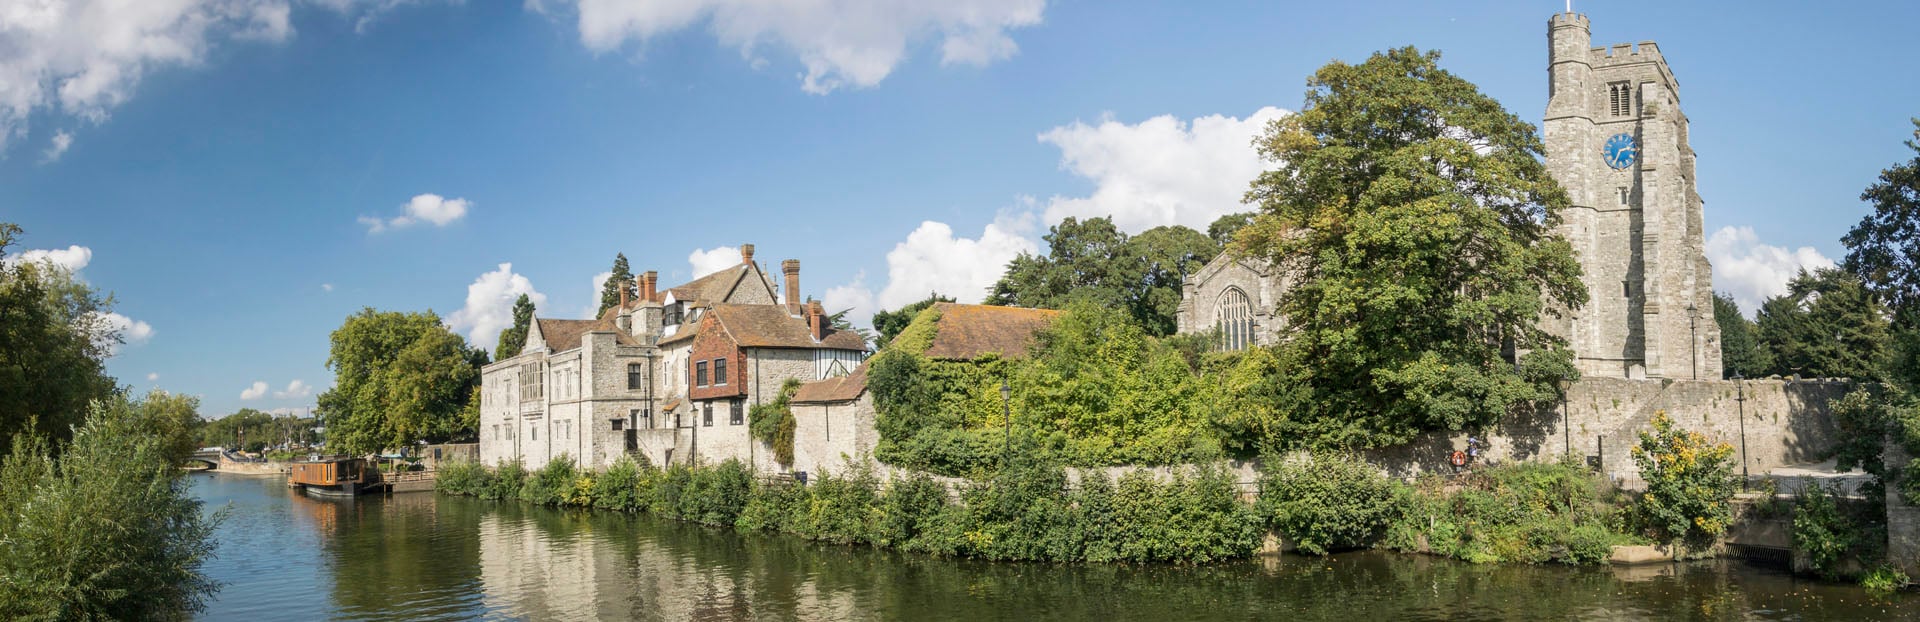
Kent is a county in south-east England, running from the edge of Greater London out to the Channel coast, and its average home sold for £344,780 in March 2026, about 19% above the England average of £289,946. That sits it among the pricier counties outside London, but the county average hides a wide spread: the Medway towns carry gross yields up to 6.3% on sold prices well below the county line, while the county's top postcode-level yield reaches 6.5% around Dartford. A 30% buy-to-let deposit on the £344,780 county average is about £103,434 before other purchase costs.
Five-year growth stands at 10.5%, from £312,037 in March 2021, even after the average slipped 4.5% from its October 2022 high of £361,035. Zoom out and the county is up 492% on its 1995 level of £58,220, so the current soft spell reads as a pause in a long climb rather than a reversal of it.
Rent and price pull in opposite directions here. The strongest gross yields sit in the cheaper north Kent and coastal markets, and the thinnest in the commuter and cathedral towns where buyers pay for access and prestige. The three town guides below cover the areas where we hold postcode-level data, and the sections after them widen out to the county picture those towns belong to, from the price history to the coastal and commuter markets that give Kent its range.
Article updated: July 2026
Explore Kent town guides
Compare local yields and sold prices across Kent's town guides before the county market analysis.


The Kent property market
The thirty-year record splits into a rise, a crash and a long recovery. From £58,220 in January 1995 the county average climbed for over a decade to £215,585 by December 2007, before the financial crisis pulled it down to £174,266 by April 2009, a drop of 19.2%. Kent did not regain its 2007 level until May 2014, and from there the market ran up to its all-time high of £361,035 in October 2022.
The market has drifted sideways since. At £344,780 the average sold price sits 4.5% below the 2022 peak, though it is still 10.5% up across five years. The long monthly view is worth reading because it separates two very different moves: the sharp 2008 fall, and the milder step back since 2022 that reads as a plateau rather than a fresh downturn. The first chart shows how far prices split by property type, the second whether they are rising or falling year on year.
- All property types
- Detached
- Semi-detached
- Terraced
- Flats
- All property types
- Detached
- Semi-detached
- Terraced
- Flats
Property type changes the picture sharply. A detached Kent home now averages £600,740, a semi £376,930, a terrace £297,286 and a flat £188,457, so more than £412,000 separates the top and bottom of that ladder, the widest single spread in the county's numbers. Flats have been the weak point through the plateau, their year-on-year reading down 4.4% in early 2026 while houses have held close to flat. For the wider market these figures sit within, our guide to the best buy-to-let areas in the UK places Kent next to the regions where asking prices fall and yields climb.

Best areas to invest in Kent
There is no single Kent market, only a spread of local ones that reward reading by price and yield rather than by name. Income tracks price in reverse: the cheaper north Kent and coastal towns hold the higher gross yields, the desirable commuter and cathedral towns the lower. Across the three town guides the order is clear enough, with Medway on the lowest asking price and the highest yield, Maidstone on the largest budget and the lowest yield, and Canterbury between the two. The table sets each against its mean asking price, top gross yield and the 30% deposit needed to buy, highest yield first.
| Town | Mean Asking Price | 30% Deposit | Top Gross Yield |
|---|---|---|---|
| Medway towns | £339,902 | £101,971 | 6.3% |
| Canterbury | £412,829 | £123,849 | 5.2% |
| Maidstone | £491,082 | £147,325 | 4.8% |
The Medway towns of Chatham, Gillingham, Rainham, Rochester and Strood are the largest urban area in Kent and carry the highest yields of the three, up to 6.3% on a £339,902 mean asking price, the lowest entry cost in the table. Canterbury, Kent's cathedral and student city, runs at 5.2% on £412,829, with a large student rental base behind that demand. Maidstone, the county town, sits at 4.8% on £491,082, the highest asking price and lowest yield of the three. Across the wider county, the highest postcode-level gross yield we record is 6.5% in DA10, on the north Kent Thames side near Dartford, one of the areas set to gain most from the new Lower Thames Crossing.
Outside the three town guides, several Kent names come up repeatedly for buyers weighing the county, even where we do not yet hold postcode-level data. Royal Tunbridge Wells, the historic spa town on the edge of the High Weald about 31 miles south of London, is one of Kent's higher-priced commuter markets and one such name. Sevenoaks, near the M25 and M26 junctions around 20 miles from London, is another of the county's higher-value commuter spots. Ashford, on the M20 with its international rail station, and Gravesend, around 20 miles from London with a fastest train of 24 minutes, sit lower on price and are where much of the county's commuter demand concentrates. For a wider view of where the county's demand is heading, our guide to the up-and-coming areas of the London commuter belt covers the towns pulling buyers out of the capital.

Kent's coastal and commuter markets
Two demand stories run underneath the county average, and they pull in opposite directions on price, one along the coast and one across the commuter belt.
The Kent coast
Kent's Channel and Thames Estuary coastline holds a string of lower-priced towns, from Folkestone and Dover in the south-east to Margate, Ramsgate and Broadstairs on the Isle of Thanet, and Whitstable and Herne Bay to the west. Several have seen regeneration draw visitors and second-home buyers, Margate around the Turner Contemporary gallery and Whitstable as a weekend and relocation town, and the same coast feeds a holiday-let market for owners letting to visitors rather than to long-term tenants. Coastal Kent is where the county's lower sold prices and higher gross yields concentrate, on the same north Kent and east Kent postcodes that carry the county's 6%-plus yields.
The commuter belt
Good rail and road links put much of Kent within 30 to 45 minutes of central London, and the county has long taken buyers priced out of the capital. Ebbsfleet is about 20 minutes from London by high-speed rail and Ashford International about 40 minutes, and the M20, M2 and A2 tie the county to London and the Channel ports. The commuter towns, Tunbridge Wells, Sevenoaks, Gravesend, Dartford and Ashford among them, are where the higher asking prices sit, because London-facing demand competes for the stock. North Kent around Dartford and the Medway towns is where the two stories meet: commuter-belt access on some of the county's lower prices, which is the combination behind its higher yields. The new Lower Thames Crossing, a road tunnel that will link Kent to Essex under the Thames, runs through this same north Kent belt.
Kent's student and HMO market
Kent carries a sizeable student population, and it concentrates in the two markets already named in the table. Canterbury is the larger of the two, home to the University of Kent's main campus and to Canterbury Christ Church University, and that student base sits behind the 5.2% gross yield the city records. The Medway towns hold the second cluster: Universities at Medway is a shared campus at Chatham Maritime run jointly by the University of Kent, the University of Greenwich and Canterbury Christ Church University, and its students feed the rental stock in the same postcodes that carry the county's 6.3% top town yield. Student demand in both places supports the room-by-room letting model that most changes the yield an investor can reach.
That model is the house in multiple occupation, or HMO, where a property is let by the room rather than on a single tenancy. Letting room by room can lift the gross yield above the single-tenancy figures in the table above, which is why the lower-priced Canterbury and Medway markets draw multi-let investors. The trade-off is heavier management and tighter regulation. Our guide to investing in HMOs sets out how the room-by-room maths changes the yield calculation, and for the purpose-built end of student demand our guide to student property investment covers the block model. A multi-let plan also turns on local rules: some Kent councils operate an Article 4 Direction that removes permitted-development rights for smaller HMOs, or a selective licensing scheme, and you can look up the requirement for any address by postcode on the government's HMO licence pages.
What a Kent buy-to-let deposit costs
Because a buy-to-let mortgage is normally arranged on a 30% deposit, the type of property you buy sets the cash you need up front more than any other choice. The table below takes the latest average Kent price for each property type and the 30% deposit that goes with it, with the mortgage covering the remaining 70%.
| Property type | Average Kent price | 30% deposit |
|---|---|---|
| Detached | £600,740 | £180,222 |
| Semi-detached | £376,930 | £113,079 |
| Terraced | £297,286 | £89,186 |
| Flat | £188,457 | £56,537 |
On the county-average home of £344,780 the deposit is about £103,434, and a lower-priced Medway purchase nearer £339,902 brings it to roughly £101,971. The spread from a flat to a detached house, £56,537 against £180,222, is more than threefold, which is why the property type you target shapes a Kent budget as much as the town you buy in.
How to invest in Kent
With the deposit planned for, stamp duty is the next cost to budget. It is the largest single charge on the purchase and climbs with price because of the higher rates on additional property, so our stamp duty calculator works out the figure for a specific purchase price. From there the choice follows the split the rest of this guide sets out: the lower-priced coastal and north Kent towns are where the higher-yield and multi-let plans concentrate, while the commuter belt leans more on capital growth than on rental income.
By that point the Kent decision comes down to one split: whether the budget points towards north Kent and the coast for income, or towards the commuter towns for a higher-priced, London-facing market. With the area chosen, weigh what is on the market now: our listings of investment property, our buy-to-let property for sale and our below market value properties for sale, read against the three Kent town guides above. For the county next door, our guide to buy-to-let in Essex covers the market on the other side of the Thames, and our London buy-to-let hub covers the boroughs of Bexley and Bromley that were historically part of Kent.
Frequently Asked Questions
Is Kent expensive?
Pricier than most of England, and it varies a lot by town. The average home sold for £344,780 in March 2026, about 19% above the England average of £289,946, which puts Kent among the pricier counties outside London. The county average covers a wide range, though. The Medway towns run on a mean asking price of £339,902 and the county's cheapest postcode, CT17 in Dover, sits nearer £226,761, while the commuter towns of Tunbridge Wells and Sevenoaks push well past the county line.
What is the average house price in Kent?
The average Kent home sold for £344,780 in March 2026, up 10.5% over five years from £312,037 in March 2021. The county reached an all-time high of £361,035 in October 2022 and has eased 4.5% since. Prices climb sharply by property type, with the average detached home at £600,740 and the average flat at £188,457, and by town, from the Medway towns near £339,902 to Maidstone at £491,082.
Where are the best areas to invest in Kent?
If income is the priority, the lower-priced north Kent and coastal markets carry the higher yields: the Medway towns reach up to 6.3% gross on a £339,902 mean asking price, and the county's top postcode yield is 6.5% in DA10 near Dartford. Canterbury, at 5.2%, pairs a lower yield with a large student rental base, while the commuter and cathedral towns such as Maidstone at 4.8%, Tunbridge Wells and Sevenoaks sit lower on yield and higher on price. The three town guides above rank the areas where we hold postcode-level data.
Which Kent towns have the highest rental yields?
Of the towns where we hold postcode-level data, the Medway towns lead at up to 6.3% gross, on the lowest asking price of the three at £339,902. Canterbury follows at 5.2% and Maidstone at 4.8%. Across the wider county the highest postcode-level yield we record is 6.5% in DA10 near Dartford. Yields rise as asking prices fall, so the lower-priced north Kent and coastal towns pair the lowest entry cost with the highest income return.
Is Kent good for buy-to-let?
Its buy-to-let profile splits by area. Gross yields run from about 4.8% in the higher-priced commuter towns to 6.3% around the Medway towns and 6.5% in the top north Kent postcode, against a county average sold price of £344,780 that is up 10.5% over five years. The north Kent and coastal towns carry the higher yields on lower prices, while the commuter belt around Tunbridge Wells and Sevenoaks returns more through asset value and London-facing demand than through rent.
How much deposit do I need for a Kent buy-to-let?
Plan for 30% of the purchase price. That is about £103,434 on the county-average £344,780 home, with a mortgage covering the other 70%, and closer to £101,971 on a lower-priced Medway purchase near £339,902. The deposit shifts far more by property type than by town, from roughly £56,537 on an average flat to £180,222 on an average detached house. Stamp duty is charged on top and climbs with price, so our stamp duty calculator gives the full transaction cost for a given purchase.
Ready to buy property?
Access off-market investment properties with an average 8%+ annual gross yield (beating the UK's typical 3-5%).
Get property alerts