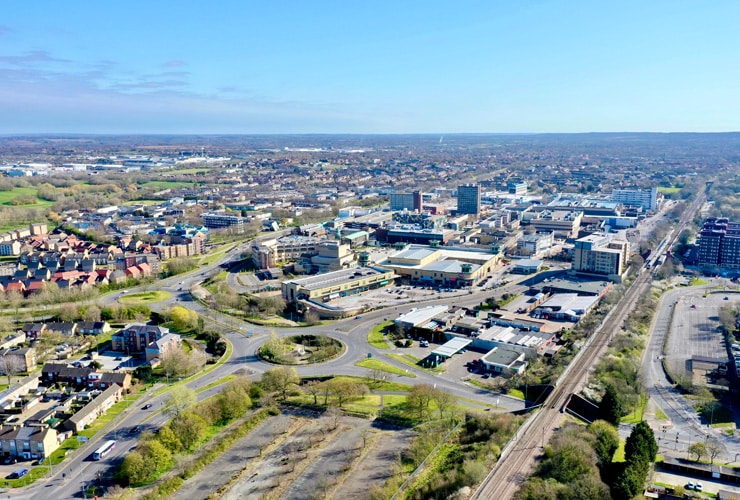
Essex is a large county in the East of England, wrapped around the north-east edge of Greater London and running out to the North Sea coast at Southend, Clacton and Harwich. That shape is the whole story for an investor. The western towns sit inside the London commuter belt and price accordingly, while the estuary and coastal towns further east are cheaper to buy into and tend to carry the higher rental yields.
Across the county, the average sold price sits at £357,476 as of March 2026, on Land Registry figures. That is about 23% above the England average of £289,946, which tells you Essex is a southern, London-adjacent market rather than a bargain one. But the county average hides a wide spread. A flat in Essex averages £187,624 and a detached house £576,896, and the towns we cover run from Colchester and Southend in the high £360,000s to Chelmsford up at £538,633 on asking prices.
The gap between price and yield is where the decisions get made. Of the five Essex towns we cover in depth, Basildon carries the highest gross yield at 6.1%, while Chelmsford, the most expensive of the five, sits at 4.5%. A 30% deposit on the county average sold price is roughly £107,243 before stamp duty and fees, so this is a market that asks for real capital up front. Below you can compare each town, then read the county market data underneath.
Article updated: July 2026
Explore Essex town guides
Compare local yields and sold prices across Essex's town guides before the county market analysis.
The Essex property market
Essex prices have run the same long arc as most of the South East, with local timing worth knowing before you read too much into any single figure. In January 1995 the average Essex home sold for £60,023. By January 2008 that had climbed to £221,888, the pre-crash high point for the county.
Then the financial crisis hit. Essex prices fell to a low of £178,231 by April 2009, a drop of just under 20% from the 2008 peak. The recovery took years rather than months: Essex did not climb back above its 2008 level until May 2014. From there the London ripple pushed the county up hard through the mid-2010s. The all-time high on the Land Registry series came in November 2022 at £369,886, and today's £357,476 sits about 3% below that peak, which is where a lot of southern markets have settled after interest rates rose.
The property-type spread is the part that matters most for a buy-to-let decision. The £576,896 detached average and the £187,624 flat average are £389,272 apart, so the kind of home you buy changes the deposit far more than the town does. Terraced houses average £307,138 and semis £375,466. The two charts below show the full 1995-to-2026 price history by property type and the year-on-year change, so you can see how each type moved through the crash and the recovery rather than just the headline county number.
- All property types
- Detached
- Semi-detached
- Terraced
- Flats
- All property types
- Detached
- Semi-detached
- Terraced
- Flats
Best areas to invest in Essex
The table ranks the five Essex towns we cover by top gross yield, using the latest PropertyData asking prices and 30% deposits. Basildon leads on yield; Chelmsford leads on price.
| Area | Mean Asking Price | 30% Deposit | Top Gross Yield |
|---|---|---|---|
| Basildon | £417,382 | £125,215 | 6.1% |
| Harlow | £431,182 | £129,355 | 5.6% |
| Colchester | £367,298 | £110,189 | 5.4% |
| Southend-on-Sea | £375,500 | £112,650 | 4.9% |
| Chelmsford | £538,633 | £161,590 | 4.5% |
The single highest-yielding postcode across these towns is SS14 in Basildon, at 6.1% gross on an average asking price of £319,099. SS13 next door runs it close at 6.0%, and Harlow's CM20 reaches 5.6%, so the yield map in Essex clusters around Basildon and Harlow in the west rather than the coast. That is the reverse of the usual cheaper-coast-higher-yield pattern, and it comes down to strong commuter rents holding up against still-reachable asking prices in those two towns.
Beyond the five we cover in full, Essex also draws searches for towns like Brentwood, Grays and Braintree. Brentwood is the county's high-price outlier, well above the Essex average, so it tends to buy growth history rather than yield. Grays, the main town in Thurrock on the Thames, sits at the cheaper end. We do not hold separate postcode datasets for those towns here, so treat them as areas to research rather than figures to bank.
Essex's commuter and coastal markets
Essex splits into two rental stories, and they price very differently.
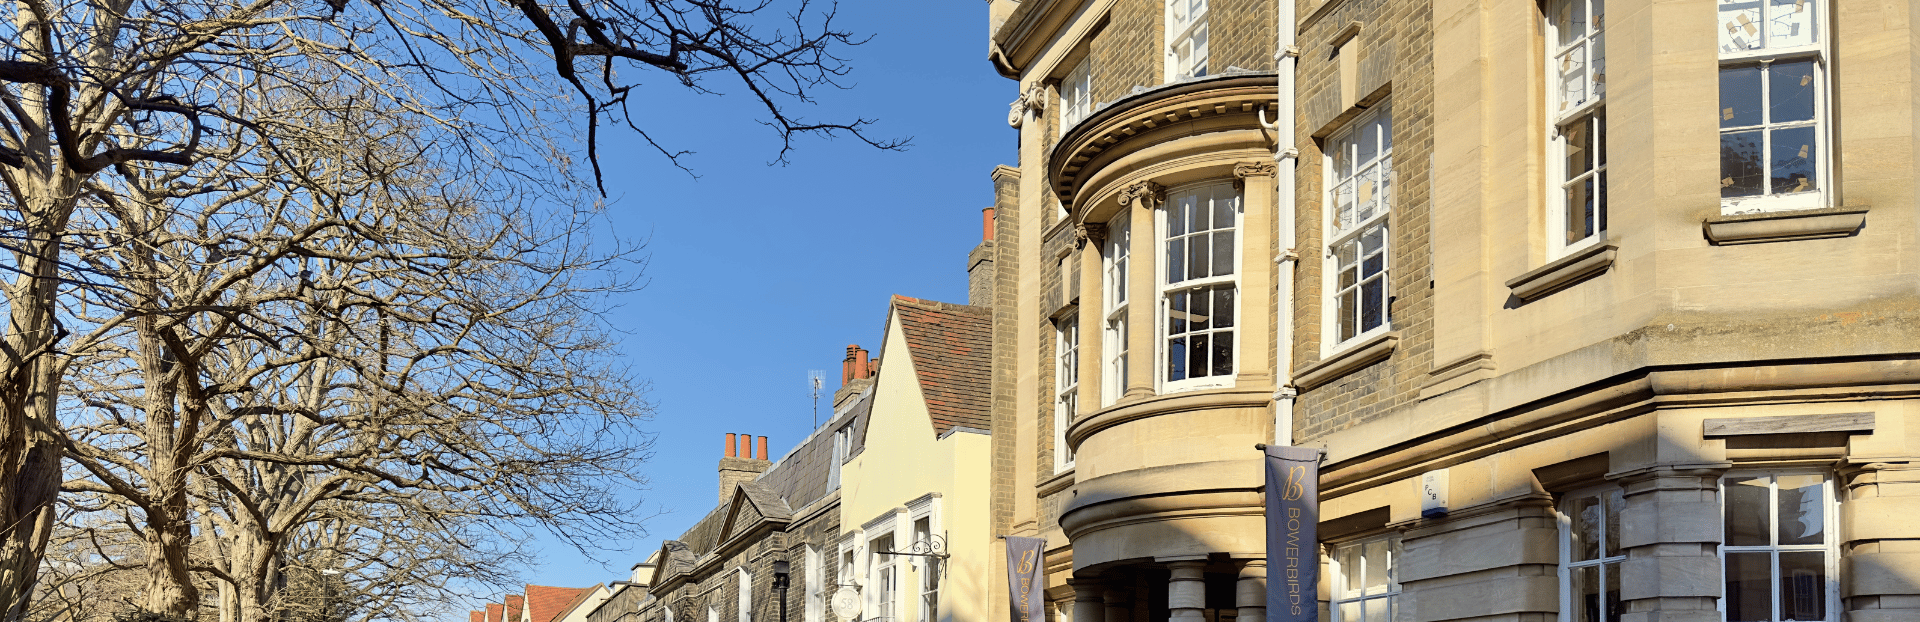
The London commuter belt
West Essex is really an extension of the London rental market. Harlow sits on the M11 and the Greater Anglia line into Liverpool Street, and its CM20 postcode reaches a 5.6% gross yield on an average asking price around £304,671, which is why it ranks second of the five towns on yield. Chelmsford, a city since 2012, runs a fast service into Liverpool Street and carries the highest asking price of the group at £538,633, with the yield settling at 4.5%. Basildon, on the c2c line down to Fenchurch Street, carries the highest yield of the group at 6.1%. The pattern across the commuter towns is consistent: rents track London affordability, so the towns with lower asking prices relative to those rents produce the stronger yields.
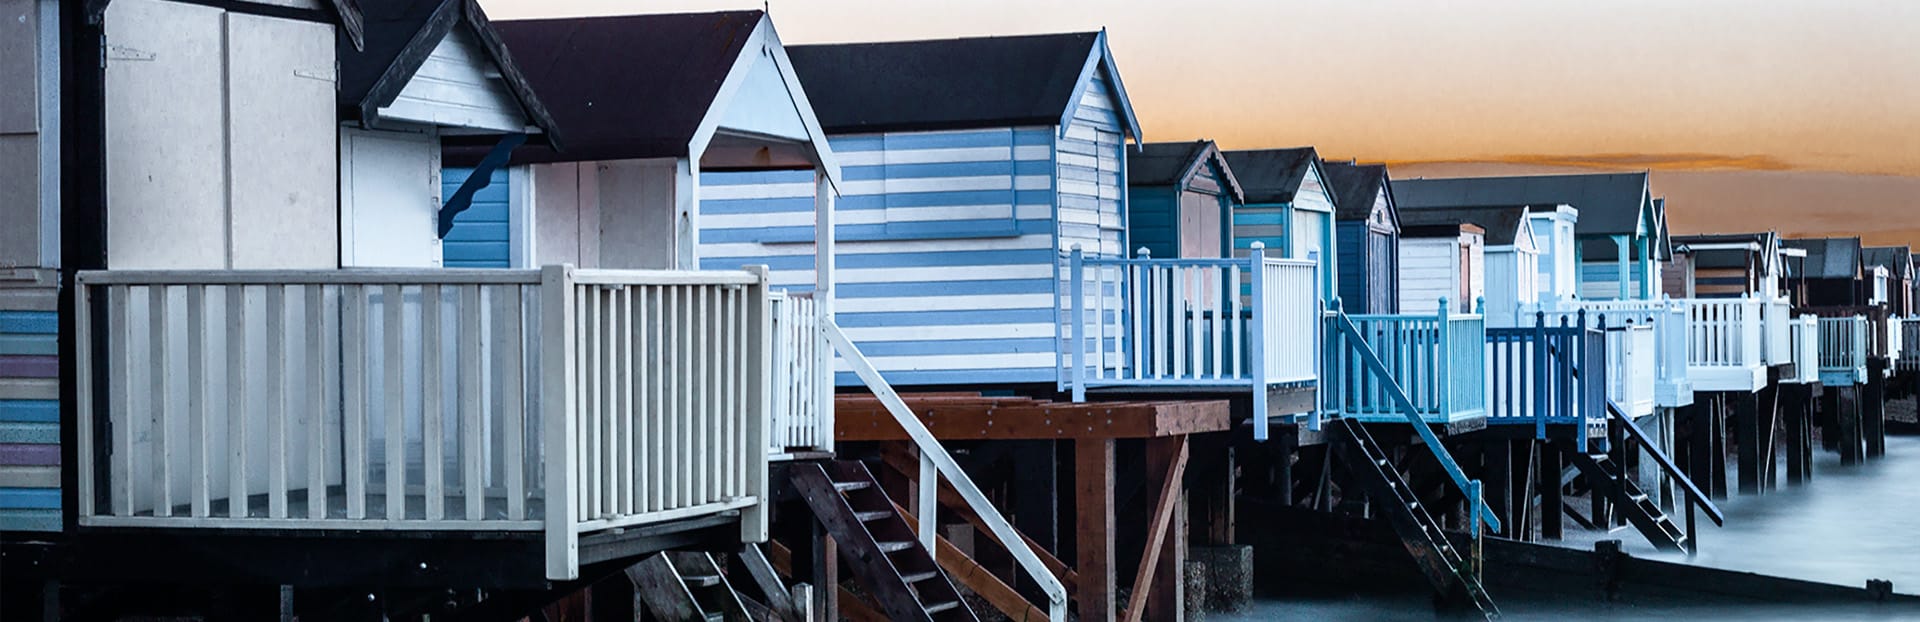
The Thames Estuary and the coast
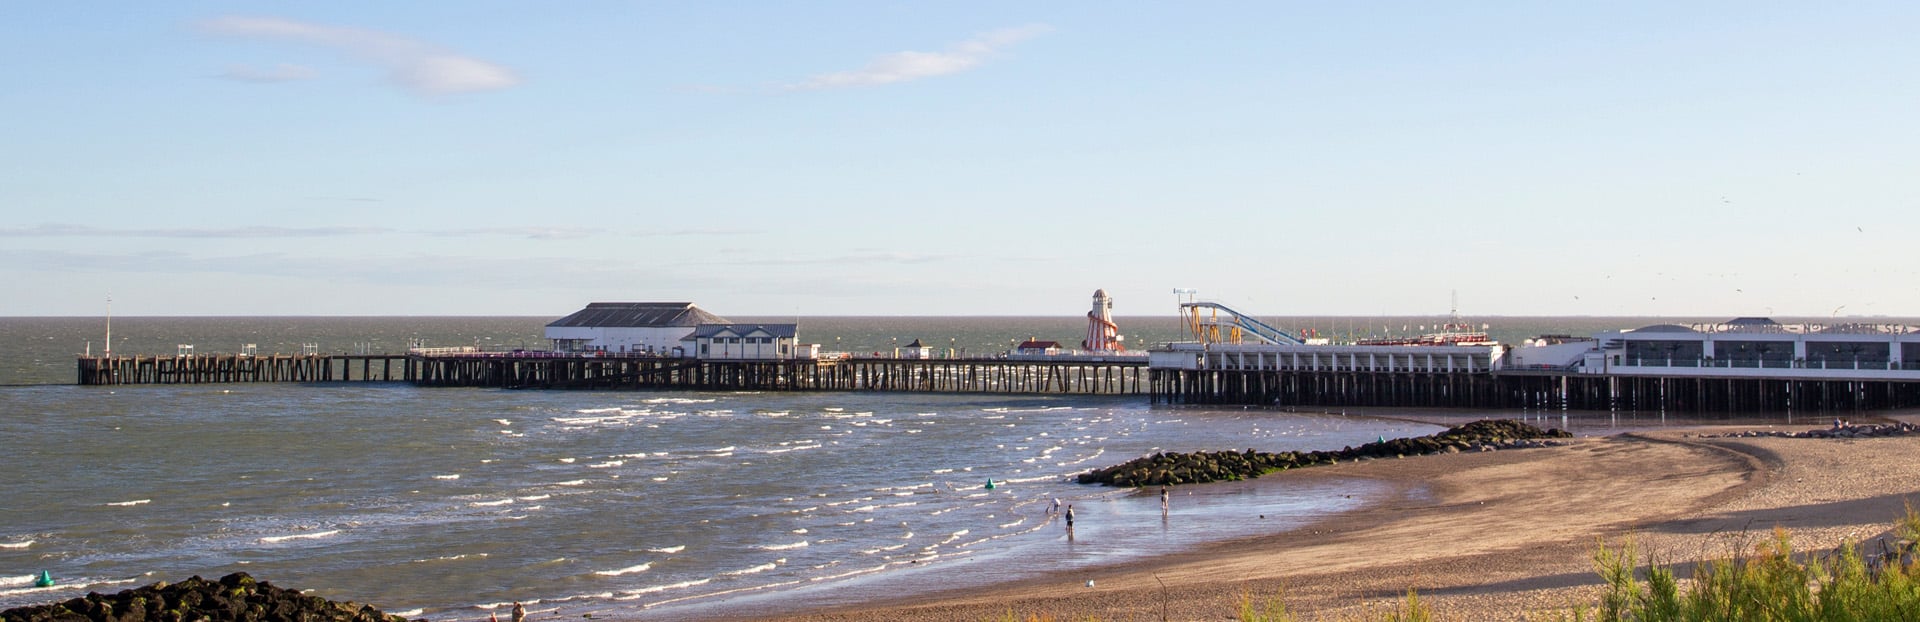
Further east and south, the market changes character. Southend-on-Sea is the big coastal town, a former seaside resort with its own line into Fenchurch Street and Liverpool Street, and it averages £375,500 on asking prices at a 4.9% yield. Colchester, up in the north-east of the county near the Suffolk border, is the historic garrison and university town and averages £367,298 at 5.4%. Colchester's CO1 and CO2 postcodes both reach 5.4%, giving it a broader spread of workable yields than the single-postcode coastal towns, which reflects a deeper and more varied local rental base rather than one commuter dormitory.

Essex's student and HMO market
Essex has a genuine student market, and it maps neatly onto the towns we cover rather than sitting off to one side. The University of Essex has its main campus at Wivenhoe Park in Colchester, plus campuses in Southend and Loughton, so two of the three sit inside towns already on this hub. Anglia Ruskin University runs a Chelmsford campus alongside its Cambridge and Peterborough sites.
For an investor, that concentration matters because student and shared-house demand tends to lift the achievable rent in the postcodes near a campus. Colchester carries the clearest overlap: it is a university town with a 5.4% top gross yield and asking prices around £367,298, so the student base and the wider rental market pull in the same direction. Chelmsford's ARU campus adds a layer of rental demand to a town where the headline yield is lower at 4.5%, which is one reason the achievable rent there holds up despite the higher purchase price. Before pursuing a house in multiple occupation in any of these towns, check the relevant council's licensing rules, as HMO requirements vary between Essex authorities.
What an Essex buy-to-let deposit costs
The property type you buy moves the deposit far more than the town does. The table below applies a 30% deposit to the county average sold price for each property type, on the latest Land Registry figures.
| Property type | Average Essex price | 30% deposit |
|---|---|---|
| Detached | £576,896 | £173,069 |
| Semi-detached | £375,466 | £112,640 |
| Terraced | £307,138 | £92,141 |
| Flat | £187,624 | £56,287 |
On the county average sold price of £357,476, a 30% deposit works out at roughly £107,243. The spread across property types is wide: the deposit on an average Essex flat is about £56,287, while the deposit on an average detached house is £173,069, a difference of nearly £117,000 before you have paid any stamp duty. That is the single biggest lever on how much cash an Essex purchase ties up, and it is worth settling on the property type before you settle on the town.
How to invest in Essex
Stamp duty is the first cost most Essex investors underestimate, because the surcharge on additional property stacks on top of the standard bands. On a purchase around the county average, the buy-to-let surcharge alone runs into five figures. Our stamp duty calculator works out the full bill for a second or subsequent property so you can build it into the numbers before you offer.
Once the budget is set, the next step is finding the right deal. We connect investors with a sourcing service that finds investment property across the UK, including off-market and hands-off options that never reach the portals. If you want to see current stock, our buy-to-let deals page lists what is available now, and for discounted stock our below-market-value listings are worth a look. For the wider picture on where the county sits nationally, our guide to the best buy-to-let areas in the UK puts the Essex yields in context.
Essex also sits next to two markets our readers often weigh up alongside it. Hertfordshire runs along the M11 and the Stansted corridor to the north-west and shares much of the same commuter demand. Across the Thames to the south, Kent will be more directly connected to Essex once the Lower Thames Crossing opens. And several outer-east London boroughs, including Romford and Barking, were historically part of Essex and still draw the same commuter-belt renters.
Frequently Asked Questions
Is Essex a good place to invest in buy-to-let?
Essex averages a £357,476 sold price and a 6.1% top gross yield in Basildon, so it sits at the higher-price, London-adjacent end of the market rather than the cheap-and-high-yield end. The county runs about 23% above the England average on price. What Essex offers is a wide spread: commuter towns in the west on stronger yields, coastal towns in the east on lower purchase prices, and everything backed by London rental demand.
Where are the best buy-to-let areas in Essex?
It depends what you are optimising for. On yield, Basildon leads at 6.1% and Harlow follows at 5.6%, both in the western commuter belt. On lower purchase prices, Colchester (£367,298) and Southend-on-Sea (£375,500) are the cheapest of the five towns we cover. Chelmsford is the most expensive at £538,633 with a 4.5% yield. The single highest-yielding postcode is SS14 in Basildon at 6.1%.
What is the average property price in Essex?
The average sold price in Essex is £357,476 as of March 2026, on HM Land Registry figures. By property type, flats average £187,624, terraced houses £307,138, semi-detached £375,466 and detached £576,896. The county peaked at £369,886 in November 2022 and today sits about 3% below that.
What rental yields can you get in Essex?
Top gross yields across the five towns we cover run from 6.1% in Basildon down to 4.5% in Chelmsford. The higher yields cluster in the western commuter towns, Basildon and Harlow, where rents track London affordability while asking prices stay reachable. Coastal Southend sits at 4.9% and university-town Colchester at 5.4%.
Is Essex good for London commuters?
Much of Essex is inside the London commuter belt, which is what underpins its rental demand. Basildon and Southend run into Fenchurch Street on the c2c line, Chelmsford and Harlow into Liverpool Street on Greater Anglia, and Brentwood and Shenfield are on the Elizabeth line. The commuter towns in the west of the county carry both the strong rental demand and the higher yields.
How much deposit do you need to buy in Essex?
A 30% deposit on the county average sold price of £357,476 is about £107,243 before stamp duty and fees. The property type changes that far more than the town: a 30% deposit on an average Essex flat is roughly £56,287, against £173,069 on an average detached house. Buy-to-let purchases also carry a stamp duty surcharge on top, which our calculator works out in full.
Ready to buy property?
Access off-market investment properties with an average 8%+ annual gross yield (beating the UK's typical 3-5%).
Get property alerts