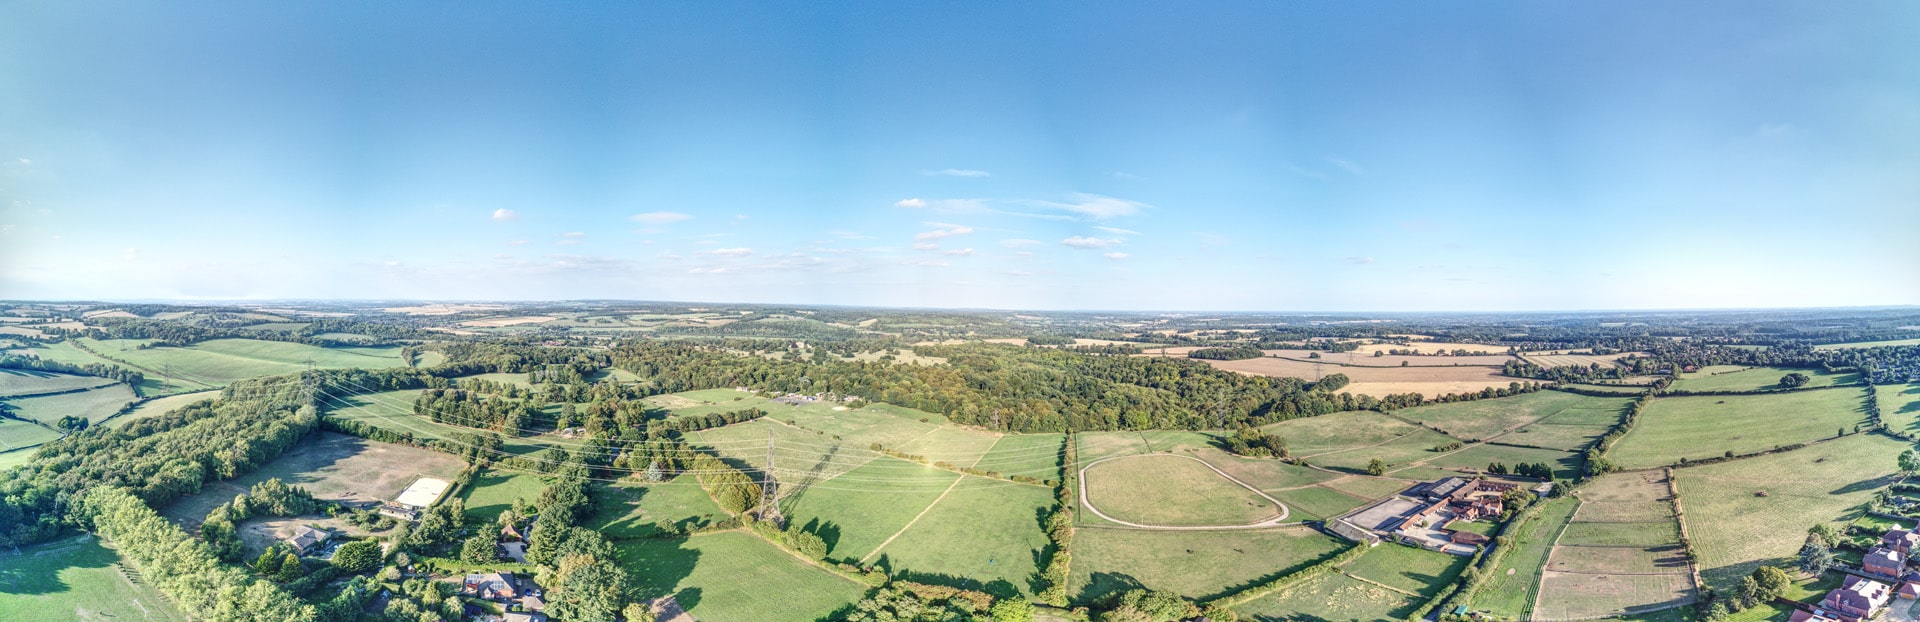
Basildon is a new town in Essex, in the East of England. Average sold prices across the Basildon district sit at £355,621 on the HM Land Registry House Price Index, 22.7% above the England average of £289,946 but only 5.5% above the East of England average of £337,182. That is the headline of a district that pulls in two directions: the original new-town postcodes around the town centre, where prices start in the low £300,000s, and the Billericay villages to the north, where they pass £600,000.
The split matters for an investor. The buy-to-let income sits firmly in the new-town side. SS14, the town centre, leads the district on yield at 6.1% off a £319,099 entry, while the Billericay postcodes are owner-occupier territory that earns its keep on capital value rather than rent. Basildon is a genuine London commuter market, roughly 25 miles east of the City with direct c2c trains to Fenchurch Street, and the affordability gap to inner Essex is what keeps tenant demand topped up.
This guide covers the Basildon local authority district (ONS code E07000066) in the East of England, across eight postcodes: CM11, CM12, SS11, SS12, SS13, SS14, SS15, and SS16. That stretches from Billericay and Wickford in the north down through the town centre, Pitsea, Laindon, and Langdon Hills. The wider Essex buy-to-let region also takes in coastal Southend-on-Sea and the county city of Chelmsford.
Article updated: July 2026

Why Invest in Basildon?
Basildon's population grew 7.49% between the 2011 and 2021 censuses, from 174,497 to 187,571 residents. That is faster than the England and Wales average of 6.3%, and it has happened in a district built for growth. Basildon began life as a post-war new town, planned to take London's overspill, and it still does the same job: it absorbs people priced out of the capital and the more expensive parts of Essex.
The employment base is more industrial than most of the commuter belt. The largest sectors by employee jobs are wholesale and retail (15.7%), human health and social work (14.6%), administrative and support services (11.2%), manufacturing (9.0%), and construction (7.9%). Manufacturing is the unusual one for the South East: names such as Ford, Leonardo, and the area's logistics and distribution employers give Basildon a working base that does not depend on the City alone. The local employment rate of 81.5% runs ahead of both the East of England at 78.4% and Great Britain at 75.5%.
Median gross annual earnings in Basildon are £41,907, which sits just above the East of England median, with the local gross weekly figure of £805.90 a touch above the region's £804.90 and well clear of the Great Britain £766.60. A good share of those earnings are London wages carried home on the c2c line, which is part of why local rents hold up against prices that are lower than inner Essex. Jobs and commuter incomes together are what feed the rental demand the buy-to-let postcodes run on.
Basildon Economic Summary
- Population: 187,571 (2021 Census). Growth of 7.49% from 2011.
- Median annual salary: £41,907 (local), £41,855 (East of England), £39,863 (Great Britain)
- Employment rate: 81.5% (local), 78.4% (East of England), 75.5% (Great Britain)
- Key employment sectors: Wholesale and retail, health and social work, administrative and support services, manufacturing, construction
Source: ONS Census 2021, Nomis Labour Market Profile (ASHE 2025, Employment Oct 2024-Sep 2025)
Regeneration and Investment in Basildon
Basildon's town centre has spent the last two years steadying after the collapse of two key partners, and by 2026 the leisure anchor is open and the stalled Laindon housing scheme is back under construction. The money going in is concentrated on the town centre and Laindon rather than spread across the district.
- Laindon Place (Under construction, 205 homes): Sanctuary, one of the UK's largest housing associations, restarted the long-stalled regeneration of Laindon town centre after taking over Swan Housing in February 2023. The scheme delivers more than 205 affordable homes alongside a new Lidl and around 15 local shops, with the supermarket due to complete in Spring 2026. It puts new residential stock and a retail anchor into a part of SS15 that had sat empty for years. Updates at Sanctuary Laindon Centre Regeneration.
- East Square, Town Centre (Completed): The town centre's new leisure quarter opened when Vue launched a ten-screen cinema in East Square on 25 July 2024, alongside Nando's, Kaspa's, and other restaurant units. After the previous operator went into administration, the opening removed the half-finished-square risk that had hung over the surrounding SS14 town centre flats and restored an evening economy in the heart of Basildon. Updates at Yellow Advertiser.
- Centre for Digital Technologies (Completed, £9 million): South Essex College's £9 million digital campus opened in the town centre in October 2021, delivered with Basildon Council and Homes England, with space for up to 500 students studying IT, games design, and animation. A standing population of young adults studying beside Basildon station supports demand for the shared and smaller lettings that the town centre postcodes specialise in. Updates at South Essex College.

Source: Office for National Statistics - Population for Basildon
Basildon Property Market Analysis
Average property prices across the Basildon district have risen 595.8% since January 1995, from £51,107 to £355,621. The sections below walk through that journey cycle by cycle, then drill into current postcode-level data for sold prices, price per square foot, asking prices, growth trends, transaction volumes, and selling times.
When was the last house price crash in Basildon?
All sold prices here are recorded at Basildon local authority level by HM Land Registry, which tracks the average from January 1995 to March 2026, covering 31 years of market cycles.
The 1995 to 2007 boom: Basildon started at £51,107 in January 1995. By December 2000 the average had reached £86,508, and the run accelerated through the early 2000s to £174,237 by December 2005. As London's affordability gap widened, buyers pushed further out along the c2c line, and prices climbed to £200,767 by December 2007, almost quadrupling across the period.
2008 to 2009, the financial crisis: Prices peaked at £203,216 in February 2008, then fell to a trough of £166,899 by April 2009, a decline of 17.9% over 14 months. The worst year-on-year reading was -16.4% in March 2009. Basildon's correction ran a little deeper than the England fall of around 16%, in line with commuter markets that had stretched hardest on London-priced-out demand during the boom.
The 2010 to 2013 stagnation: Prices bounced off the trough but then drifted. The average stood at £180,190 in December 2010, eased to £185,625 by December 2012, and reached £196,951 by December 2013. Basildon spent close to four years below its pre-crash peak as mortgage lending stayed tight and buyers held back.
Recovery, 2014 to 2016: Growth returned with force. The average first passed the February 2008 peak in May 2014 at £206,337, a recovery that took just over six years. From there prices ran from £221,544 in December 2014 to £287,554 by December 2016 as the London affordability squeeze sent first-time buyers and investors hunting value in sub-40-minute commuter towns.
The 2017 to 2019 plateau: The surge gave way to a flat patch. Prices moved sideways from £297,905 in December 2017 to £300,750 in December 2018 and £300,146 in December 2019, as the stamp duty surcharge on second homes and Brexit uncertainty cooled demand.
2020 to 2022, the pandemic surge: The stamp duty holiday and a rush for space reignited the market. Prices climbed from £304,017 in June 2020 to £333,002 by December 2021, then to £365,492 by December 2022. The district's all-time high came in November 2022 at £367,909.
The 2023 rate shock: Higher mortgage rates pulled the market back. Prices eased to £344,020 by June 2023 before steadying at £358,459 by December 2023.
2024 to present: The market then traded close to its peak. Prices reached £354,205 by December 2024 and a near-matching secondary high of £367,237 in September 2025, before easing 3.2% to £355,621 by the latest reading in March 2026. The current average is 75.0% above the February 2008 pre-crash peak.
Long-term growth summary:
- 5 years (March 2021 to March 2026): 12.0% growth (£317,400 to £355,621)
- 10 years (March 2016 to March 2026): 36.6% growth (£260,287 to £355,621)
- 15 years (March 2011 to March 2026): 94.0% growth (£183,270 to £355,621)
- 20 years (March 2006 to March 2026): 104.9% growth (£173,525 to £355,621)
- 30 years (January 1995 to March 2026): 595.8% growth (£51,107 to £355,621)
Basildon's 17.9% crash was a touch deeper than the national fall, and the recovery to its pre-crash peak took just over six years, longer than the strongest southern markets but quicker than much of the North. The 30-year return of 595.8% reflects the long pull of London's affordability gap on a town built to absorb it. An investor who bought at the exact peak in February 2008 would be sitting on gains of 75.0% on the Land Registry average today, a reminder that the cycle matters far more for timing than for the long hold.
- All property types
- Detached
- Semi-detached
- Terraced
- Flats
- All property types
- Detached
- Semi-detached
- Terraced
- Flats
Sold House Prices in Basildon
Houses in Basildon carry a clear premium over the England average, but flats sit 14.6% below it. That split is the heart of the buy-to-let case here: family homes are priced for commuter demand, while the flat is the affordable way in. The table compares Basildon's average sold price by type against England.
| Property Type | Basildon Average | England Average | Difference |
|---|---|---|---|
| Detached houses | £656,874 | £470,492 | +39.6% |
| Semi-detached houses | £414,905 | £288,185 | +44.0% |
| Terraced houses | £308,997 | £243,788 | +26.7% |
| Flats and maisonettes | £183,149 | £214,563 | -14.6% |
| All property types | £355,621 | £289,946 | +22.7% |
Detached houses average £656,874, a 39.6% premium on England. These concentrate in the Billericay postcodes to the north, where larger plots and a village setting within commuting range of London push values well past anything in the new-town core.
Semi-detached houses carry the biggest premium of all at £414,905, 44.0% above England. The semi is the staple family home across Basildon's estates, and steady demand from owner-occupiers who want a house with a garden inside the c2c catchment keeps it bid up.
Terraced houses average £308,997, a 26.7% premium. Much of this is the original post-war terraced stock in the town centre and Pitsea, the kind of property that suits a standard single let and trades closest to the district average.
Flats and maisonettes are the outlier at £183,149, 14.6% below the England average. For an investor that discount is the opening: town-centre flats in SS14, near the station and the regenerated East Square, buy in cheaper than almost anywhere else in commutable Essex, which is why the highest yields cluster there rather than in the houses.
Price Per Square Foot in Basildon
Sold price per square foot in Basildon runs from £337 in SS13 to £504 in CM12, a £167 spread across the district. Price per square foot strips out the size of the home and shows what a buyer pays for the bricks-and-mortar in each area, which is the cleaner way to compare value when one postcode is full of flats and another full of detached houses. The table ranks the eight postcodes from cheapest to dearest.
| Rank | Area | Price Per Sq Ft |
|---|---|---|
| 1 | SS13 (Pitsea, Felmores) | £337 |
| 2 | SS14 (Town Centre) | £355 |
| 3 | SS15 (Laindon) | £380 |
| 4 | SS16 (Langdon Hills, Vange) | £384 |
| 5 | SS11 (Wickford) | £416 |
| 6 | SS12 (Wickford North) | £443 |
| 7 | CM11 (Billericay, Great Burstead) | £451 |
| 8 | CM12 (Billericay, Little Burstead) | £504 |
SS13 and SS14 are the cheapest ground in Basildon at £337 and £355 per square foot, the new-town postcodes around Pitsea and the town centre. This is the same stock that carries the lowest asking prices and the highest yields, so the value an investor pays for space lines up with the value they get back in rent.
The two Billericay postcodes top the table at £451 and £504. The premium is for the village setting and the larger, newer detached homes that dominate CM11 and CM12, and it sits alongside the lowest yields in the district. In Billericay the higher price per square foot buys location and house size rather than rental return.
For Sale Asking Prices in Basildon
Asking prices in Basildon run from £314,659 in SS13 to £609,383 in CM11, a £294,724 gap across one district. That is a wide spread for a single local authority, and it maps almost exactly onto the new-town versus Billericay divide. The mean asking price across all eight postcodes is £417,382.
| Rank | Area | Asking Price |
|---|---|---|
| 1 | SS13 (Pitsea, Felmores) | £314,659 |
| 2 | SS14 (Town Centre) | £319,099 |
| 3 | SS15 (Laindon) | £348,503 |
| 4 | SS12 (Wickford North) | £372,974 |
| 5 | SS16 (Langdon Hills, Vange) | £389,393 |
| 6 | SS11 (Wickford) | £425,071 |
| 7 | CM12 (Billericay, Little Burstead) | £559,977 |
| 8 | CM11 (Billericay, Great Burstead) | £609,383 |
SS13 and SS14 are the only two postcodes below the district's £355,621 Land Registry sold-price average, at £314,659 and £319,099. For an investor with a fixed budget they offer the most property for the money and the lowest barrier to entry in Basildon, and they are where the rental yields are strongest.
At the top, CM11 and CM12 ask £609,383 and £559,977, roughly £250,000 above the cheapest postcode. Billericay reads as a separate market: village homes bought by owner-occupiers and London commuters who want space, not the smaller units that drive rental income. SS11 and SS12 around Wickford, and SS15 and SS16 to the south, fill the middle of the range.
House Price Growth in Basildon
SS14 leads Basildon on five-year growth at 17.9%, while SS16 trails at 3.7%, and most postcodes show a softer one and three-year picture beneath the five-year figure. Reading the three windows together shows where the recent rate-shock correction has bitten and where the longer pull of the town centre regeneration still shows up. The table ranks the postcodes by five-year growth.
| Area | 1 Year | 3 Years | 5 Years |
|---|---|---|---|
| SS14 (Town Centre) | 0.7% | -4.0% | 17.9% |
| SS12 (Wickford North) | 2.3% | 2.8% | 11.2% |
| CM11 (Billericay, Great Burstead) | 0.9% | -0.6% | 11.1% |
| SS15 (Laindon) | -0.6% | -0.3% | 10.7% |
| SS11 (Wickford) | 4.8% | -1.0% | 9.6% |
| SS13 (Pitsea, Felmores) | -3.4% | -6.2% | 9.4% |
| CM12 (Billericay, Little Burstead) | 1.0% | 6.3% | 4.7% |
| SS16 (Langdon Hills, Vange) | -3.7% | -7.5% | 3.7% |
SS14's 17.9% over five years is the strongest in the district and sits well clear of the rest, the town-centre postcode where the Vue cinema opening and the East Square works have run alongside rising values. Its negative three-year figure of -4.0% shows the post-pandemic cooling that touched most of Basildon, but the five-year line still leads.
SS12 is the steadiest reading, the only postcode positive across all three windows at 2.3%, 2.8%, and 11.2%, covering the northern side of Wickford. At the other end, SS16 around Langdon Hills and Vange is down 3.7% over one year and 7.5% over three, with the smallest five-year gain at 3.7%, the postcode where the rate-shock correction has shown up hardest.
Monthly Property Sales in Basildon
Monthly sales across Basildon run from 14 in CM11 to 33 in SS16, with turnover from 8% to 19% of stock a year. The number of sales a month is a read on how easily you can buy or sell in a postcode, and turnover shows what share of the housing stock changes hands across a year. The table ranks the postcodes from busiest to quietest.
| Area | Sales Per Month | Turnover | Asking Price |
|---|---|---|---|
| SS16 (Langdon Hills, Vange) | 33 | 15% | £389,393 |
| SS15 (Laindon) | 28 | 13% | £348,503 |
| SS14 (Town Centre) | 25 | 19% | £319,099 |
| SS12 (Wickford North) | 21 | 16% | £372,974 |
| CM12 (Billericay, Little Burstead) | 18 | 11% | £559,977 |
| SS11 (Wickford) | 17 | 14% | £425,071 |
| SS13 (Pitsea, Felmores) | 17 | 13% | £314,659 |
| CM11 (Billericay, Great Burstead) | 14 | 8% | £609,383 |
SS16, SS15, and SS14 are the most active markets, with 33, 28, and 25 sales a month between the southern new-town postcodes and the town centre. SS14 records the highest turnover at 19%, so close to one home in five changes hands a year there, which for an investor means a steady stream of comparable sales when buying and a readier exit when selling.
CM11 is the quietest at 14 sales a month and an 8% turnover, the high-value Billericay postcode where larger homes are held longer and sell less often. CM12 and the two Wickford postcodes sit in the middle, busier than CM11 but well short of the new-town core.
How Long Properties Take to Sell in Basildon
Selling speed splits Basildon north from south: SS12 around Wickford clears fastest at about 179 days, while CM11 in Billericay is slowest at roughly 380 days. Days on market is the typical time a home is up for sale before it sells, and the months of unsold stock shows how much for-sale supply is sitting there at the current rate of sales. The table ranks the postcodes from quickest to slowest.
| Area | Avg Days to Sell | Months of Unsold Stock | Market |
|---|---|---|---|
| SS12 (Wickford North) | 179 | 5.9 | Seller's market |
| SS14 (Town Centre) | 190 | 6.3 | Balanced market |
| SS16 (Langdon Hills, Vange) | 203 | 6.7 | Balanced market |
| SS11 (Wickford) | 234 | 7.7 | Balanced market |
| SS13 (Pitsea, Felmores) | 234 | 7.7 | Balanced market |
| SS15 (Laindon) | 234 | 7.7 | Balanced market |
| CM12 (Billericay, Little Burstead) | 277 | 9.1 | Balanced market |
| CM11 (Billericay, Great Burstead) | 380 | 12.5 | Buyer's market |
Selling time is the cost that hides behind a yield figure, and Basildon's two ends could not be further apart on it. SS12's 5.9 months of unsold stock means a far quicker exit than CM11's 12.5 months, where a high-value Billericay home can sit on the market for a year. The new-town and Wickford postcodes all clear inside about eight months, while the two Billericay postcodes are the slowest in the district, a reminder that the premium end of Basildon is harder to move when the time comes to sell.
What Type of Property Can You Buy in Basildon?
The housing mix flips across the district: detached homes make up 65.3% of stock in CM11, while terraces and flats together account for 73.0% in SS14. The mix shapes which strategies fit each postcode. The figures below are drawn from 2021 Census records for each postcode.
| Area | Detached | Semi-detached | Terraced | Flats |
|---|---|---|---|---|
| CM11 (Billericay, Great Burstead) | 65.3% | 22.5% | 5.6% | 4.0% |
| CM12 (Billericay, Little Burstead) | 57.9% | 27.1% | 9.0% | 5.6% |
| SS11 (Wickford) | 47.0% | 28.0% | 5.9% | 4.4% |
| SS12 (Wickford North) | 50.8% | 30.8% | 6.2% | 5.7% |
| SS13 (Pitsea, Felmores) | 30.8% | 26.1% | 24.3% | 14.9% |
| SS14 (Town Centre) | 5.3% | 21.7% | 44.2% | 28.8% |
| SS15 (Laindon) | 25.5% | 27.4% | 26.0% | 21.0% |
| SS16 (Langdon Hills, Vange) | 38.9% | 17.3% | 25.7% | 17.7% |
SS14 holds the smaller-unit stock that usually drives buy-to-let, with terraces at 44.2% and flats at 28.8%, and almost no detached housing at 5.3%. That lines up with the town centre carrying the lowest asking prices and the highest yields in Basildon. The terraces and town-centre flats suit single lets and sharers close to the station, while SS13 and SS15 carry the next-deepest terrace and flat shares.
The Billericay and Wickford postcodes sit at the other end. CM11 is 65.3% detached with just 4.0% flats, and CM12, SS11, and SS12 are all dominated by detached and semi-detached houses. This is owner-occupier family stock that matches the premium asking prices and the lower yields, rather than the smaller units that produce rental income.
Flats combine purpose-built and converted units. A small share of mobile and temporary dwellings is not shown, so rows may not total 100%.

Basildon Rental Market Analysis
Monthly rents in Basildon run from £1,358 in SS16 to £1,649 in SS15, with gross rental yields from 3.1% to 6.1% across the postcodes that carry rental data. For investors asking is buy to let a good investment in Basildon, the sections below break down rents, yields, and tenant affordability postcode by postcode. The income return is concentrated in the new-town postcodes, where lower prices meet commuter-level rents, so if you are looking at how to start a property business in the East of England, browse current buy-to-let property for sale across the region.
Average Rent & Gross Rental Yields in Basildon
Gross rental yields in Basildon range from 3.1% in CM12 to 6.1% in SS14. The cheaper new-town postcodes deliver the highest yields, while the premium Billericay end sits lowest, because the rent does not stretch as far against a £560,000 price as it does against a £319,000 one. CM11 and SS11 have too few homes advertised to let to read a reliable rent, so they are shown as not enough data. The table is ranked by yield.
| Area | Average Monthly Rent | Asking Price | Gross Yield |
|---|---|---|---|
| SS14 (Town Centre) | £1,612 | £319,099 | 6.1% |
| SS13 (Pitsea, Felmores) | £1,575 | £314,659 | 6.0% |
| SS15 (Laindon) | £1,649 | £348,503 | 5.7% |
| SS12 (Wickford North) | £1,379 | £372,974 | 4.4% |
| SS16 (Langdon Hills, Vange) | £1,358 | £389,393 | 4.2% |
| CM12 (Billericay, Little Burstead) | £1,432 | £559,977 | 3.1% |
| CM11 (Billericay, Great Burstead) | Not enough data | £609,383 | Not enough data |
| SS11 (Wickford) | Not enough data | £425,071 | Not enough data |
SS14 and SS13 lead at 6.1% and 6.0%, the town centre and Pitsea, where rents of £1,612 and £1,575 land on the two cheapest asking prices in the district. SS14 pairs the top yield with the deepest pool of flats and terraces, the stock that produces that rent. SS15 at 5.7% charges the highest rent in Basildon at £1,649, off a slightly higher £348,503 price.
At the other end, CM12 at 3.1% shows what the Billericay premium does to a yield: a £1,432 rent against a £559,977 price simply does not return as much. SS12 and SS16 sit in the 4% band, where Wickford and Langdon Hills prices outweigh their rents. The pattern across the district is consistent, the cheaper the postcode the higher the yield.
Gross Rental Yield by Postcode
Is Basildon Rent High?
Monthly rents in Basildon consume between 38.9% and 47.2% of the local median gross monthly salary. The widely cited threshold for rent affordability is 30% of gross income, and every postcode with rental data sits above it, which is typical of a market within 40 minutes of London. A good share of Basildon tenants earn London wages rather than the local median, which is part of why rents hold above the guideline without stretching the people paying them.
The median gross weekly salary in Basildon is £805.90, which equates to £3,492 per month or £41,907 per year. This is just above the East of England median of £804.90 per week and clear of the Great Britain median of £766.60 per week. Data from the Nomis Labour Market Profile (ASHE 2025).
| Rank | Area | Rent as % of Income |
|---|---|---|
| 1 | SS15 (Laindon) | 47.2% |
| 2 | SS14 (Town Centre) | 46.2% |
| 3 | SS13 (Pitsea, Felmores) | 45.1% |
| 4 | CM12 (Billericay, Little Burstead) | 41.0% |
| 5 | SS12 (Wickford North) | 39.5% |
| 6 | SS16 (Langdon Hills, Vange) | 38.9% |
| - | CM11 (Billericay, Great Burstead) | Not enough data |
| - | SS11 (Wickford) | Not enough data |
SS15 tops the table at 47.2%, where the highest rent in the district meets the median local wage. SS14 and SS13 follow close behind, the two highest-yielding postcodes, where strong rents on cheaper homes still take a large slice of a single local income. For a landlord, the figure to hold in mind is that these tenants are often two-income households or London earners, so the affordability runs better than the headline percentage against one median salary suggests.
SS16 is the most accessible for a single local earner at 38.9%, the lowest rent in Basildon against that median wage. Lower rent burden tends to mean steadier tenancies and fewer arrears, which for the landlord is the quieter side of the trade against SS16's lower yield.
How Big Is Basildon's Private Rented Sector?
The private rented sector is fairly even across Basildon, from 16.1% of households in SS12 down to 9.0% in CM12, a narrower spread than the price and yield tables show. The share of homes already rented privately is a guide to the size of the established tenant pool and how active the local lettings market is. The table shows household tenure by postcode, ranked by the private rented share.
| Area | Owned Outright | Owned with Mortgage | Private Rented | Social Rented |
|---|---|---|---|---|
| SS12 (Wickford North) | 45.3% | 33.1% | 16.1% | 4.3% |
| SS15 (Laindon) | 27.9% | 40.0% | 14.8% | 16.4% |
| SS13 (Pitsea, Felmores) | 33.6% | 30.9% | 13.4% | 20.2% |
| SS14 (Town Centre) | 16.8% | 32.7% | 12.9% | 35.5% |
| SS16 (Langdon Hills, Vange) | 31.7% | 34.6% | 12.7% | 19.0% |
| SS11 (Wickford) | 48.5% | 32.7% | 11.8% | 5.7% |
| CM11 (Billericay, Great Burstead) | 47.8% | 37.3% | 11.8% | 3.0% |
| CM12 (Billericay, Little Burstead) | 49.0% | 37.3% | 9.0% | 4.5% |
SS12 around the north of Wickford has the largest private rented share at 16.1%, with SS15 and SS13 close behind in the mid-teens. The lettings market is spread across the district rather than concentrated in one postcode, so the established tenant pool sits roughly where the new-town and Wickford housing is rather than tracking the yield table.
SS14 is the one to read carefully. Its private rented share is mid-pack at 12.9%, but it has by far the most social rented housing in Basildon at 35.5% and the lowest outright ownership at 16.8%, a legacy of the town centre's new-town estates. So while SS14 leads on yield, its renter base leans more towards social tenancies than private lets. At the other end, the Billericay postcodes pair the highest outright ownership in the district, near half of all homes, with the thinnest private rented sectors.
Local Housing Allowance Rates in Basildon
All eight Basildon postcodes fall within the South West Essex Broad Rental Market Area, where Local Housing Allowance runs from £109.62 a week for a shared room to £345.21 a week for a four-bedroom home. Local Housing Allowance sets the maximum housing support a tenant on benefits can receive, so it acts as a rent floor for landlords letting to that part of the market. The rates below apply across the whole of Basildon. To check the current rate for a specific address, you can use the government's official Local Housing Allowance calculator.
| Property Size | Weekly LHA Rate | Monthly Equivalent |
|---|---|---|
| Shared accommodation | £109.62 | £475 |
| 1 bedroom | £178.36 | £773 |
| 2 bedrooms | £218.63 | £947 |
| 3 bedrooms | £276.16 | £1,197 |
| 4 bedrooms | £345.21 | £1,496 |
The two-bedroom LHA rate of £218.63 a week works out at about £947 a month, well below the £1,358 to £1,649 open-market rents recorded across Basildon. A benefit-backed tenancy at the LHA rate therefore sits some way under the local market, and the homes that fit within these rates are concentrated in the cheaper new-town postcodes, SS13 and SS14, where both asking prices and rents are lowest. The rates are identical in every Basildon postcode because they are set across the whole South West Essex market area.
Buy-to-Let Considerations
Are House Prices High in Basildon? Price-to-Earnings Ratios
Purchasing a property in Basildon requires between 7.5 and 14.5 times the median annual salary. This is based on the Nomis Labour Market Profile for Basildon showing the median gross annual income for Basildon residents is £41,907.
The national benchmark for price-to-earnings is 7.3x (England's average sold price of £289,946 divided by the Great Britain median annual salary of £39,863). Every Basildon postcode sits above that line, which is the commuter-belt reality: a market 40 minutes from London prices in access that local wages alone do not cover. The table ranks the postcodes from most to least affordable against local earnings.
| Rank | Area | Price-to-Earnings Ratio |
|---|---|---|
| 1 | SS13 (Pitsea, Felmores) | 7.5x |
| 2 | SS14 (Town Centre) | 7.6x |
| 3 | SS15 (Laindon) | 8.3x |
| 4 | SS12 (Wickford North) | 8.9x |
| 5 | SS16 (Langdon Hills, Vange) | 9.3x |
| 6 | SS11 (Wickford) | 10.1x |
| 7 | CM12 (Billericay, Little Burstead) | 13.4x |
| 8 | CM11 (Billericay, Great Burstead) | 14.5x |
SS13 and SS14 are the closest to the national mark at 7.5x and 7.6x, the cheapest entry points in Basildon and the same postcodes that lead on yield. At a touch over seven times local earnings they remain within reach of local first-time buyers, which keeps a mix of owner-occupiers and tenants in the market rather than tipping it one way.
CM11 at 14.5x sits at the far end. At more than fourteen times the local median salary, Billericay is firmly priced for buyers bringing London equity or dual incomes, not for the local wage. For an investor, that ratio is the same signal as the 3% yields nearby: the value here is in the capital, not the rent.
Deposit Requirements in Basildon
A 30% deposit on a buy-to-let property in Basildon ranges from £94,398 in SS13 to £182,815 in CM11. The gap between the cheapest and most expensive deposit is £88,417, almost a second deposit in the new-town postcodes. For investors comparing Basildon with the rest of the commuter belt, the new-town deposits undercut most of inner Essex while the Billericay figures sit alongside the priciest parts of the county. The table ranks from cheapest to dearest.
Beyond the deposit, the stamp duty land tax calculator and other buy to let expenses affect the total capital required.
| Rank | Area | 30% Deposit Required |
|---|---|---|
| 1 | SS13 (Pitsea, Felmores) | £94,398 |
| 2 | SS14 (Town Centre) | £95,730 |
| 3 | SS15 (Laindon) | £104,551 |
| 4 | SS12 (Wickford North) | £111,892 |
| 5 | SS16 (Langdon Hills, Vange) | £116,818 |
| 6 | SS11 (Wickford) | £127,521 |
| 7 | CM12 (Billericay, Little Burstead) | £167,993 |
| 8 | CM11 (Billericay, Great Burstead) | £182,815 |
SS13 and SS14 are the cheapest way into Basildon, at £94,398 and £95,730, and they buy the two highest-yielding postcodes in the district. The £1,332 difference between them is small enough that the choice between Pitsea and the town centre comes down to stock and tenant type rather than capital. Buyers looking to come in below asking often work through BMV properties for sale.
Stepping up to the Billericay postcodes roughly doubles the deposit, to £167,993 in CM12 and £182,815 in CM11. That extra capital buys a larger detached home in a village setting rather than a stronger rental return, which is the trade the whole district is built around: pay more in the north for space, or less in the new-town core for yield.
What the Basildon Data Tells Buy-to-Let Investors
In Basildon the income sits in the new-town postcodes, and SS14 leads them. The town centre has the top yield at 6.1% on the second-cheapest entry point for buying an investment property at £319,099. It also posted the strongest five-year growth in the district at 17.9% and the busiest market, with 19% of its homes changing hands a year. A 30% deposit there is £95,730, for a home renting at £1,612 a month, in the postcode where the Vue cinema and East Square works have run alongside rising values, and where terraces and flats make up nearly three-quarters of the stock.
SS13 sits right behind on income at a 6.0% yield and the lowest asking price of all at £314,659, though its one and three-year growth has been negative, so the recent capital story is softer than SS14's. SS15 pairs the highest rent in Basildon, £1,649, with a 5.7% yield off a slightly higher price. Across these three the pattern holds: the cheaper the postcode, the more the rent does for the return.
The Billericay and Wickford postcodes read differently. CM11 and CM12 carry the highest prices and the lowest yields, at 3.1% where rental data exists, with private rented sectors below 12% and the slowest selling times in the district. SS16 around Langdon Hills shows the weakest growth of all at 3.7% over five years and negative readings over one and three. The numbers point any income-led investor towards the SS new-town postcodes and any capital-led buyer towards the north.
Basildon has no selective licensing for private landlords, though larger HMOs still need a licence from Basildon Borough Council. With an 81.5% employment rate, an industrial and logistics base that does not lean on the City alone, and direct trains to Fenchurch Street, it reads as a working commuter market: lower headline prices than inner Essex, with yields that hold up where the stock is right.
How Basildon Compares
Basildon's mean asking price of £417,382 sits in the middle of five Essex and commuter locations compared here, while its top yield of 6.1% is matched only by Romford. The comparison below places Basildon alongside four nearby locations, each with a different investor profile. Mean asking price and mean monthly rent are simple averages across all postcodes with data, and top gross yield is the single highest postcode yield in each location.
| Location | Mean Asking Price | Mean Monthly Rent | Mean Gross Yield | Top Yield (postcode) |
|---|---|---|---|---|
| Ipswich | £314,699 | £1,043 | 4.0% | 5.1% (IP2, IP3) |
| Colchester | £367,298 | £1,299 | 4.2% | 5.4% (CO1, CO2) |
| Southend-on-Sea | £375,500 | £1,313 | 4.2% | 4.9% (SS2) |
| Basildon | £417,382 | £1,501 | 4.3% | 6.1% (SS13, SS14) |
| Chelmsford | £538,633 | £1,529 | 3.4% | 4.5% (CM9) |
Basildon's mean asking price of £417,382 is lifted by the Billericay postcodes, but its top yield of 6.1% beats every location in the table bar Romford and reflects the new-town core rather than the district average. Chelmsford is the priciest here at £538,633 with a lower 4.5% top yield, the county-city premium at work, while Southend-on-Sea on the coast comes in cheaper with a 4.9% top yield.
For investors prioritising the lowest entry, Ipswich at £314,699 is the cheapest in the table, and Colchester adds a university-driven tenant base at a 5.4% top yield. Basildon's pitch is the combination its town-centre postcodes offer: a sub-£320,000 entry with a 6.1% yield inside the c2c commuter belt. For a data-driven comparison across all UK locations, see our best buy-to-let areas guide.
Frequently Asked Questions
Is Basildon a good place to invest in buy-to-let?
It depends which Basildon you mean, because the district splits in two. The new-town postcodes around the town centre and Pitsea offer yields of 6.0% to 6.1% off asking prices in the low £300,000s, which is strong for a market 40 minutes from London Fenchurch Street. The Billericay postcodes to the north work the other way: prices above £550,000 and yields nearer 3%, bought for capital and space rather than rental income.
What underpins the whole district is jobs and commuting. The employment rate is 81.5%, above the regional 78.4% and national 75.5%, the base is more industrial than most of the commuter belt, and a good share of tenants carry London wages home on the c2c line. That combination is what keeps rental demand topped up in the SS postcodes.
What are the best areas in Basildon for property investment?
For income, the new-town postcodes lead. SS14 (Town Centre) tops the district on yield at 6.1% and pairs it with the strongest five-year growth at 17.9%, in the postcode that holds the flats and terraces that suit letting. SS13 (Pitsea, Felmores) sits right behind at a 6.0% yield on the lowest asking price of all, £314,659. SS15 (Laindon) charges the highest rent in Basildon at £1,649 for a 5.7% yield.
The Billericay postcodes, CM11 and CM12, are the premium end at £559,977 to £609,383 with yields nearer 3%, owner-occupier territory where the return is in the capital value. So if income matters most, the SS new-town postcodes lead on yield and price; if you want a higher-value asset in a village setting, the north is where to look.
What are average house prices, rents and yields in Basildon?
The average sold price across the Basildon district is £355,621 on the Land Registry index, 22.7% above the England average of £289,946 as of March 2026, but only 5.5% above the East of England. By type, detached homes average £656,874, semi-detached £414,905, terraced £308,997 and flats £183,149, so the flat is the only type that comes in below the England average.
Asking prices by postcode run from £314,659 in SS13 up to £609,383 in CM11, with a district mean of £417,382. Monthly rents range from £1,358 in SS16 to £1,649 in SS15, and gross yields from 3.1% in CM12 to 6.1% in SS14. Through a buy-to-let lens, the cheapest postcodes are the highest-yielding, and the premium Billericay end is the lowest.
What type of property is most common in Basildon?
It depends entirely on the postcode, and that is the point. In the town centre, SS14, terraces and flats make up nearly three-quarters of the stock, at 44.2% and 28.8%, with detached houses almost absent at 5.3%. That is the smaller-unit stock that drives buy-to-let, and it lines up with SS14 carrying the lowest prices and the highest yield.
The Billericay and Wickford postcodes flip the mix. CM11 is 65.3% detached with just 4.0% flats, and CM12, SS11 and SS12 are all dominated by detached and semi-detached houses. That owner-occupier family stock matches their premium prices and lower yields, so the property type more or less tells you which half of the district you are in.
How do I buy an investment property in Basildon?
Start by deciding whether you are buying for income or for capital, because that points you at a different half of the district. For yield, the new-town postcodes lead: SS14 (Town Centre) at a 6.1% yield and £319,099 entry, or SS13 (Pitsea, Felmores) at 6.0% and the cheapest entry of £314,659. For a higher-value asset, the Billericay postcodes are the premium end. Budget for a 30% deposit, which runs from £94,398 in SS13 to £182,815 in CM11.
Beyond what is listed openly, plenty of experienced investors buy below asking through off-market property sales and below market value property. To see what is available now, browse investment properties or buy-to-let homes for sale.
How does Basildon compare to Chelmsford for buy-to-let?
They sit at opposite ends of the Essex commuter trade. Chelmsford is the county-city premium: a mean asking price of £538,633 against Basildon's £417,382, faster trains to Liverpool Street, and a larger retail and employment base, but a lower top yield at 4.5% against Basildon's 6.1%. Mean rents are close, £1,529 in Chelmsford and £1,501 in Basildon, so the yield gap is driven by price, not rent.
Basildon's pitch is the cheaper entry and the stronger income, especially in the SS new-town postcodes where sub-£320,000 prices meet commuter-level rents. Chelmsford trades that for prestige, faster journeys and a deeper city-centre market. Which fits depends on whether you are buying for cash flow or for a higher-value asset.
Can I find buy-to-let property under £250,000 in Basildon?
Not on average in any postcode now. The cheapest is SS13 (Pitsea, Felmores) at £314,659, so the district as a whole sits above £250,000. The way in below that is by property type rather than postcode: flats and maisonettes across the district average £183,149 on the Land Registry index, well under the £355,621 all-property figure. Town-centre flats in SS14, near the station and East Square, are where sub-£250,000 stock concentrates.
Is there demand for HMOs and shared housing in Basildon?
There is, mostly in the town-centre and Laindon postcodes where the flats and terraces that suit sharing are concentrated. A sample of current room adverts puts a double room with a shared bathroom at around £165 a week in SS14, with most between £144 and £180, and around £161 a week in SS15. Those were the only room types with enough live adverts to read a reliable figure, so ensuite and single-room rents across Basildon are harder to pin down.
The town centre also has a standing population of young adults studying at South Essex College's digital campus, which supports demand for rooms close to transport. HMOs come with more management and tighter regulation than a standard let, so factor that in. For how the numbers work on a shared house, see our complete guide to investing in HMOs.
Ready to buy property?
Access off-market investment properties with an average 8%+ annual gross yield (beating the UK's typical 3-5%).
Get property alerts