Guildford is a town in Surrey, in south-east England. Average sold prices in Guildford sit at £525,805 on the HM Land Registry House Price Index, 81.3% above the England average of £289,946, which puts the borough firmly in the premium tier of the South East. That premium is the first thing an investor has to come to terms with here. Guildford is not a yield play in the way Liverpool or Stoke are. It is a high-value Surrey market where the case rests on wages, demand and durability rather than headline income. The borough's population grew 4.71% between the 2011 and 2021 censuses, from 137,183 to 143,650 residents.
Behind that price tag is a wage base most commuter towns cannot match. The median full-time salary in Guildford is £900.00 a week, against £800.30 across the South East and £752.40 for Great Britain, and 83.2% of working-age residents are in work. Those earnings, plus the University of Surrey and direct trains to London Waterloo, are what hold prices up. For an investor the borough splits in two: the lower-priced postcodes around the town and university (GU1, GU2, GU12) where the yields are workable, and the rural and outer postcodes (GU3, GU5, GU10) priced as owner-occupier country at well over £750,000.
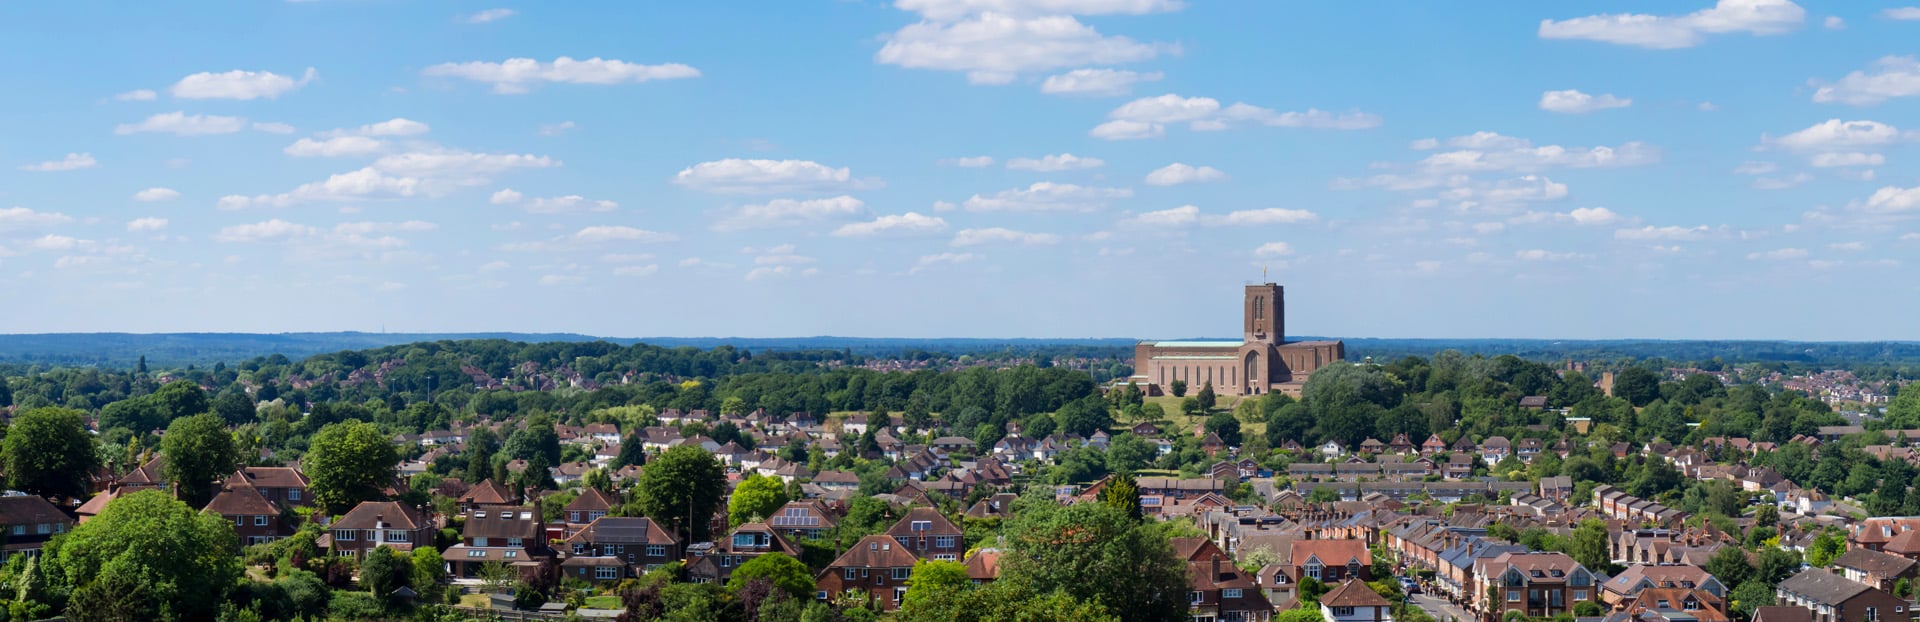
This guide covers the borough of Guildford (ONS code E07000209) across eleven postcodes, from GU1 around the town out to KT24 by the Horsleys. Guildford sits in Surrey, 30 miles south-west of London, with direct trains to Waterloo in under 40 minutes. The wider Surrey buy-to-let area also takes in Woking to the north and the towns along the A3 corridor.
Article updated: July 2026

Why Invest in Guildford?
Guildford's median full-time salary of £46,801 a year is 19.6% above the Great Britain figure of £39,125, and 83.2% of working-age residents are in work, well clear of the national 75.6%. Higher earners can carry higher rents, and that is the foundation under the whole market. Two things set Guildford apart from the average Surrey commuter town. The first is the University of Surrey, with around 17,000 students and a research park on its doorstep that has drawn employers across satellite technology, gaming and life sciences. That puts a steady flow of students, postgraduates and research staff through the GU2 postcode and the town centre year after year.
The second is that Guildford is a working town in its own right, not just a dormitory for London. It carries a deeper base of head offices and professional services firms than most of Surrey, and the £46,801 median salary reflects that. When local people earn well, owner-occupier demand stays firm even when buy-to-let sentiment cools, and that is what stops a premium market like this one from drifting. The trade-off, which the data sections below make plain, is that those same prices push yields down into the 3% to 5% band rather than the 6% and 7% you see further north.
The borough's population rose from 137,183 to 143,650 between the 2011 and 2021 censuses, a 4.71% increase. Most of that came from new-build flats and houses around the town centre and the station rather than sprawl into the green belt that surrounds Guildford on every side. Direct trains reach London Waterloo in under 40 minutes and the A3 links the town to the M25, so it reads to tenants as commuter Surrey with a real town attached.
Guildford Economic Summary
- Population: 143,650 (2021 Census). Growth of 4.71% from 2011.
- Median annual salary: £46,801 (Guildford), £41,616 (South East), £39,125 (Great Britain)
- Employment rate: 83.2% (local), 75.6% (Great Britain)
- Unemployment rate: Suppressed in the official data (low sample size)
- Key employment sectors: Professional and technical services, higher education, technology and research, health, retail
Source: ONS Census 2021, Nomis Labour Market Profile (ASHE 2025, Employment Oct 2024-Sep 2025)
Regeneration and Investment in Guildford
Three town centre schemes within walking distance of Guildford station are set to add more than 1,170 new homes and over £530 million of investment, all on brownfield land close to the rail link. Two are already on site and one has planning consent, so this is delivery rather than a wish list.
- North Street Regeneration (Underway, £300 million plus): St Edward, part of the Berkeley Group, is delivering 485 new homes alongside a medical centre and 2.2 acres of public realm on a town centre site that sat largely vacant for more than 30 years. Highway and bus station works began in September 2025 and the first homes are expected from summer 2026. A scheme of this scale brings hundreds of homes and a wave of new footfall into the centre of town. Updates at North Street Regeneration.
- Guildford Station Quarter (Underway, £150 million): Solum, working with Kier and Network Rail, is rebuilding the station and adding 438 new homes, a new ticket hall, retail and office space. Construction has been running since 2021 and a new multi-storey car park is due to open in summer 2026. The station is the single biggest reason London commuters choose Guildford, so rebuilding it and wrapping homes around it directly serves the tenant base. Updates at Solum Regeneration.
- Guildford Park Road (Planning approved, £86 million): Guildford Borough Council approved this scheme in March 2026, with Wates Residential set to build 248 homes on an underused car park beside the station. Forty per cent of them, 99 homes, will be affordable, split between 65 for affordable rent and 34 for shared ownership. Construction is expected to start in summer 2026 with completion towards the end of 2028. Updates at Guildford Park Road.
Source: Office for National Statistics - Population for Guildford

Guildford Property Market Analysis
Average property prices in Guildford have risen 509.2% since January 1995, from £86,313 to £525,805. The sections below walk through that journey cycle by cycle, then drill into current postcode-level data for sold prices, price per square foot, asking prices, growth, transaction volumes and how long homes take to sell.
When was the last house price crash in Guildford?
All sold prices for Guildford come from the HM Land Registry House Price Index at borough level, tracking the average from January 1995 to March 2026. That covers more than three decades of cycles, and Guildford's path through them is not Chester's or Manchester's. It is a higher-value market that fell hard in 2008 but climbed back faster than most.
The 1995 to 2007 boom: Guildford started at £86,313 in January 1995. By December 2000 it had reached £180,698, more than doubling in six years. Growth ran on through the early 2000s to £267,498 by December 2005, and the market peaked at £333,667 in September 2007.
2008 to 2009, the financial crisis: Prices fell from the September 2007 peak of £333,667 to a trough of £266,148 in February 2009, a drop of 20.2% over 17 months. The worst year-on-year reading was -18.5% in February 2009. That was a deeper fall than Guildford's later corrections, and it reflects how exposed higher-value markets were when mortgage lending seized up.
Recovery, 2010 to 2013: Guildford clawed back quickly. By December 2010 the average stood at £313,535, and by December 2012 it had reached £341,791, already above the September 2007 peak. It took a little over five years to get back to where it had been, faster than the eight-and-a-half years Chester needed. By December 2013 the average was £350,273.
2014 to 2016, the surge: Prices ran from £388,342 in December 2014 to £470,474 by December 2016, a rise of more than a fifth across those two years. This was the period when the gap to the pre-crash peak closed fully and Guildford pushed well into new territory, in line with the strong South East commuter-belt run of those years.
The 2017 to 2019 plateau: Growth stalled. The average drifted from £451,444 in December 2017 to £453,376 in December 2018 and £460,319 in December 2019. After the 2014 to 2016 run, the market spent three years catching its breath.
2020 to 2022, the pandemic run: The stamp duty holiday and the dash for space favoured towns like Guildford with gardens, green belt and a fast train. Prices moved from £462,677 in June 2020 to £484,827 by December 2020, then £501,234 by December 2021 and £529,123 by December 2022.
The 2023 rate shock: Higher mortgage rates cooled the market. The average eased to £508,515 by December 2023, the first full-year fall since the pandemic.
2024 to present: Prices recovered to £524,264 by December 2024 and reached an all-time high of £552,009 in June 2025, before easing to £525,805 by the latest reading in March 2026. So the current figure sits about 4.7% below the June 2025 peak, a gentle softening at the top of the cycle rather than a correction. The current price is 57.6% above the pre-crash high of £333,667.
Long-term growth summary:
- 5 years (March 2021 to March 2026): 9.3% growth (£480,929 to £525,805)
- 10 years (March 2016 to March 2026): 17.7% growth (£446,805 to £525,805)
- 15 years (March 2011 to March 2026): 64.9% growth (£318,779 to £525,805)
- 20 years (March 2006 to March 2026): 92.8% growth (£272,736 to £525,805)
- 30 years (January 1995 to March 2026): 509.2% growth (£86,313 to £525,805)
The 20.2% fall in 2008 was Guildford's sharpest, but the recovery to the pre-crash peak inside about five years shows how quickly demand returned to a market this close to London. The 30-year return of 509.2% is the long-run capital-growth record. An investor who bought at the exact September 2007 peak would now be 57.6% ahead on the Land Registry average, having sat through a 20% drop along the way.
- All property types
- Detached
- Semi-detached
- Terraced
- Flats
- All property types
- Detached
- Semi-detached
- Terraced
- Flats
Sold House Prices in Guildford
The average sold price across all property types in Guildford is £525,805, which is 81.3% above the England average of £289,946 as of March 2026. That premium is not spread evenly across the housing stock. Detached homes carry the largest gap to England, while flats are barely above the national figure. The pattern tells you where the money is: Guildford's value sits in family houses on green-belt-edge plots, not in apartments.
| Property Type | Guildford Average | England Average | Difference |
|---|---|---|---|
| Detached houses | £942,831 | £470,492 | +100.4% |
| Semi-detached houses | £518,065 | £288,185 | +79.8% |
| Terraced houses | £425,272 | £243,788 | +74.4% |
| Flats and maisonettes | £266,633 | £214,563 | +24.3% |
| All property types | £525,805 | £289,946 | +81.3% |
Detached houses at £942,831 carry the widest premium, more than double the England average of £470,492. This is the Surrey green-belt market: large detached homes in GU3, GU5 and GU10 priced for families and downsizers moving out from London. Annual growth of -1.0% shows the top end has cooled with higher mortgage rates, in line with the wider market.
Semi-detached houses at £518,065 sit 79.8% above England's £288,185. This is the mainstream of Guildford's owner-occupier stock and a big share of what changes hands across GU1, GU2 and GU12. With annual growth of -0.2% it has held its value better than any other type over the past year.
Terraced houses at £425,272 are 74.4% above England's £243,788. Terraces are most common in the town and station postcodes, where Victorian and Edwardian rows sit close to the centre, and they are the type that most often works for a smaller buy-to-let purchase. Annual change of -1.4% puts them roughly in line with the wider market.
Flats and maisonettes at £266,633 show much the smallest premium, just 24.3% above England's £214,563. This is the entry point to Guildford, and it is where the rental numbers in the sections below work hardest, particularly the purpose-built stock around GU1 and GU2. Annual change of -5.4% is the weakest of the four types, a reminder that the flat market here moves separately from the houses.
Price Per Square Foot in Guildford
Price per square foot in Guildford runs from £424 in GU12 to £619 in KT24, a £195 spread across the borough. Stripping out the effect of property size gives a cleaner read on location value than the headline asking price. KT24 (East Horsley, West Horsley) and GU5 (Shalford, Bramley) sit at the top, reflecting the village stock and larger plots in the borough's southern and eastern fringes.
| Rank | Area | Price Per Sq Ft |
|---|---|---|
| 1 | GU12 (Ash, Ash Vale) | £424 |
| 2 | GU21 (Woking, Knaphill) | £483 |
| 3 | GU2 (Guildford West, University) | £501 |
| 4 | GU10 (Tongham, Seale) | £513 |
| 5 | GU3 (Normandy, Wood Street Village) | £519 |
| 6 | GU1 (Town Centre, Merrow) | £529 |
| 7 | GU24 (Chobham, Bisley) | £533 |
| 8 | GU4 (Burpham, Chilworth) | £556 |
| 9 | GU23 (Ripley, Send) | £558 |
| 10 | GU5 (Shalford, Bramley) | £580 |
| 11 | KT24 (East Horsley, West Horsley) | £619 |
GU12 at £424 per square foot is the cheapest bricks-and-mortar in the borough, based on 627 transactions analysed. Ash and Ash Vale sit on the western edge towards Aldershot, with more 1960s-onward semi-detached and terraced stock than the period housing closer to Guildford, and the lower rate per square foot follows from that.
KT24 at £619 tops the table, drawn from 150 transactions, with GU5 just behind at £580 from 132 transactions. The Horsleys to the east and the Shalford and Bramley villages to the south hold larger detached homes on bigger plots, and buyers there are paying for setting and space rather than proximity to the station. The 46% gap between GU12 and KT24 maps closely onto the gap between the borough's commuter-edge and its village stock.
For Sale Asking Prices in Guildford
Asking prices in Guildford run from £388,459 in GU12 up to £1,197,554 in KT24, a spread of more than £800,000 across the borough's eleven postcodes. The hierarchy follows the price-per-square-foot picture: commuter-edge postcodes at the bottom, village and green-belt postcodes at the top. The mean asking price across the eleven postcodes is £703,240.
| Rank | Area | Asking Price |
|---|---|---|
| 1 | GU12 (Ash, Ash Vale) | £388,459 |
| 2 | GU21 (Woking, Knaphill) | £436,904 |
| 3 | GU2 (Guildford West, University) | £485,200 |
| 4 | GU1 (Town Centre, Merrow) | £485,243 |
| 5 | GU4 (Burpham, Chilworth) | £684,635 |
| 6 | GU24 (Chobham, Bisley) | £689,424 |
| 7 | GU23 (Ripley, Send) | £735,745 |
| 8 | GU3 (Normandy, Wood Street Village) | £764,733 |
| 9 | GU10 (Tongham, Seale) | £845,334 |
| 10 | GU5 (Shalford, Bramley) | £1,022,406 |
| 11 | KT24 (East Horsley, West Horsley) | £1,197,554 |
GU12 at £388,459 is the only Guildford postcode where the average asking price comes in below £400,000, and it is more than £96,000 cheaper than GU1 and GU2 around the town itself. For an investor working to a fixed budget, GU12 and GU21 are where the entry costs are lowest and the most property comes for the money.
KT24 at £1,197,554 and GU5 at £1,022,406 are the two postcodes above the million mark, with KT24 in East and West Horsley more than three times the price of GU12. The seven postcodes above £680,000, GU4, GU24, GU23, GU3, GU10, GU5 and KT24, are green-belt and village Surrey, owner-occupier territory where rental yields compress sharply. The yield data below confirms the pattern: the cheaper the postcode, the harder the rent works.

House Price Growth in Guildford
Only one Guildford postcode posted positive growth across all three timeframes: GU1 at 7.1% (one-year), 10.1% (three-year) and 3.8% (five-year). Seven of the eleven postcodes are positive over five years, but the spread is wide and several of the higher-priced postcodes have fallen back over one and three years as the top of the market softened.
| Area | 1 Year | 3 Years | 5 Years |
|---|---|---|---|
| GU2 (Guildford West, University) | 0.6% | -2.0% | 9.2% |
| GU5 (Shalford, Bramley) | -0.5% | -3.6% | 9.1% |
| GU12 (Ash, Ash Vale) | 1.5% | -3.6% | 6.7% |
| GU1 (Town Centre, Merrow) | 7.1% | 10.1% | 3.8% |
| KT24 (East Horsley, West Horsley) | 7.6% | -1.9% | 3.1% |
| GU3 (Normandy, Wood Street Village) | -2.3% | -11.5% | 1.6% |
| GU21 (Woking, Knaphill) | -3.1% | -0.4% | 0.6% |
| GU24 (Chobham, Bisley) | -2.5% | -4.5% | -1.8% |
| GU23 (Ripley, Send) | -20.7% | -12.1% | -5.4% |
| GU4 (Burpham, Chilworth) | -3.7% | -9.5% | -6.6% |
| GU10 (Tongham, Seale) | -6.7% | -8.0% | -7.7% |
GU1 is the standout for consistency, up 7.1% over a year, 10.1% over three and 3.8% over five, the only postcode in the black across all three windows. The town centre and Merrow have held up where the outer postcodes have not, helped by the regeneration around the station and a deeper, more liquid market.
GU2 and GU5 lead on five-year growth at 9.2% and 9.1%, though both are slightly negative over the most recent year. GU23 sits at the other end, down 20.7% over a year, but the figure rests on a thin market of around four sales a month and should be read with that in mind rather than as a sign of a wider collapse.
Monthly Property Sales in Guildford
Transaction volumes vary widely across Guildford, from 45 sales a month in GU21 down to just 4 in GU5 and GU23. Turnover, the share of homes changing hands each year, ranges from 18% in GU21 to 3% in GU5. The busier, lower-priced postcodes offer a far easier exit than the thin, high-value village markets.
| Area | Sales Per Month | Turnover | Asking Price |
|---|---|---|---|
| GU21 (Woking, Knaphill) | 45 | 18% | £436,904 |
| GU1 (Town Centre, Merrow) | 32 | 11% | £485,243 |
| GU12 (Ash, Ash Vale) | 30 | 14% | £388,459 |
| GU2 (Guildford West, University) | 20 | 13% | £485,200 |
| GU4 (Burpham, Chilworth) | 16 | 13% | £684,635 |
| GU10 (Tongham, Seale) | 16 | 6% | £845,334 |
| GU24 (Chobham, Bisley) | 12 | 9% | £689,424 |
| GU3 (Normandy, Wood Street Village) | 9 | 10% | £764,733 |
| KT24 (East Horsley, West Horsley) | 8 | 5% | £1,197,554 |
| GU5 (Shalford, Bramley) | 4 | 3% | £1,022,406 |
| GU23 (Ripley, Send) | 4 | 4% | £735,745 |
GU21 leads on both counts, 45 sales a month and 18% turnover, the most liquid market in the borough. Woking and Knaphill carry a deeper pool of mid-priced family stock, so homes change hands more often, which matters to a landlord planning an eventual sale. GU12 is close behind at 30 sales a month and 16% turnover, another sign that the cheaper postcodes move faster.
GU5 and GU23 record just 4 sales a month, with turnover of 3% and 4%. The village postcodes hold expensive, larger homes that sit on the market longer and trade rarely, so an investor in this part of the borough is buying into a market where selling later can take time.
How Long Properties Take to Sell in Guildford
Selling speed splits Guildford sharply, from about 169 days in GU21 to roughly 761 days in GU5 and GU23. Days on market is the typical time a home is up for sale before it sells, and the months of unsold stock shows how much for-sale supply is sitting there at the current rate of sales. The gap between the fastest and slowest postcodes here is wider than in almost any market this guide covers.
| Area | Avg Days to Sell | Months of Unsold Stock | Market |
|---|---|---|---|
| GU21 (Woking, Knaphill) | 169 | 5.6 | Seller's market |
| GU12 (Ash, Ash Vale) | 190 | 6.3 | Balanced market |
| GU2 (Guildford West, University) | 234 | 7.7 | Balanced market |
| GU4 (Burpham, Chilworth) | 234 | 7.7 | Balanced market |
| GU1 (Town Centre, Merrow) | 277 | 9.1 | Balanced market |
| GU3 (Normandy, Wood Street Village) | 304 | 10.0 | Balanced market |
| GU24 (Chobham, Bisley) | 338 | 11.1 | Balanced market |
| GU10 (Tongham, Seale) | 507 | 16.7 | Buyer's market |
| GU5 (Shalford, Bramley) | 761 | 25.0 | Buyer's market |
| GU23 (Ripley, Send) | 761 | 25.0 | Buyer's market |
| KT24 (East Horsley, West Horsley) | Not enough data | Not enough data | Not enough data |
A yield figure says nothing about how fast you can get back out, and in Guildford that matters more than usual. GU21 clears in about 169 days with 5.6 months of unsold stock, while GU5 and GU23 carry around 25 months of supply and homes that sit for roughly two years before selling. An investor drawn to the village postcodes by their long-run growth is buying into a market where the exit is slow and the holding period has to be long enough to ride it out.
What Type of Property Can You Buy in Guildford?
Detached houses are the largest single type in eight of the ten Guildford postcodes with stock data, from 27.7% in GU12 to 59.5% in GU10, while flats are concentrated in GU1 at 25.4%. The mix shapes which strategy fits where. The figures below come from 2021 Census records for each postcode.
| Area | Detached | Semi-detached | Terraced | Flats |
|---|---|---|---|---|
| GU1 (Town Centre, Merrow) | 41.7% | 23.1% | 9.8% | 25.4% |
| GU2 (Guildford West, University) | 33.2% | 39.9% | 10.1% | 16.8% |
| GU3 (Normandy, Wood Street Village) | 45.6% | 28.6% | 10.8% | 8.0% |
| GU4 (Burpham, Chilworth) | 52.5% | 26.3% | 7.8% | 11.9% |
| GU5 (Shalford, Bramley) | 55.7% | 24.1% | 8.5% | 9.6% |
| GU10 (Tongham, Seale) | 59.5% | 23.4% | 8.6% | 8.4% |
| GU12 (Ash, Ash Vale) | 27.7% | 38.9% | 19.7% | 13.4% |
| GU21 (Woking, Knaphill) | 47.5% | 23.0% | 14.6% | 14.9% |
| GU23 (Ripley, Send) | 48.5% | 29.5% | 8.7% | 9.6% |
| GU24 (Chobham, Bisley) | 54.0% | 27.5% | 11.2% | 7.1% |
| KT24 (East Horsley, West Horsley) | Not enough data | Not enough data | Not enough data | Not enough data |
GU1 holds the borough's largest share of flats at 25.4%, well ahead of anywhere else, and it lines up with GU1 carrying lower asking prices than the outer postcodes and a deep, fast-moving market. Town centre flats around Guildford suit single professionals and couples commuting to London, the tenant type the station serves.
GU10 is the most detached-dominated postcode at 59.5%, with one of the smallest flat shares at 8.4%. Detached and semi-detached houses together make up more than 80% of the stock there, which fits its high asking prices and the slow, owner-occupier nature of the market. GU2 and GU12 are the two postcodes weighted towards semi-detached and smaller stock, the housing that most often works for letting.
Flats combine purpose-built and converted units. A small share of mobile and temporary dwellings is not shown, so rows may not total 100%.

Guildford Rental Market Analysis
Monthly rents in Guildford run from £1,456 in GU12 to £3,325 in GU5, with gross rental yields from 3.1% to 5.3% across the nine postcodes with rental data. For investors weighing whether buy to let is worth it in a market this expensive, the sections below break down rents, yields and tenant affordability postcode by postcode. If you are mapping out how to build a property portfolio in the South East, Guildford's high wages and 83.2% employment give a more resilient tenant base than higher-yielding markets, at the cost of a lower headline return. Current buy-to-let deals across the region are worth a look alongside the data here.
Average Rent & Gross Rental Yields in Guildford
Gross rental yields in Guildford range from 3.1% in GU4 to 5.3% in GU2, with the university postcode delivering both the strongest yield and a healthy rent of £2,162 a month. GU2 is the exception to the borough's usual rule that more expensive means lower yield: it commands a strong rent on a mid-table asking price because the student and research-park demand keeps rented homes full. GU23 and KT24 carry asking prices but too few rental listings to read a yield, so they sit at the foot of the table without one.
| Area | Average Monthly Rent | Asking Price | Gross Yield |
|---|---|---|---|
| GU2 (Guildford West, University) | £2,162 | £485,200 | 5.3% |
| GU12 (Ash, Ash Vale) | £1,456 | £388,459 | 4.5% |
| GU10 (Tongham, Seale) | £3,090 | £845,334 | 4.4% |
| GU1 (Town Centre, Merrow) | £1,745 | £485,243 | 4.3% |
| GU21 (Woking, Knaphill) | £1,573 | £436,904 | 4.3% |
| GU3 (Normandy, Wood Street Village) | £2,676 | £764,733 | 4.2% |
| GU5 (Shalford, Bramley) | £3,325 | £1,022,406 | 3.9% |
| GU24 (Chobham, Bisley) | £1,922 | £689,424 | 3.3% |
| GU4 (Burpham, Chilworth) | £1,748 | £684,635 | 3.1% |
| GU23 (Ripley, Send) | Not enough data | £735,745 | Not enough data |
| KT24 (East Horsley, West Horsley) | Not enough data | £1,197,554 | Not enough data |
GU2 at 5.3% is the clear leader on yield. A £2,162 monthly rent on a £485,200 asking price reflects the University of Surrey and its research park, which keep a deep pool of students, postgraduates and professional tenants in the postcode all year. A 30% deposit there is £145,560 for the highest-yielding postcode in the borough.
GU4 at 3.1% sits at the bottom. Burpham and Chilworth carry a £684,635 asking price against a £1,748 rent, so the income return is squeezed by the high capital cost. The pattern across the borough is that the village and green-belt postcodes earn their keep through long-run growth and tenant quality rather than monthly cash flow.
Gross Rental Yield by Postcode
Is Guildford Rent High?
Monthly rents in Guildford take between 37.3% and 85.3% of the local median gross salary, so every postcode sits above the widely cited 30% affordability threshold. That is a direct consequence of a premium market: rents are high in absolute terms, and even Guildford's strong wages do not pull them back under the line. It marks the borough out from the cheaper markets where the median tenant has more headroom.
The median full-time salary in Guildford is £900.00 a week, which works out at £3,900 a month or £46,801 a year. That is above the South East median of £800.30 a week and the Great Britain median of £752.40. Data from the Nomis Labour Market Profile (ASHE 2025).
| Rank | Area | Rent as % of Income |
|---|---|---|
| 1 | GU5 (Shalford, Bramley) | 85.3% |
| 2 | GU10 (Tongham, Seale) | 79.2% |
| 3 | GU3 (Normandy, Wood Street Village) | 68.6% |
| 4 | GU2 (Guildford West, University) | 55.4% |
| 5 | GU24 (Chobham, Bisley) | 49.3% |
| 6 | GU4 (Burpham, Chilworth) | 44.8% |
| 7 | GU1 (Town Centre, Merrow) | 44.7% |
| 8 | GU21 (Woking, Knaphill) | 40.3% |
| 9 | GU12 (Ash, Ash Vale) | 37.3% |
| — | GU23 (Ripley, Send) | Not enough data |
| — | KT24 (East Horsley, West Horsley) | Not enough data |
GU12 at 37.3% is the most affordable postcode for a single median earner, with a £1,456 rent against a £3,900 monthly salary. Affordable rents tend to come with fewer arrears and longer tenancies, which is part of why the cheaper, more liquid postcodes round out a portfolio rather than just the high-yield ones.
GU5 at 85.3% is the least affordable, but the figure carries context. The £3,325 rents in Shalford and Bramley point at large family homes let to dual-income professional households, not single earners on the median wage, so a single-salary ratio overstates the stretch for the tenants who actually rent there.
How Big Is Guildford's Private Rented Sector?
The private rented sector is deepest in GU2 at 28.8% of households and GU12 at 20.8%, and shallowest in GU21 at 15.7% and GU10 at 16.2%. The share of homes already rented privately is a guide to the size of the established tenant pool and the local lettings market. The table below shows household tenure by postcode.
| Area | Owned Outright | Owned with Mortgage | Private Rented | Social Rented |
|---|---|---|---|---|
| GU2 (Guildford West, University) | 33.2% | 26.3% | 28.8% | 10.2% |
| GU12 (Ash, Ash Vale) | 32.1% | 33.2% | 20.8% | 12.7% |
| GU1 (Town Centre, Merrow) | 35.8% | 30.4% | 20.3% | 11.8% |
| GU24 (Chobham, Bisley) | 38.2% | 37.5% | 20.0% | 3.5% |
| GU5 (Shalford, Bramley) | 43.7% | 30.0% | 19.7% | 5.6% |
| GU23 (Ripley, Send) | 41.7% | 33.1% | 19.6% | 4.6% |
| GU4 (Burpham, Chilworth) | 41.9% | 32.2% | 17.0% | 8.1% |
| GU3 (Normandy, Wood Street Village) | 41.1% | 33.0% | 16.9% | 8.4% |
| GU10 (Tongham, Seale) | 41.8% | 35.1% | 16.2% | 6.2% |
| GU21 (Woking, Knaphill) | 39.8% | 36.7% | 15.7% | 7.2% |
| KT24 (East Horsley, West Horsley) | Not enough data | Not enough data | Not enough data | Not enough data |
GU2 has the largest private rented sector in the borough at 28.8% of households, comfortably ahead of anywhere else, and it pairs that with the highest yield at 5.3%. The university and research park give it both the demand and the existing rental stock, which is the combination an income-focused landlord is looking for. GU12 and GU1 follow at around a fifth of households privately rented.
The outer and village postcodes sit at the other end, with owner-occupation dominating and private renting closer to a sixth of homes. Of the three postcodes with enough listings to read the live rental market, GU1 and GU21 both currently favour landlords: around 173 and 95 homes were advertised to rent, letting in roughly 66 and 37 days. GU2 was more balanced, with about 118 homes on the rental market taking around 114 days to let. The other postcodes have too few rental listings at any one time to read reliably.
Local Housing Allowance Rates in Guildford
Guildford's postcodes split across two Broad Rental Market Areas, so the Local Housing Allowance rate depends on where in the borough a property sits. Local Housing Allowance sets the maximum housing support a tenant on benefits can receive, which acts as a rent floor for landlords letting to that part of the market. Most of the borough falls in the Guildford BRMA, while GU10 and GU12 to the west fall in the lower-rated Blackwater Valley BRMA. To check the current rate for a specific address, use the government's official Local Housing Allowance calculator.
| Property Size | Guildford BRMA (weekly) | Blackwater Valley BRMA (weekly) |
|---|---|---|
| Shared accommodation | £118.52 | £110.00 |
| 1 bedroom | £218.63 | £184.11 |
| 2 bedrooms | £281.92 | £230.14 |
| 3 bedrooms | £340.60 | £298.03 |
| 4 bedrooms | £455.21 | £391.23 |
The Guildford BRMA covers GU1, GU2, GU3, GU4, GU5, GU21, GU23 and GU24, where the two-bedroom rate of £281.92 a week works out at about £1,221 a month. GU10 and GU12 sit in the Blackwater Valley BRMA, where the same two-bedroom rate is £230.14 a week, around £997 a month. Both sit well below Guildford's open-market rents, so a benefit-backed tenancy at the LHA rate leaves a clear gap to the £1,456 to £3,325 range recorded across the borough. For a landlord weighing that part of the market, the postcode determines which rate applies.
Buy-to-Let Considerations
Are House Prices High in Guildford? Price-to-Earnings Ratios
Buying in Guildford takes between 8.3 and 25.6 times the local median annual salary, and every postcode sits above the national benchmark. This is based on the Nomis Labour Market Profile for Guildford, which puts the median gross annual income for residents at £46,801.
The national benchmark for price-to-earnings is 7.4x (England's average sold price of £289,946 divided by the Great Britain median annual salary of £39,125). None of Guildford's eleven postcodes comes in below that line, which is the clearest single measure of how stretched the borough is against local incomes, even on its above-average wages.
| Rank | Area | Price-to-Earnings Ratio |
|---|---|---|
| 1 | GU12 (Ash, Ash Vale) | 8.3x |
| 2 | GU21 (Woking, Knaphill) | 9.3x |
| 3 | GU1 (Town Centre, Merrow) | 10.4x |
| 4 | GU2 (Guildford West, University) | 10.4x |
| 5 | GU4 (Burpham, Chilworth) | 14.6x |
| 6 | GU24 (Chobham, Bisley) | 14.7x |
| 7 | GU23 (Ripley, Send) | 15.7x |
| 8 | GU3 (Normandy, Wood Street Village) | 16.3x |
| 9 | GU10 (Tongham, Seale) | 18.1x |
| 10 | GU5 (Shalford, Bramley) | 21.8x |
| 11 | KT24 (East Horsley, West Horsley) | 25.6x |
GU12 at 8.3x is the most affordable entry against local earnings, though it still sits above the 7.4x national benchmark. Ash and Ash Vale carry the borough's lowest asking price, so the ratio reflects the cheaper commuter-edge stock rather than any softness in demand.
KT24 at 25.6x and GU5 at 21.8x are more than three times the national benchmark. At more than twenty times local earnings, the Horsleys and the Shalford and Bramley villages are firmly priced for cash-rich buyers and equity-rich downsizers, not for anyone stretching a salary multiple. For an investor, a ratio that high signals heavily compressed yields and a long payback, which the sub-4% yields in those postcodes bear out.
Deposit Requirements in Guildford
A 30% deposit on a Guildford buy-to-let runs from £116,538 in GU12 to £359,266 in KT24. The gap between the cheapest and most expensive deposit is more than £240,000, which is two full deposits in GU12. These are large numbers even by South East standards, and they shape which postcodes are realistic for a single purchase versus which need serious capital.
Beyond the deposit, the stamp duty calculation and other buy to let costs add to the total capital required, and in a market priced like Guildford the stamp duty bill alone is substantial.
| Rank | Area | 30% Deposit Required |
|---|---|---|
| 1 | GU12 (Ash, Ash Vale) | £116,538 |
| 2 | GU21 (Woking, Knaphill) | £131,071 |
| 3 | GU2 (Guildford West, University) | £145,560 |
| 4 | GU1 (Town Centre, Merrow) | £145,573 |
| 5 | GU4 (Burpham, Chilworth) | £205,391 |
| 6 | GU24 (Chobham, Bisley) | £206,827 |
| 7 | GU23 (Ripley, Send) | £220,723 |
| 8 | GU3 (Normandy, Wood Street Village) | £229,420 |
| 9 | GU10 (Tongham, Seale) | £253,600 |
| 10 | GU5 (Shalford, Bramley) | £306,722 |
| 11 | KT24 (East Horsley, West Horsley) | £359,266 |
GU12 is the cheapest way into the borough at a £116,538 deposit, and GU21 is the next step up at £131,071. Those two commuter-edge postcodes are where an investor can buy with the smallest capital outlay and the fastest-moving markets, GU21 turning over 18% of its stock a year against the borough's slow village postcodes.
At the top, the £359,266 deposit in KT24 is more than the entire asking price of plenty of homes in the North of England. The capital tied up in a single Horsley purchase is the clearest illustration of what a premium Surrey market asks of an investor, and KT24 returns no readable rental yield to set against it, so the profile is long-run growth rather than monthly cash flow.

What the Guildford Data Tells Buy-to-Let Investors
In Guildford the income postcode and the entry postcode are not the same one. GU2 (Guildford West, University) carries the top yield at 5.3% on a £2,162 rent, driven by the University of Surrey and its research park, but its £485,200 asking price needs a £145,560 deposit. GU12 (Ash, Ash Vale) is the cheapest way in at £388,459 with a £116,538 deposit, the most affordable price against local earnings at 8.3 times income, and a workable 4.5% yield. So the lowest entry and the highest yield sit in different postcodes here, which is the opposite of how a market like Chester behaves.
GU1 (Town Centre, Merrow) is the one postcode that grew across every window we looked at, up 7.1% over a year, 10.1% over three and 3.8% over five, and it is one of the most liquid markets in the borough at 32 sales a month. It pairs that record with a 4.3% yield, so GU1 is where growth and a fair income meet rather than where either one peaks. For buying an investment property in Guildford, those three postcodes, GU2, GU1 and GU12, are where the numbers work hardest.
The outer and village postcodes tell the other half of the story. GU4, GU24, GU23, GU3, GU10, GU5 and KT24 all sit above £680,000 with yields of 4.4% or lower, or none readable at all, slow markets, and homes that can take up to two years to sell. They reward long-run growth and bring in high-quality, long-staying tenants, but they ask for deposits from £205,000 up past £350,000 and a patient holding period. Investors who want to come in below asking, in any postcode, often look through off-market property in Guildford rather than the open portals.
Guildford reads differently from the higher-yielding markets further north. With a £46,801 median salary, an 83.2% employment rate, the University of Surrey and a fast London line, the case rests on wages, demand and durability rather than headline income, and the data backs that: lower yields, but steady fundamentals underneath them.
How Guildford Compares
Guildford's mean asking price of £703,240 is the highest of four South East commuter locations compared here, and its top yield of 5.3% sits in the middle of the group. The comparison places Guildford alongside three nearby markets, each with a different balance of price and yield. The mean asking price and mean monthly rent are simple averages across all postcodes with data. Top gross yield is the single highest postcode yield in each location.
| Location | Mean Asking Price | Mean Monthly Rent | Mean Gross Yield | Top Yield (postcode) |
|---|---|---|---|---|
| Crawley | £407,518 | £1,492 | 4.4% | 5.0% (RH11) |
| Reading | £419,047 | £1,536 | 4.4% | 6.2% (RG1) |
| Woking | £587,833 | £1,706 | 3.5% | 4.3% (GU21) |
| Guildford | £703,240 | £2,189 | 3.7% | 5.3% (GU2) |
Guildford is the most expensive location in this comparison at £703,240 mean asking price, and it also carries the highest mean rent at £2,189. Its top yield of 5.3% beats neighbouring Woking at 4.3% but trails Reading at 6.2%, which combines a lower asking price with strong rents to lead the group on income.
For investors prioritising yield on a smaller budget, Crawley at £407,518 and Reading at £419,047 offer cheaper entry with yields at or above Guildford's. Woking is the closest peer on character, an adjacent Surrey commuter town, but Guildford's stronger rents and university-backed demand give it the higher top yield of the two. Guildford's case is the premium one: higher prices and rents, a wealthier tenant base, and a market that leans on durability over headline income. For a data-driven comparison across all UK locations, see our best buy-to-let areas guide.
Frequently Asked Questions
Is Guildford a good place to live for buy-to-let tenants?
It is, and it comes down to jobs and wages. Guildford's employment rate is 83.2%, well above the national 75.6%, and the typical full-time wage is £900 a week against roughly £752 across Great Britain. Tenants in steady, better-paid work are generally better placed to keep the rent paid, which is what underpins a premium market like this one.
It is also an easy place to rent in. A working town with a fast train to London Waterloo in under 40 minutes and the University of Surrey on its doorstep gives a broad mix of commuters, professionals and students, so demand does not lean on any one group.
What are the best areas in Guildford for property investment?
The borough splits fairly cleanly by price. GU2 (Guildford West and the University) carries the highest yield at 5.3% and the deepest private rented sector, so it leans towards income. GU12 (Ash, Ash Vale) is the cheapest way in at £388,459 with a 4.5% yield, so it is the lower-capital entry. GU1 (Town Centre, Merrow) is the one postcode that has grown across one, three and five years, so it leans towards steady growth.
At the top end, the village and green-belt postcodes such as GU5, GU10 and GU3 run from £764,000 to over £1 million with yields of 4.4% or lower. They reward long-run growth and tenant quality rather than monthly income. So if yield matters most, GU2 leads; if you want growth that has actually shown up across every timeframe, GU1 is the one.
What are average house prices in Guildford?
The average sold price across Guildford is £525,805 on the Land Registry index, about 81.3% above the England average of £289,946 as of March 2026. Asking prices by postcode run from £388,459 in GU12 (Ash, Ash Vale) up to £1,197,554 in KT24 (East Horsley, West Horsley), with a borough mean of £703,240. By type, detached homes average £942,831, semi-detached £518,065, terraced £425,272 and flats £266,633.
Through a buy-to-let lens, GU12 is the cheapest entry and GU2 the highest-yielding at 5.3%, while the village postcodes are the dearest and lowest-yielding.
Is there demand for student accommodation in Guildford?
Yes, and it is concentrated around GU2. The University of Surrey's Stag Hill and Manor Park campuses sit in that postcode, with around 17,000 students, and it shows up in the numbers: GU2 has the borough's highest yield at 5.3% and its deepest private rented sector at 28.8% of households. Student and postgraduate demand keeps rented homes there full year-round, alongside professional tenants from the research park.
Shared student lets do come with summer voids and more hands-on management than a standard tenancy, so factor that in. On the room-rent side, a sample of current GU2 adverts puts a double with an ensuite at around £216 a week and a double with a shared bathroom at about £175, the two room types with enough live adverts to read. For the purpose-built end of the market, see our guide to student accommodation for sale, and for how the numbers work on a shared house, our complete guide to investing in HMOs.
How does Guildford compare to Reading for buy-to-let?
Reading is the higher-yield, lower-cost end of the comparison. Its top gross yield is around 6.2% against Guildford's 5.3%, and its mean asking price of £419,047 is roughly 40% cheaper than Guildford's £703,240. If income on a smaller budget is the priority, Reading does more of that work.
Guildford trades that for a higher-value market, stronger rents at £2,189 a month on average, and the University of Surrey underpinning demand in GU2. Both are fast-train commuter towns. Reading is the cheaper, higher-yielding entry; Guildford is the more expensive market with the wealthier tenant base.
When will the town centre regeneration affect Guildford property prices?
Not immediately, but the schemes are real and on site rather than on paper. The North Street scheme (485 homes) and the Station Quarter (438 homes) are both under construction, with first homes and a new station car park due from summer 2026. The Guildford Park Road scheme (248 homes) won planning approval in March 2026, with construction expected to start in summer 2026 and completion towards the end of 2028.
Together they add more than 1,170 homes in the town centre. Any real effect on values is a few years out, but the fact that two of the three are already building gives the wider regeneration credibility, and the new station serves exactly the commuter demand that holds Guildford prices up.
What are the Local Housing Allowance rates in Guildford?
Guildford straddles two Broad Rental Market Areas, so the rate depends on the postcode. Most of the borough falls in the Guildford BRMA, where, as of June 2026, Local Housing Allowance runs at £118.52 a week for a shared room, £218.63 for a one-bed, £281.92 for two beds, £340.60 for three and £455.21 for four. GU10 and GU12 to the west fall in the lower Blackwater Valley BRMA, where the two-bed rate is £230.14 a week against £281.92 in the Guildford area. Those figures are the most a tenant on housing support can claim towards rent, so for that part of the market they set a floor.
What type of property is most common in Guildford?
Detached houses, in eight of the ten postcodes. They run from 27.7% of the stock in GU12 up to 59.5% in GU10. The smaller homes that usually suit buy-to-let are more concentrated in specific spots: flats make up 25.4% of GU1, by far the highest in the borough, and GU2 and GU12 carry the largest semi-detached shares at around 39%. The village postcodes such as GU10 and GU5 are the most house-heavy and the least suited to a flat-focused let.
How do I buy an investment property in Guildford?
Start by deciding whether you are buying for income or for growth, because in Guildford that points you at different postcodes. If income leads, GU2 (Guildford West, University) has the highest yield at 5.3%. If budget is the constraint, GU12 (Ash, Ash Vale) is the cheapest entry at £388,459. GU1 (Town Centre, Merrow) sits in between, pairing a 4.3% yield with growth across every timeframe. Then budget for a 30% deposit, which starts at £116,538 in GU12 and climbs past £350,000 in the priciest postcodes, with stamp duty on top.
Beyond what is listed openly, plenty of experienced investors buy below asking through off-market property in Guildford and below market value property. To see what is available now, browse buy-to-let deals across the UK.
Ready to buy property?
Access off-market investment properties with an average 8%+ annual gross yield (beating the UK's typical 3-5%).
Get property alerts