Ely is a cathedral city in East Cambridgeshire, in the East of England. Average sold prices across East Cambridgeshire sit at £341,007 on the HM Land Registry House Price Index, 17.6% above England's £289,946 and almost level with the East of England's £337,182. That places Ely in the pricier half of the region, cheaper than Cambridge 16 miles south but dearer than Peterborough or the Fenland towns to the north. The district's population grew 4.7% between the 2011 and 2021 censuses, from 83,818 to 87,762 residents.
Two postcodes carry the city itself. CB6 (Ely, Littleport) and CB7 (Ely, Soham) both yield 4.0%, and CB7, at an asking price of £342,225, is the cheapest way into the area. The other four outcodes assigned to Ely reach across into Newmarket, the Cambridge fringe villages and Huntingdonshire, so their figures describe a wider rural belt rather than Ely proper. CB24 and PE28 hit the top yield of 4.1%, but they are the least Ely-specific of the six. This guide reads the numbers postcode by postcode and is clear about where the city ends.
This guide covers the district of East Cambridgeshire (ONS code E07000009), with postcode data for CB6, CB7, CB8, CB24, CB25 and PE28. Population, sold prices and earnings are reported at the East Cambridgeshire level, since the Land Registry and ONS publish those figures for the whole district, while the asking-price, rent and growth tables are specific to each postcode. Investors weighing up the wider county may also look at Cambridge, 16 miles south. Browse all our top buy-to-let locations.
Article updated: July 2026

Why Invest in Ely?
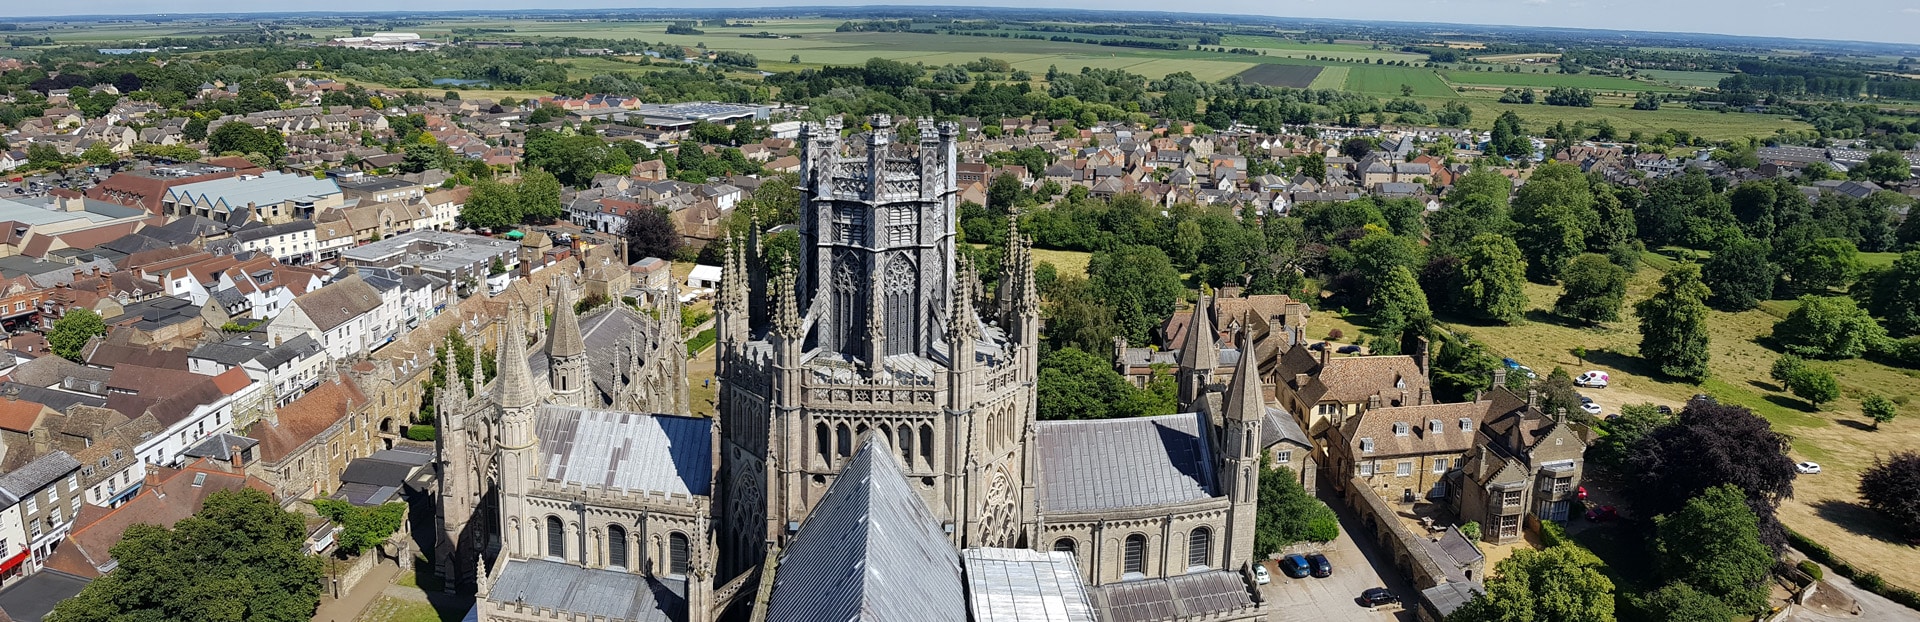
Ely is one of England's smallest cities, home to around 21,000 people inside a district of 87,762, and it works as a commuter base for Cambridge rather than a job centre in its own right. The city sits 16 miles north of Cambridge in the flat Fenland landscape, with the cathedral, known as the Ship of the Fens, visible for miles. For a place its size it draws steady demand from families and commuters who want Cambridge access without Cambridge prices.
Ely's rail links do most of the heavy lifting for the local rental market. Direct trains reach Cambridge in around 15 minutes and London King's Cross in a little over an hour, alongside services to Peterborough, King's Lynn, Norwich and Ipswich. That connectivity is why so many Ely tenants and buyers work outside the city, and it is the single biggest reason a small Fenland cathedral city commands East of England prices at all.
The local economy leans on agriculture, food processing, light manufacturing and public services, with the large RAF and United States Air Force bases at Mildenhall and Lakenheath a short drive east adding thousands of service and civilian jobs to the wider catchment. The employment rate across East Cambridgeshire is high at 84.9%, well above the regional and national figures, reflecting a district where most working-age residents are in jobs, many of them commuting out.
Median gross annual earnings across East Cambridgeshire are £41,464, above the East of England median of £40,862 and the Great Britain figure of £39,125. Those are respectable wages, but they still trail the district's house prices, which are set as much by Cambridge overspill and lifestyle demand as by local pay. That gap between what residents earn and what homes cost is the recurring feature of the Ely market, and it is what keeps yields in the low fours.
Ely Economic Summary
- Population: 87,762 (2021 Census, East Cambridgeshire). Growth of 4.7% from 2011.
- Median annual salary: £41,464 (East Cambridgeshire), £40,862 (East of England), £39,125 (Great Britain)
- Employment rate: 84.9% (East Cambridgeshire)
- Key employment sectors: Agriculture and food processing, public administration, light manufacturing, defence, retail
Source: ONS Census 2021, Nomis Labour Market Profile (ASHE 2025, Employment Oct 2024-Sep 2025)
The 84.9% employment rate is one of the highest in the East of England, and it tells you something specific about Ely: this is a district of people in work who chose to live here and travel out. For a landlord that is a stable tenant base, less exposed to a single local employer than a company town would be, but also priced by outside wages rather than the food-processing and agricultural pay that dominates the city's own economy.
Regeneration and Investment in Ely
The North Ely development will add 3,000 homes on the northern edge of the city by 2031, the largest single change to Ely's housing stock in a generation. The schemes below are focused on housing supply, and the largest of them will reshape where new rental demand sits.
- North Ely Development (underway, 3,000 homes): East Cambridgeshire District Council's masterplan calls for 3,000 homes on land north of the city by 2031, built across two sites either side of Lynn Road and the A10 by Redrow Homes, Hopkins Homes and Taylor Wimpey. The scheme includes two primary schools, an extensive new country park, 30% affordable housing and enough employment land to support 1,300 to 1,500 jobs. For landlords, this is a large, staged release of new-build stock in CB6 and CB7 that will broaden the supply of family homes and, in time, the pool of tenants around the city's northern edge. Updates at East Cambridgeshire District Council.
- Ely Affordable Housing Scheme (underway, 27 homes): Palace Green Homes, the council's own development company, is building 27 affordable homes in Ely with Havebury Housing Partnership, made up of eight one-bedroom flats, ten two-bedroom flats and nine three-bedroom houses, all for social rent, with the first available in 2026. The scheme is small but tells you the council is actively adding to a district where housing supply has long trailed demand. Updates at East Cambridgeshire District Council.
- Wider East Cambridgeshire Housing Delivery (active): Beyond Ely itself, sites at Littleport and Little Downham are adding new homes across the CB6 postcode, and a proposal for over 500 homes at High Flyer Farm on the city's northern fringe has come forward, part of a district-wide pattern of steady residential growth driven by Cambridge commuter demand.

Ely Property Market Analysis
Average property prices across East Cambridgeshire have risen 482.0% since January 1995, from £58,589 to £341,007, and the district now sits 7.2% below its November 2025 high. Ely lies within the East Cambridgeshire district, so every sold-price figure from the HM Land Registry House Price Index is reported at district level. The sections below trace that cycle, then drill into current postcode data for sold prices, price per square foot, asking prices, growth and transaction volumes.
When Was the Last House Price Crash in Ely?
East Cambridgeshire's sharpest fall came out of the 2008 financial crisis. The index runs from January 1995 to March 2026, and within it the district has been through one full boom-and-bust, a long recovery, and a pandemic surge it is now easing back from.
- 1995 to 2000, the early climb: East Cambridgeshire opened 1995 at £58,589 and reached £81,793 by January 2000, steady single-digit growth as the Cambridge commuter belt began to widen out towards the Fens.
- 2000 to 2007, the boom: The district caught the full housing boom, with prices climbing from £81,793 in January 2000 to a peak of £197,939 in November 2007, a rise of 142% driven by cheap credit and spreading Cambridge overspill.
- 2007 to 2009, the financial crisis: From the November 2007 peak of £197,939 to the trough of £156,219 in May 2009, East Cambridgeshire lost 21.1% in 18 months. The worst annual reading was -15.7% in July 2009. The fall was even across property types, with detached, semi-detached and terraced homes all down around 21% and flats off 21.5%.
- 2009 to 2013, slow recovery: Prices bounced off the trough but then drifted for several years, and the district did not clear its pre-crash peak until September 2013, when the average passed £199,482. That recovery took nearly six years.
- 2014 to 2019, steady growth: Prices climbed through the middle of the decade on Cambridge-led demand, reaching £254,356 by March 2016 and continuing up towards £280,000 by early 2020, growing at a firmer pace than the national average.
- 2020 to 2022, pandemic surge: The stamp-duty holiday and the shift to remote working lifted prices from £281,833 in March 2020 to £326,752 by November 2022, a rise of 15.9%, as Cambridge workers looked further out for space.
- 2023 to 2026, plateau: Higher mortgage rates cooled the market, but East Cambridgeshire held up better than most, reaching an all-time high of £367,444 in November 2025 before easing to £341,007 by March 2026. The annual reading is now roughly flat at 0.3%.
Long-Term Property Value Growth in East Cambridgeshire
- 5 years (2021-2026): +17.7% (£289,686 to £341,007)
- 10 years (2016-2026): +34.1% (£254,356 to £341,007)
- 15 years (2011-2026): +90.7% (£178,855 to £341,007)
- 20 years (2006-2026): +108.6% (£163,443 to £341,007)
- 30 years (1995-2026): +482.0% (£58,589 to £341,007)
The 2008 crash is the reference point for East Cambridgeshire investors gauging downside. A 21.1% fall took nearly six years to recover, deeper than the national average, because the district's prices had run so far ahead of local wages during the boom that they had more room to give back. The 30-year return of 482.0% shows the long-run pull of the Cambridge commuter belt, while the district sitting 7.2% below its 2025 high shows how gently the recent correction has landed here compared with the sharper falls further west.
- All property types
- Detached
- Semi-detached
- Terraced
- Flats
- All property types
- Detached
- Semi-detached
- Terraced
- Flats
Source: HM Land Registry House Price Index for East Cambridgeshire, January 1995 to March 2026.
Sold House Prices in Ely
The latest sold-price index from the Land Registry covers East Cambridgeshire as a whole. The headline sold price of £341,007 is 17.6% above England's £289,946 and almost exactly level with the East of England's £337,182. That district premium over England is real, but it hides a wide gap between property types.
Detached houses in East Cambridgeshire average £484,718, a 3.0% premium to England's £470,492. Detached stock sits close to the national figure because the district's family homes and Fenland farmhouses attract Cambridge-priced buyers, but the gap is narrower than the headline number because East Cambridgeshire lacks the very high-value detached stock of Cambridge itself.
Semi-detached houses show a 12.6% premium, averaging £324,367 against England's £288,185. This is where the Cambridge commuter premium bites hardest, because semis are the core family-rental and owner-occupier stock in Ely, Littleport and Soham, and demand for them from priced-out Cambridge buyers holds the figure well above the national average.
Terraced houses average £273,298, a 12.1% premium to England's £243,788. Terraced homes are concentrated in the older streets of Ely and Soham in CB6 and CB7, and they are the type most likely to work as a standard let. Older terraces needing work are where many investors start, and for how to source them see our guide to finding renovation properties.
Flats and maisonettes average £168,499, a 21.5% discount to England's £214,563, the widest gap in the district. East Cambridgeshire lacks the dense, new-build apartment market that inflates flat prices in cities like Cambridge or Peterborough. Its flat stock is thinner and older, which is why the discount is so wide, and why flats are the one property type here that regularly lists below £200,000.
| Property Type | East Cambridgeshire Average | England Average | Difference |
|---|---|---|---|
| Detached houses | £484,718 | £470,492 | +3.0% |
| Semi-detached houses | £324,367 | £288,185 | +12.6% |
| Terraced houses | £273,298 | £243,788 | +12.1% |
| Flats and maisonettes | £168,499 | £214,563 | -21.5% |
| All property types | £341,007 | £289,946 | +17.6% |
Price Per Square Foot in Ely
Ely's price per square foot runs from £323 in PE28 to £393 in CB24, a spread of £70 across six postcodes. Price per square foot measures what buyers pay for floor space once you strip out how big a home is, so it reads underlying land value more cleanly than a headline price. The two Ely postcodes, CB6 at £324 and CB7 at £326, sit at the cheaper end, while the Cambridge-fringe outcodes CB24 and CB25 command the highest rates.
| Rank | Area | Price Per Sq Ft |
|---|---|---|
| 1 | PE28 (Kimbolton, Sawtry) | £323 |
| 2 | CB6 (Ely, Littleport) | £324 |
| 3 | CB7 (Ely, Soham) | £326 |
| 4 | CB8 (Newmarket) | £329 |
| 5 | CB25 (Burwell, Bottisham) | £380 |
| 6 | CB24 (Cottenham, Willingham) | £393 |
CB6 and CB7, the two Ely postcodes, sit at £324 and £326 per square foot, among the cheapest in the group. That matters because the city's asking prices are not driven by expensive land, they are driven by the size and type of homes on the market. Space in Ely costs roughly the same per foot as in the Fenland outcodes to the north, so the price differences you see between postcodes are mostly about how big the homes are.
CB24 at £393 is the most expensive space, and CB25 at £380 is not far behind. Both cover the villages between Ely and Cambridge, Cottenham, Willingham, Burwell and Bottisham, where proximity to Cambridge pushes the per-foot rate above the city itself. That is the Cambridge premium showing through in the one measure that strips out house size.
Figures reflect averages across all property types and ages. Individual values depend on condition, location within the postcode, and building age.
For Sale Asking Prices in Ely
Ely's asking prices run from £342,225 in CB7 to £443,890 in CB25, a spread of just over £100,000 across six postcodes. CB7 and CB6, the two city postcodes, are the two cheapest, while the Cambridge-fringe and Huntingdonshire outcodes sit at the top. These are asking prices from live listings, so with several postcodes showing negative annual growth, some may sit above what eventually sells.
| Rank | Area | Asking Price |
|---|---|---|
| 1 | CB7 (Ely, Soham) | £342,225 |
| 2 | CB6 (Ely, Littleport) | £380,603 |
| 3 | CB8 (Newmarket) | £395,022 |
| 4 | CB24 (Cottenham, Willingham) | £422,556 |
| 5 | PE28 (Kimbolton, Sawtry) | £428,369 |
| 6 | CB25 (Burwell, Bottisham) | £443,890 |
CB7 is the cheapest way into the area at £342,225. This is the postcode that covers the southern half of Ely and the market town of Soham, where a mix of terraces and semis keeps the average below its neighbours. At £342,225, CB7 needs a 30% deposit of £102,668, and it pairs that lowest entry with a 4.0% yield, the same yield as pricier CB6.
CB6, the other Ely postcode, sits at £380,603 and covers the northern half of the city plus Littleport. CB25 tops the table at £443,890, reaching into the affluent Cambridge-fringe villages of Burwell and Bottisham, where proximity to the city carries a clear premium. PE28 at £428,369 reaches west into Huntingdonshire, well beyond Ely, and is included only because the postcode is assigned to the district.
The mean asking price across all six postcodes is £402,111, a figure that reappears in the comparison section, where Ely is measured against Cambridge, Peterborough, Norwich and Ipswich.
House Price Growth in Ely
Growth data shows where prices have moved over one, three and five years. Half of Ely's six postcodes are down over one year, four are down over three, but all six hold positive five-year growth. That is the signature of a market working off the pandemic surge: the five-year window still captures the run-up, while the shorter windows show the correction that followed.
| Area | 1 Year | 3 Years | 5 Years |
|---|---|---|---|
| CB6 (Ely, Littleport) | 2.8% | 1.8% | 14.7% |
| CB24 (Cottenham, Willingham) | 5.5% | -1.2% | 11.7% |
| CB25 (Burwell, Bottisham) | -2.1% | -5.0% | 7.7% |
| CB7 (Ely, Soham) | 0.1% | -6.0% | 4.1% |
| PE28 (Kimbolton, Sawtry) | -6.8% | -8.3% | 1.1% |
| CB8 (Newmarket) | -4.0% | -2.5% | -0.2% |
CB6 leads on five-year growth at 14.7%, and it is one of the few postcodes here positive across all three windows. The northern Ely and Littleport postcode has held up where others slipped, up 2.8% over one year and 1.8% over three while most of the group fell back. For the two city postcodes, that makes CB6 the steadier of the pair on capital values, though CB7 matches it on yield.
CB7 shows the wider split, up 4.1% over five years but down 6.0% over three, telling you its gains were front-loaded into the surge and have unwound since. An investor who bought in CB7 five years ago is ahead; one who bought three years ago, at the top, is behind.
CB8, the Newmarket postcode, is the only one negative over five years at -0.2%, and PE28 in Huntingdonshire is the weakest over one and three years. Both sit at the edges of the district, and their softer figures are a reminder that the outer outcodes track different local markets from Ely itself. In a cooler market, repossessed houses occasionally surface below the averages shown here.
Monthly Property Sales in Ely
Transaction volume tells you how easily you could sell again. Ely's six postcodes manage 189 sales a month between them, with PE28 the busiest at 55 and CB25 the quietest at 15. The two city postcodes, CB6 and CB7, sit in the middle at 30 and 26 sales a month, enough activity to buy and sell without a fast market on exit.
| Area | Sales Per Month | Turnover | Asking Price |
|---|---|---|---|
| PE28 (Kimbolton, Sawtry) | 55 | 10% | £428,369 |
| CB24 (Cottenham, Willingham) | 31 | 29% | £422,556 |
| CB6 (Ely, Littleport) | 30 | 7% | £380,603 |
| CB8 (Newmarket) | 27 | 7% | £395,022 |
| CB7 (Ely, Soham) | 26 | 9% | £342,225 |
| CB25 (Burwell, Bottisham) | 15 | 10% | £443,890 |
CB6 and CB7 turn over 30 and 26 sales a month, on 7% and 9% turnover. Turnover is the share of local housing stock that changes hands in a year, so single-digit turnover means most homes sit tight and only a small slice comes to market. That is typical of a settled residential city where owner-occupiers and long-term landlords hold on, and for a buyer it means enough activity to transact without a rushed market on exit.
PE28 at 55 sales a month is the most active, but that reflects the sheer size of the Huntingdonshire outcode rather than anything about Ely. CB25 at 15 sales a month is the thinnest of the six, a smaller cluster of Cambridge-fringe villages where fewer homes trade. The two figures that matter most for an Ely investor are CB6 and CB7, and both point to a steady, liquid-enough city market.
Ely Rental Market Analysis
For anyone weighing up whether buy-to-let is worth it in Ely, the starting point is coverage: five of the six postcodes carry readable rents, and the two city postcodes both land on a 4.0% yield. The section below sets out what the data shows, and why the numbers are so tightly clustered.
Rental data is available for five of the six postcodes; only CB25 has too few current lettings listings to read a reliable rent. The other five sit in a narrow band between 3.7% and 4.1%, which tells you Ely is a place where prices and rents move roughly together, and where the highest yields come from the outer outcodes rather than the city itself. If you are looking to build a property portfolio in the East of England on rental income, Ely offers a stable base but a modest return.
Average Rent & Gross Rental Yields in Ely
Yields in Ely run from 3.7% in CB8 to 4.1% in CB24 and PE28, with the two city postcodes CB6 and CB7 both on 4.0%. That is a tight spread, and it sits below the 5% mark that most of our city guides reach in at least one postcode. Even the best-yielding Ely outcodes are held back by asking prices that reflect Cambridge overspill rather than local rents.
| Area | Average Monthly Rent | Asking Price | Gross Yield |
|---|---|---|---|
| CB24 (Cottenham, Willingham) | £1,440 | £422,556 | 4.1% |
| PE28 (Kimbolton, Sawtry) | £1,456 | £428,369 | 4.1% |
| CB6 (Ely, Littleport) | £1,261 | £380,603 | 4.0% |
| CB7 (Ely, Soham) | £1,142 | £342,225 | 4.0% |
| CB8 (Newmarket) | £1,224 | £395,022 | 3.7% |
| CB25 (Burwell, Bottisham) | Not enough data | £443,890 | Not enough data |
Gross Rental Yield by Postcode
CB6 and CB7 both land on 4.0%, the yield that matters most because it describes Ely itself. CB7 pairs the area's lowest asking price (£342,225) with rents around £1,142 a month, while CB6 carries a higher rent of £1,261 against a £380,603 price. The tenant base in both is the steadiest in the district: Cambridge commuters, local public-sector and food-industry workers, and families drawn to Ely's schools and rail links. For an investor who needs a property to cover its costs, the two city postcodes are where the numbers are most reliable.
CB24 and PE28 top the table at 4.1%, but both sit well outside Ely, in the Cambridge-fringe villages and Huntingdonshire respectively. The extra tenth of a point comes from their higher rents rather than any structural advantage, and both cover markets that behave differently from the city. CB25's asking price of £443,890 is the highest in the group, and with no readable rent it reads as an owner-occupier market more than a rental one.
Is Ely Rent High?
Monthly rents in Ely consume between 33.1% and 42.1% of the local median gross monthly salary. The widely cited threshold for rent affordability is 30% of gross income, and every Ely postcode sits above it. That reflects a district where rents are set against Cambridge-area demand while local pay, though healthy, does not stretch quite as far.
The median gross weekly salary in East Cambridgeshire is £797.40, which equates to £3,455 a month or £41,464 a year. That is above the East of England median of £785.80 a week and the Great Britain median of £752.40 a week. Data from the Nomis Labour Market Profile (ASHE 2025).
| Area | Rent as % of Income |
|---|---|
| PE28 (Kimbolton, Sawtry) | 42.1% |
| CB24 (Cottenham, Willingham) | 41.7% |
| CB6 (Ely, Littleport) | 36.5% |
| CB8 (Newmarket) | 35.4% |
| CB7 (Ely, Soham) | 33.1% |
| CB25 (Burwell, Bottisham) | Not enough data |
CB7 at 33.1% is the most affordable for tenants, and it is the cheapest way into the city. A monthly rent of £1,142 against a monthly salary of £3,455 leaves more headroom than anywhere else in the district. This matters for landlords, because affordable rents correlate with lower void periods and fewer arrears, and tenants who are not financially stretched tend to stay longer.
CB24 and PE28 sit above 41%, but both cover higher-rent outer areas where tenant households often bring dual or Cambridge-level incomes rather than the district median. The affordability picture that best describes Ely itself is CB6 and CB7, at 36.5% and 33.1%, both a touch above the 30% benchmark but supported by the city's commuter and public-sector base.
What Type of Property Is Most Common in Ely?
Detached houses dominate every Ely postcode, and only in the two city postcodes CB6 and CB7 do terraces reach a meaningful share. The stock mix explains a lot of what the price and rent tables show: where the housing is large and detached, the market leans owner-occupier; where it is smaller and denser, a rental market forms more easily.
| Area | Detached | Semi-detached | Terraced | Flats |
|---|---|---|---|---|
| CB6 (Ely, Littleport) | 57.7% | 24.7% | 7.5% | 2.5% |
| CB7 (Ely, Soham) | 58.8% | 25.2% | 6.9% | 2.8% |
| CB8 (Newmarket) | 53.1% | 33.8% | 8.6% | 4.2% |
| CB24 (Cottenham, Willingham) | 46.8% | 27.8% | 13.6% | 7.3% |
| CB25 (Burwell, Bottisham) | 58.1% | 25.2% | 12.6% | 3.0% |
| PE28 (Kimbolton, Sawtry) | 60.7% | 25.6% | 7.6% | 4.2% |
CB24 is the one postcode where terraces and flats add up to a real share, at 13.6% and 7.3% between them. That is the smaller, denser stock a rental market runs on, and it is one reason the Cambridge-fringe outcode carries the group's top yield. The two Ely postcodes are more than 57% detached, with terraces around 7% and flats under 3%, so the smaller-unit stock landlords usually target is scarce in the city itself.
PE28 and CB25 are the most detached of the six, at 60.7% and 58.1%, matching their higher asking prices and rural character. Across every Ely postcode, detached and semi-detached houses together account for over 80% of the stock, which is the mark of a district built around family homes rather than the flats and terraces that drive rental income at volume.
Flats combine purpose-built and converted units. A small share of mobile and temporary dwellings is not shown, so rows may not total 100%.
Ely Buy-to-Let Considerations
How Big Is Ely's Private Rented Sector?
The private rented sector is largest in CB8 at 22.1% of households and smallest in CB6 at 14.2%, with the two Ely postcodes sitting at the lower end. The share of homes already rented privately is a guide to the size of the established tenant pool, a different signal from yield. The table below sets out household tenure by postcode.
| Area | Owned Outright | Owned with Mortgage | Private Rented | Social Rented |
|---|---|---|---|---|
| CB8 (Newmarket) | 37.0% | 28.1% | 22.1% | 11.6% |
| CB7 (Ely, Soham) | 43.0% | 31.8% | 18.5% | 6.2% |
| CB25 (Burwell, Bottisham) | 41.5% | 30.5% | 16.5% | 10.2% |
| PE28 (Kimbolton, Sawtry) | 43.3% | 32.3% | 15.3% | 8.1% |
| CB24 (Cottenham, Willingham) | 40.2% | 28.5% | 14.7% | 14.9% |
| CB6 (Ely, Littleport) | 45.1% | 31.6% | 14.2% | 8.4% |
The private rented shares are fairly close across the district, between 14.2% and 22.1%, with the two Ely postcodes on the lower side at 18.5% for CB7 and 14.2% for CB6. That points to a city where owner-occupation runs high, CB6 has the highest outright ownership of the six at 45.1%, and the established rental pool is modest rather than deep. CB8's larger 22.1% rented share reflects Newmarket's racing-industry workforce and transient staff, a different rental dynamic from Ely's settled commuter base.
For a landlord, a smaller private rented sector cuts both ways. It means less existing rental competition in CB6 and CB7, but also a thinner pool of proven tenant demand, so location within the postcode, near the station or the better schools, matters more here than in a city with a large, active lettings market.

How Long Does It Take to Sell in Ely?
Selling times across Ely range from around 80 days in CB24 to 435 days in CB6, and the six postcodes span the full range from a seller's to a buyer's market. Selling time matters at both ends of a hold: it shapes how long your capital is tied up on the way out, and a slow market gives a buyer more room to negotiate on the way in. The table below shows average days on market and how many months of unsold stock each postcode carries.
| Area | Avg Days to Sell | Months of Unsold Stock | Market |
|---|---|---|---|
| CB24 (Cottenham, Willingham) | 80 | 2.6 | Seller's market |
| CB25 (Burwell, Bottisham) | 190 | 6.3 | Balanced market |
| CB7 (Ely, Soham) | 277 | 9.1 | Balanced market |
| PE28 (Kimbolton, Sawtry) | 304 | 10.0 | Balanced market |
| CB8 (Newmarket) | 380 | 12.5 | Buyer's market |
| CB6 (Ely, Littleport) | 435 | 14.3 | Buyer's market |
The two Ely postcodes read differently on exit: CB7 is a balanced market at 277 days, while CB6 is the slowest of the six at 435 days. Months of unsold stock counts how long it would take to clear everything currently for sale at the present rate of sales, and CB6's 14.3 months points to a postcode where supply currently outweighs demand. For a buyer, CB6 is the useful side of a slow market: sellers have time working against them, which is where offers below asking find traction.
CB24 at 80 days is the one seller's market in the group, a Cambridge-fringe postcode where proximity to the city keeps demand high and stock moving. That contrast, a fast outer-village market against the steadier city postcodes, is a reminder that the six outcodes here are really several different local markets sharing an Ely label.
Local Housing Allowance Rates in Ely
Ely and its five nearest postcodes sit in the Cambridge Broad Rental Market Area, where Local Housing Allowance runs from £121.13 a week for a shared room to £333.70 a week for a four-bedroom home; only PE28 falls in the lower Huntingdon area. Local Housing Allowance sets the maximum housing support a tenant on benefits can receive, so for that part of the market it acts as a floor under the rent a landlord can expect. The Cambridge-area rates below cover CB6, CB7, CB8, CB24 and CB25. To check the current rate for a specific address, use the government's official Local Housing Allowance calculator.
| Property Size | Weekly LHA Rate | Monthly Equivalent |
|---|---|---|
| Shared accommodation | £121.13 | £525 |
| 1 bedroom | £207.12 | £898 |
| 2 bedrooms | £218.63 | £947 |
| 3 bedrooms | £258.90 | £1,122 |
| 4 bedrooms | £333.70 | £1,446 |
The two-bedroom Cambridge-area rate of £218.63 a week works out at about £947 a month, which sits below CB6 and CB7's open-market rents of £1,261 and £1,142. A benefit-backed tenancy therefore covers a good share of an Ely rent without matching it, and the stock that fits within these rates is concentrated in the cheaper city terraces of CB7. PE28, out in Huntingdonshire, falls under the lower Huntingdon Broad Rental Market Area, where the equivalent two-bedroom rate is £182.96 a week (about £793 a month), a reminder that the western outcode sits in a different rental economy from Ely itself.
Are Ely House Prices High? Price-to-Earnings Ratios
Buying in Ely takes between 8.3 and 10.7 times the district's median salary of £41,464. The national benchmark is 7.4x, England's average sold price of £289,946 against Great Britain's median salary of £39,125. Not one Ely postcode comes below it, though the two city postcodes are the closest. Data from the Nomis Labour Market Profile for East Cambridgeshire.
| Rank | Area | Price-to-Earnings Ratio |
|---|---|---|
| 1 | CB7 (Ely, Soham) | 8.3x |
| 2 | CB6 (Ely, Littleport) | 9.2x |
| 3 | CB8 (Newmarket) | 9.5x |
| 4 | CB24 (Cottenham, Willingham) | 10.2x |
| 5 | PE28 (Kimbolton, Sawtry) | 10.3x |
| 6 | CB25 (Burwell, Bottisham) | 10.7x |
CB7 at 8.3x is the most accessible, and it is still 12% above the national benchmark. This is the defining feature of the Ely market: prices are set partly by Cambridge overspill, not just by what local workers earn. Even the district's cheapest postcode asks more than eight years of the median local salary.
CB25 and PE28 at 10.7x and 10.3x are the most stretched, both covering the Cambridge-fringe and Huntingdonshire villages where prices answer to a wider commuter pool than local wages. For a landlord, a high price-to-earnings ratio is a direct signal that yields will be compressed, because rents are anchored to what local tenants can pay while prices reach beyond them. CB6 at 9.2x sits between the two city extremes, kept lower than the outer villages by Ely's own, more grounded price base.
Deposit Requirements in Ely
Every Ely postcode needs a six-figure deposit at 30%, from £102,668 in CB7 to £133,167 in CB25. The table uses 30% rather than the typical 25% minimum, because the better mortgage rates on offer at 70% loan-to-value matter more in a low-yield market where cash flow is tight. CB7's £102,668 is the lowest way into the area, and the two city postcodes sit at the bottom of the table.
| Rank | Area | 30% Deposit Required |
|---|---|---|
| 1 | CB7 (Ely, Soham) | £102,668 |
| 2 | CB6 (Ely, Littleport) | £114,181 |
| 3 | CB8 (Newmarket) | £118,507 |
| 4 | CB24 (Cottenham, Willingham) | £126,767 |
| 5 | PE28 (Kimbolton, Sawtry) | £128,511 |
| 6 | CB25 (Burwell, Bottisham) | £133,167 |
The gap between the two city postcodes and the rest is modest but real. CB7's £102,668 deposit is around £11,500 below CB6 and over £30,000 below CB25. For an investor set on Ely itself, CB7 is the lowest capital requirement, and it also carries a 4.0% yield and the district's most affordable rent-to-income ratio, so the factors that matter most for a standard let line up in the same postcode.
CB24, CB25 and PE28 all need deposits above £126,000, and at that level the same capital could secure a cheaper, higher-yielding property in Peterborough to the north-west. Whether the Cambridge-commuter appeal of the outer villages justifies the higher entry is the investor's call, but on income alone the two city postcodes make the stronger case.
Deposit is only part of the upfront cost. Budget for stamp duty (our stamp duty calculator gives an accurate figure), legal fees and a survey. For the full picture, see our guide to buy-to-let running costs. If six-figure deposits are out of reach, our guide to investing in property with no deposit covers the alternatives.
What the Ely Data Tells Buy-to-Let Investors
Ely is a two-postcode city inside a six-postcode data footprint, and CB6 and CB7 are the ones that describe it. Both land on a 4.0% yield, CB7 with the lowest asking price (£342,225), the lowest deposit (£102,668) and the most affordable rent-to-income ratio (33.1%), CB6 with the strongest five-year growth (14.7%) and steadier recent capital values. If you are buying an investment property in Ely to let, the two city postcodes are where the numbers hold together.
The other four postcodes, CB8, CB24, CB25 and PE28, reach into Newmarket, the Cambridge-fringe villages and Huntingdonshire, and describe different local markets. CB24 and PE28 carry the group's top yield at 4.1%, but the extra tenth of a point comes with outer-village or out-of-district locations rather than any structural edge. An investor looking at buy-to-let homes for sale across these outcodes should treat them as separate markets, not as Ely.
Growth across the district is soft in the short term. Three of six postcodes are down over one year and four are down over three, while all six hold positive five-year figures because the pandemic surge was large enough to cushion the correction. CB6's 14.7% over five years is the strongest, CB8's -0.2% the weakest. East Cambridgeshire as a whole sits 7.2% below its 2025 high, so recent buyers may be close to flat while longer-term owners are well ahead.
East Cambridgeshire does not run a selective licensing scheme, so most standard lets need no licence, though shared houses of five or more people in two or more households fall under mandatory HMO licensing set out on the council's HMO licensing pages. For a standard family let in CB6 or CB7, no licence is required, which keeps the compliance burden light for the mainstream Ely landlord.
How Ely Buy-to-Let Compares to Nearby Areas
Ely is the second most expensive of five East of England locations here at £402,111, yet its top yield of 4.1% is the lowest of the group. The table compares mean asking prices, mean monthly rents and the top single-postcode gross yield across the five, sorted from cheapest to dearest.
| Location | Mean Asking Price | Mean Monthly Rent | Mean Gross Yield | Top Yield (postcode) |
|---|---|---|---|---|
| Peterborough | £283,870 | £1,084 | 4.6% | 5.5% (PE1, PE4) |
| Norwich | £311,315 | £1,355 | 5.2% | 8.0% (NR5) |
| Ipswich | £314,699 | £1,043 | 4.0% | 5.1% (IP2, IP3) |
| Ely | £402,111 | £1,305 | 3.9% | 4.1% (CB24, CB6) |
| Cambridge | £501,183 | £1,690 | 4.0% | 4.7% (CB2) |
Only Cambridge asks more than Ely, and every other location in the group delivers a higher top yield. Ely's 4.1% sits 1.4 percentage points below Peterborough's 5.5% and well below Norwich's 8.0%. Cambridge is dearer still at £501,183, and even its top yield of 4.7% edges Ely's, so Ely combines the second-highest entry cost with the weakest income return on the table.
Peterborough offers the friendliest numbers for a yield-focused investor, with a mean asking price £118,000 below Ely's and a higher top yield in a deeper market. Ipswich sits in the middle, cheaper than Ely with a 5.1% top yield, while Norwich pairs the group's highest yield at 8.0% with an asking price well below Ely's.
Ely's position on this table is the Cambridge commuter premium in numbers. Buyers here are paying for rail access and quality of life, not rental income, which is exactly why its yields sit in the low fours. For anyone comparing where to invest for yield across the East of England, the data favours the other four, while Ely's appeal rests on its steadiness and its proximity to Cambridge. Investors chasing value can also look at off-market property in Ely, where sellers in the slower CB6 market may take offers below asking.
Frequently Asked Questions
What are the best areas in Ely for property investment?
On the rental numbers, CB6 (Ely, Littleport) and CB7 (Ely, Soham) are the two postcodes that describe the city itself, and both land on a 4.0% gross yield. CB7 carries the lowest asking price (£342,225), the lowest 30% deposit (£102,668) and the most affordable rent-to-income ratio at 33.1%, while CB6 holds the strongest five-year growth of any Ely postcode at 14.7%. If income is the priority, CB7 is where the data points; if steadier capital values matter more, CB6 has held up best.
The other four outcodes assigned to Ely, CB8, CB24, CB25 and PE28, reach into Newmarket, the Cambridge-fringe villages and Huntingdonshire. CB24 and PE28 show the top yield at 4.1%, but they describe wider rural markets rather than Ely, so they are best treated as separate areas.
How does Ely compare to Cambridge for buy-to-let?
Ely is markedly cheaper. Its six-postcode mean asking price of £402,111 sits around £99,000 below Cambridge's £501,183, and its cheapest postcode, CB7, comes in at £342,225 against Cambridge prices that push well past £500,000. Yet the yields are close: Ely's two city postcodes run at 4.0% and its best outcode at 4.1%, while Cambridge tops out at 4.7%, so Cambridge edges the income return despite the higher entry.
The trade-off is what you are buying. Cambridge offers a deeper rental market with strong student and professional demand, but at a price that ties up far more capital per property. Ely offers the same rail line and much of the same commuter appeal for a lower buy-in, with a thinner but steadier tenant base. For an investor priced out of Cambridge who still wants the Cambridge catchment, Ely is the more accessible way in.
Is Ely a good place to live?
Ely is one of England's smallest cities, built around its cathedral and set in open Fenland, with a strong community feel, good schools and a compact centre. Its biggest draw is connectivity: direct trains reach Cambridge in around 15 minutes and London King's Cross in a little over an hour, which is why so many residents live in Ely and work elsewhere. The district's employment rate of 84.9% is among the highest in the East of England.
The catch is cost. The median local salary of £41,464 is healthy, but house prices are set partly by Cambridge overspill, so even CB7, the cheapest postcode, asks 8.3 times the local median wage against a national benchmark of 7.4x. Living in Ely is comfortable on a professional or commuter income, and a good deal cheaper than Cambridge for the same rail access.
What are average house prices in Ely?
The average sold price across East Cambridgeshire, the district Ely sits in, is £341,007 on the Land Registry index as of March 2026, about 17.6% above the England average of £289,946 and almost level with the East of England. Asking prices by Ely postcode run from £342,225 in CB7 up to £443,890 in CB25, with a six-postcode mean of £402,111. By type across the district, detached homes average £484,718, semi-detached £324,367, terraced £273,298 and flats £168,499.
Through a buy-to-let lens, CB7 is the cheapest entry and, with CB6, one of the two postcodes that best represents the city itself, both on a 4.0% yield.
Are flats available to rent or buy in Ely?
Flats are the scarcest property type in Ely. Across East Cambridgeshire they average £168,499, a 21.5% discount to England's £214,563, so they are the one type here that regularly lists below £200,000. But they make up under 3% of the stock in the two city postcodes, CB6 and CB7, well below the terraces and semis that dominate. What flats exist tend to cluster near Ely's centre and station, where they suit single professionals and couples commuting to Cambridge. An investor set on a flat will find more choice, and lower prices, in the Cambridge-fringe CB24 postcode, where flats reach 7.3% of the stock.
How much deposit do I need to buy a buy-to-let in Ely?
Every Ely postcode needs a six-figure deposit on the 30% loan-to-value basis this guide uses, from £102,668 in CB7 up to £133,167 in CB25. The two city postcodes are the most accessible, CB7 at £102,668 and CB6 at £114,181. We use 30% rather than the 25% minimum because the better mortgage rates available at 70% loan-to-value make a real difference in a low-yield market like Ely, where cash flow is tight and the interest saving protects your monthly position. Budget separately for stamp duty, legal fees and a survey on top of the deposit.
What impact will the North Ely development have on the market?
The North Ely development will add 3,000 homes on the northern edge of the city by 2031, built by Redrow Homes, Hopkins Homes and Taylor Wimpey across two sites either side of Lynn Road and the A10. For landlords, that is a large, staged release of new-build family homes in the CB6 and CB7 postcodes, alongside two primary schools, a country park and land for 1,300 to 1,500 jobs. In the near term it broadens the supply of modern family homes to buy and let; over time, the jobs and schools should deepen tenant demand around the city's northern edge. New-build stock at this scale can hold asking prices firm locally, but it also gives buyers more choice, which is worth factoring into any purchase in those postcodes.
How do I buy an investment property in Ely?
Start with the honest position: Ely is a two-postcode city for a standard buy-to-let, so if you are buying for income, CB6 and CB7 are where the numbers point, both on a 4.0% yield. CB7 (Ely, Soham) is the cheapest entry at £342,225 with the lowest 30% deposit of £102,668, while CB6 (Ely, Littleport) has held its value best over five years. Expect a settled, single-digit-turnover market, and in CB6 a slower sale on exit, currently a buyer's market at around 435 days.
Beyond what is listed openly, experienced investors often buy below asking through off-market property and below market value properties, which is worth exploring in the cooler CB6 market. To see what is available now, browse investment property or buy-to-let homes for sale.
Ready to buy property?
Access off-market investment properties with an average 8%+ annual gross yield (beating the UK's typical 3-5%).
Get property alerts