Swansea is a city on the south coast of Wales. Average sold prices across Swansea sit at £205,243 on the HM Land Registry House Price Index, 3.8% below the Wales average of £213,240. That makes Swansea one of the more affordable city markets in Wales, cheaper on the Land Registry index than Cardiff or Newport, with a sold price that has risen from £43,573 in January 1995. For an investor, the appeal is a low price base paired with rental yields that reach 8.6% in the cheapest postcode.
Swansea is a two-speed market within a single city. SA1 (City Centre, Maritime Quarter) carries a £158,897 asking price, while SA3 (Mumbles, Gower) reaches £427,201. That £268,304 spread, the widest in the city, separates a high-yielding city-centre and student market from the premium coastal stock on the Gower peninsula. The pattern that holds across Swansea is the familiar one: the cheaper postcodes carry the higher yields. This guide covers the City and County of Swansea (ONS code W06000011) across the SA1 to SA8 postcodes, with SA99 a non-geographic delivery code that carries no property data.
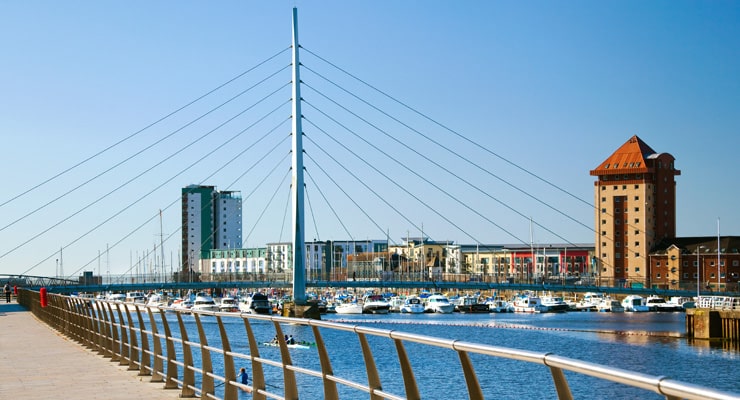
Swansea is Wales's second city, on the South Wales coast roughly 40 miles west of Cardiff at the mouth of the River Tawe. The wider Cardiff buy-to-let market to the east anchors the South Wales corridor, while Swansea's own draw is the university, the seafront, and the Gower coastline.
Article updated: July 2026
Why Invest in Swansea?
Swansea's population held broadly flat between the 2011 and 2021 censuses, easing 0.22% from 239,023 to 238,490 residents. A stable population is a different signal from a fast-growing one. It points to a settled tenant base rather than the surge-and-retreat of a boomtown, and in Swansea that base is anchored by Swansea University, which enrolled close to 19,000 students in 2024/25 across its Singleton Park campus in SA2 and the Bay Campus on the eastern edge of the city. The wider appeal rests on the seafront, the Gower peninsula on the doorstep, and a cost of living well below Cardiff's.
The local employment rate of 67.5% sits below the Great Britain rate of 75.6%, and unemployment at 9.9% is above the national picture. This is an honest part of the Swansea story: it is a lower-wage, higher-unemployment market than a Chester or a Cardiff, and rental demand here leans more on students and the benefit-supported end than on a deep professional tenant base. Swansea's economy concentrates in human health and social work (18.5% of employee jobs), wholesale and retail (13.9%), public administration and defence (13.0%), and education (10.2%), reflecting the city's role as a public-sector and university hub for South West Wales.
Median gross annual earnings across Swansea are £36,586, which is just above the Wales regional median of £36,353 but 6.5% below the Great Britain median of £39,125. Lower local wages cap how far open-market rents can stretch, which is part of why Swansea's yields look high against its prices: the entry cost is low, but so is the tenant's ceiling. The combination of a large student population and a sizeable benefit-supported rental segment is what holds the yield up.
Swansea Economic Summary
- Population (Swansea): 238,490 (2021 Census). Change of -0.22% from 2011.
- Median annual salary: £36,586 (local), £36,353 (Wales), £39,125 (Great Britain)
- Employment rate: 67.5% (local), 75.6% (Great Britain)
- Unemployment rate: 9.9% (local)
- Key employment sectors: Human health and social work, wholesale and retail, public administration and defence, education, accommodation and food
Source: ONS Census 2021, Nomis Labour Market Profile (ASHE 2025, Employment Oct 2024-Sep 2025)
Regeneration and Investment in Swansea
Swansea is in the middle of a regeneration programme the council values at over £1 billion, led by the £135 million Copr Bay scheme and a 20-year, £750 million partnership with developer Urban Splash. The investment is concentrated on the seafront and the city centre, reconnecting the two and adding new homes, offices, and leisure space to a city that has lacked them.
- Copr Bay (Phase 1 complete, £135 million): The first phase delivered the 3,500-capacity Swansea Arena, 33 affordable homes, a 1.1-acre coastal park, and a landmark bridge linking the city centre to the seafront, opening in 2022 and drawing over 230,000 visitors to the arena. Phase 2, Porth Copr, is in planning and will add around 300,000 sq ft of Grade A office and mixed-use space on the former St David's Shopping Centre site. Updates at Copr Bay Swansea.
- Swansea City Waterfront (Masterplanning, £750 million partnership): A 20-year agreement between Swansea Council and Urban Splash covers seven strategic sites, with the City Waterfront district set to transform the Civic Centre seafront into a mixed-use destination of up to 600 new homes alongside commercial and leisure space. The wider partnership also covers the Hafod Copperworks riverside neighbourhood and St Thomas Riverfront. Updates at Urban Splash.
- Swansea Bay City Deal (Active, £1.3 billion): A 15-year regional programme across Swansea, Carmarthenshire, Neath Port Talbot, and Pembrokeshire, expected to create around 10,000 jobs in energy, smart manufacturing, innovation, and life sciences. Swansea-specific projects include the 71/72 Kingsway Digital District, a seven-storey office scheme with space for 600 tech and creative jobs that the council estimates adds £32.6 million a year to the local economy. Updates at Welsh Government.
Source: Office for National Statistics - Population for Swansea

Swansea Property Market Analysis
Average property prices in Swansea have risen 371.0% since January 1995, from £43,573 to £205,243. The sections below break down that journey cycle by cycle, then drill into current postcode-level data for sold prices, price per square foot, asking prices, growth trends, and monthly transaction volumes.
When was the last house price crash in Swansea?
Swansea's sold prices are recorded by HM Land Registry at the level of the City and County of Swansea local authority. The Land Registry House Price Index tracks average prices from January 1995 to March 2026, covering 31 years of market cycles.
The 1995 to 2008 boom: Swansea started at £43,573 in January 1995. Prices climbed steadily through the late 1990s, then accelerated through the early 2000s, reaching £128,022 by March 2006. The market kept rising into the credit boom and peaked at £149,858 in January 2008, a near three-and-a-half-fold increase on the 1995 starting point.
2008 to 2012, the financial crisis and a long correction: Swansea's downturn was both deeper and longer than many English markets. Prices fell from the January 2008 peak of £149,858 to a trough of £117,230 in February 2012, a decline of 21.8% spread over four years. The worst single year-on-year reading was -11.0% in December 2009. Where many markets bottomed in 2009 and turned, Swansea ground lower for a further two years, reflecting a regional economy slower to rebound.
2012 to 2019, a slow climb back: From the February 2012 trough, Swansea recovered gradually rather than sharply. Prices did not surpass the January 2008 pre-crash peak until December 2019, when the average reached £150,459. That recovery took almost twelve years, one of the longer round-trips of any UK city and a marker of how heavily the crash sat on the local market.
2020 to 2022, the pandemic surge: The stamp duty holiday and a shift towards coastal and value markets finally moved Swansea decisively. Prices rose from £148,297 in June 2020 to £160,307 by December 2020, then ran to £184,177 by December 2021, a 14.9% annual gain that was Swansea's strongest in the series. By December 2022 the average reached £193,267.
The 2023 rate shock: Higher mortgage rates flattened the market. Prices held at £190,296 in June 2023 and £193,023 by December 2023, recording a marginal -0.1% annual change. Swansea's lower price base meant it had less far to fall than higher-value markets.
2024 to present: Prices reached £196,302 by December 2024 and an all-time high of £211,261 in November 2025, before easing back to £205,243 by the latest March 2026 reading. The current price is 37.0% above the January 2008 pre-crash peak.
Long-term growth summary:
- 5 years (March 2021 to March 2026): 24.7% growth (£164,539 to £205,243)
- 10 years (March 2016 to March 2026): 54.9% growth (£132,523 to £205,243)
- 15 years (March 2011 to March 2026): 71.8% growth (£119,477 to £205,243)
- 20 years (March 2006 to March 2026): 60.3% growth (£128,022 to £205,243)
- 30 years (January 1995 to March 2026): 371.0% growth (£43,573 to £205,243)
Swansea's 21.8% crash was deeper than the England fall, and the recovery to its pre-crash peak took almost twelve years. That long correction is the backdrop to the high yields available today: a buyer entering now does so at prices that took longer than most to recover and still sit just below the Wales average. An investor who bought at the exact peak in January 2008 would be sitting on a 37.0% gain on the Land Registry average eighteen years later.
- All property types
- Detached
- Semi-detached
- Terraced
- Flats
- All property types
- Detached
- Semi-detached
- Terraced
- Flats
Sold House Prices in Swansea
The average sold price across all property types in Swansea is £205,243, which is 3.8% below the Wales average of £213,240 as of March 2026. That discount runs across every property type, but it is deepest for flats. Flats sell at 13.4% below the Wales average, while detached houses are 2.1% below. The pattern is consistent with an affordable Welsh city: there is no premium tier of stock pulling the average up, and the cheapest end, the flats, is where the discount and the yield are both at their widest.
| Property Type | Swansea Average | Wales Average | Difference |
|---|---|---|---|
| Detached houses | £327,567 | £334,744 | -2.1% |
| Semi-detached houses | £210,454 | £212,913 | -1.2% |
| Terraced houses | £168,769 | £170,907 | -1.3% |
| Flats and maisonettes | £109,316 | £126,165 | -13.4% |
| All property types | £205,243 | £213,240 | -3.8% |
Detached houses at £327,567 carry a 2.1% discount to the Wales average of £334,744. The detached stock concentrates on the Gower side of the city in SA3, where coastal and village homes around Mumbles and the peninsula command Swansea's highest prices, and in the suburban SA2 and SA8 outcodes. Annual growth of 1.6% points to steady rather than rapid demand at the top of the market.
Semi-detached houses at £210,454 sit 1.2% below the Wales average of £212,913, the smallest discount of the four types, and closely track the city-wide average. These are the workhorse family homes of suburban Swansea, spread across SA2, SA4, and SA5, and they posted the strongest annual growth of any type at 2.4%.
Terraced houses at £168,769 are 1.3% below the Wales average of £170,907. The terraced stock is concentrated in the older city-centre and valley outcodes, particularly SA1, where Victorian and Edwardian terraces dominate, and SA5 to the north. With 2.4% of the SA1 stock detached against nearly 39% terraced, this is the natural buy-to-let pool, and terraced prices grew 1.9% over the year.
Flats and maisonettes at £109,316 show the deepest discount at 13.4% below the Wales average of £126,165. Swansea's flat stock is a mix of city-centre conversions and the purpose-built blocks around the SA1 Maritime Quarter and marina, and it is the single cheapest way into the city. Annual change of -3.6% confirms a softer market for flats, the one property type to fall over the year.
Price Per Square Foot in Swansea
Swansea's price per square foot runs from £163 in SA1 to £319 in SA3, a £156 gap that maps almost exactly onto the city's coastal premium. Measuring by the square foot controls for how big the homes are, so it compares the locations themselves rather than the house types. SA3 (Mumbles, Gower) commands the highest rate, reflecting the coastal village stock on the peninsula, while the city centre and northern outcodes sit at the value end.
| Rank | Area | Price Per Sq Ft |
|---|---|---|
| 1 | SA1 (City Centre, Maritime Quarter) | £163 |
| 2 | SA5 (Fforestfach, Penlan) | £166 |
| 3 | SA6 (Morriston, Clydach) | £193 |
| 4 | SA8 (Pontardawe) | £219 |
| 5 | SA4 (Gorseinon, Loughor) | £225 |
| 6 | SA7 (Llansamlet, Birchgrove) | £230 |
| 7 | SA2 (Sketty, Uplands) | £244 |
| 8 | SA3 (Mumbles, Gower) | £319 |
SA1 at £163 per square foot is the cheapest space in Swansea despite being the city centre, because its flat-heavy stock pulls the per-square-foot figure down even where headline prices for houses run higher. SA5 at £166 is barely above it, covering Fforestfach, Penlan, and the northern residential areas where post-war and terraced housing keeps the bricks-and-mortar rate down.
SA3 at £319 per square foot tops the table by a clear margin, around 96% above SA1. When buyers pay that much for space, they are paying for the Gower coastline, the Mumbles seafront, and the village character of the peninsula. The premium here is location, not size, which is exactly what the per-square-foot measure is built to show.
For Sale Asking Prices in Swansea
SA1 at £158,897 and SA3 at £427,201 sit 168.9% apart, the widest asking-price gap in the city. That hierarchy follows the sold-price and per-square-foot picture: the city centre and the value outcodes at the bottom, the Gower coast at the top. The mean asking price across the eight priced Swansea postcodes is £251,779.
| Rank | Area | Asking Price |
|---|---|---|
| 1 | SA1 (City Centre, Maritime Quarter) | £158,897 |
| 2 | SA5 (Fforestfach, Penlan) | £175,203 |
| 3 | SA6 (Morriston, Clydach) | £192,092 |
| 4 | SA7 (Llansamlet, Birchgrove) | £237,407 |
| 5 | SA8 (Pontardawe) | £239,949 |
| 6 | SA4 (Gorseinon, Loughor) | £269,559 |
| 7 | SA2 (Sketty, Uplands) | £313,927 |
| 8 | SA3 (Mumbles, Gower) | £427,201 |
SA1 at £158,897 is the cheapest postcode in Swansea and the only one whose asking price sits below the city-wide Land Registry sold average of £205,243. For an investor on a fixed budget, the city centre offers the most property for the money and the lowest barrier to entry, which is why it also carries the top yield in the city.
SA3's £427,201 asking price is the city's outlier. At 2.7 times SA1's figure, the Gower postcode is owner-occupier and second-home territory rather than a yield play. The five value outcodes from SA1 to SA8 all sit below the £251,779 city mean, and the rental data in the sections below confirms where the income return concentrates.

House Price Growth in Swansea
Every Swansea postcode posted positive five-year growth, from 17.6% in SA1 to 30.6% in SA7, even where shorter-term readings turned negative. The five-year column is uniformly green because all of Swansea rode the post-2020 surge. The one-year and three-year columns split the city: the northern and value outcodes held up, while SA3 and SA6 gave some ground after the recent easing.
| Area | 1 Year | 3 Years | 5 Years |
|---|---|---|---|
| SA7 (Llansamlet, Birchgrove) | 2.2% | 5.2% | 30.6% |
| SA5 (Fforestfach, Penlan) | 7.6% | 13.4% | 29.6% |
| SA2 (Sketty, Uplands) | -0.3% | 8.4% | 26.2% |
| SA4 (Gorseinon, Loughor) | -1.8% | 7.7% | 26.1% |
| SA8 (Pontardawe) | -3.6% | 9.8% | 24.5% |
| SA6 (Morriston, Clydach) | -2.9% | 9.7% | 24.1% |
| SA1 (City Centre, Maritime Quarter) | 3.7% | 8.1% | 17.6% |
| SA3 (Mumbles, Gower) | -8.9% | -5.8% | 10.2% |
SA7 leads on the five-year measure at 30.6%, with SA5 just behind at 29.6%. SA5 (Fforestfach, Penlan) is the steadier of the two, the only postcode positive across all three windows by a clear margin, pairing the strongest recent one-year reading at 7.6% with solid medium-term growth. Both combine low asking prices with steady local demand, and that affordability has carried the gains.
SA3 (Mumbles, Gower) sits at the bottom of the table on the five-year window at 10.2% and is the only postcode negative over both one and three years, down 8.9% and 5.8%. The Gower premium postcode rose furthest in the 2020 to 2022 surge and has given back the most since, a reminder that the most expensive stock in a city is often the most exposed when the market cools.
Monthly Property Sales in Swansea
Transaction volumes range from 8 sales a month in SA8 to 40 in both SA1 and SA4, with turnover rates from 12% to 31%. The busiest postcodes are also the most affordable, where a deeper pool of mid-priced stock changes hands more often. The premium SA3 sits at the quiet end of the table.
| Area | Sales Per Month | Turnover | Asking Price |
|---|---|---|---|
| SA1 (City Centre, Maritime Quarter) | 40 | 30% | £158,897 |
| SA4 (Gorseinon, Loughor) | 40 | 25% | £269,559 |
| SA2 (Sketty, Uplands) | 29 | 18% | £313,927 |
| SA6 (Morriston, Clydach) | 23 | 21% | £192,092 |
| SA3 (Mumbles, Gower) | 21 | 8% | £427,201 |
| SA5 (Fforestfach, Penlan) | 20 | 31% | £175,203 |
| SA7 (Llansamlet, Birchgrove) | 12 | 25% | £237,407 |
| SA8 (Pontardawe) | 8 | 12% | £239,949 |
SA1 and SA4 are the busiest markets at 40 sales a month each, the city-centre and Gorseinon postcodes where a deep pool of mid-priced stock keeps transactions flowing. On turnover, the share of the local stock that changes hands in a year, SA5 leads at 31% with SA1 just behind at 30%. For a buy-to-let investor, high turnover signals an easy exit: those outcodes have the depth of buyers to sell into when the time comes.
SA3 has the lowest turnover at 8% despite 21 sales a month, because its larger, more expensive housing stock means a similar number of monthly sales is a far smaller share of the total. SA8 at Pontardawe is the quietest market overall, with just 8 sales a month and 12% turnover, where a thinner pool of buyers can leave a property on the market longer.
How Long Properties Take to Sell in Swansea
SA1 clears fastest at about 80 days, while SA3 on the Gower sits for roughly 380, almost five times as long. Time on market measures how long a typical sale takes; months of unsold stock measures how much for-sale supply is queued at the current rate of sales. The gap between Swansea's fastest and slowest postcodes is one of the widest in any city we cover, and it is a real holding cost on exit.
| Area | Avg Days to Sell | Months of Unsold Stock | Market |
|---|---|---|---|
| SA1 (City Centre, Maritime Quarter) | 80 | 2.6 | Seller's market |
| SA7 (Llansamlet, Birchgrove) | 109 | 3.6 | Seller's market |
| SA4 (Gorseinon, Loughor) | 138 | 4.5 | Seller's market |
| SA5 (Fforestfach, Penlan) | 145 | 4.8 | Seller's market |
| SA6 (Morriston, Clydach) | 152 | 5.0 | Seller's market |
| SA2 (Sketty, Uplands) | 179 | 5.9 | Seller's market |
| SA8 (Pontardawe) | 254 | 8.3 | Balanced market |
| SA3 (Mumbles, Gower) | 380 | 12.5 | Buyer's market |
SA1's 2.6 months of unsold stock means a city-centre property finds a buyer far quicker than the SA3 figure of 12.5. That speed matters as much as the yield: SA1 leads on income and on liquidity at the same time, an unusual pairing. At the other end, a buyer in SA3 should plan for a long sale, with the most expensive stock in Swansea also the slowest to move.
What Type of Property Can You Buy in Swansea?
Detached homes are the largest single category in six of the eight Swansea postcodes, peaking at 67.6% of stock in SA8, while SA1 stands apart as 38.7% terraced and 21.5% flats. The mix shapes which strategy fits each postcode. The figures below are drawn from 2021 Census records for each postcode.
| Area | Detached | Semi-detached | Terraced | Flats |
|---|---|---|---|---|
| SA1 (City Centre, Maritime Quarter) | 8.9% | 30.7% | 38.7% | 21.5% |
| SA2 (Sketty, Uplands) | 49.6% | 34.1% | 8.5% | 7.7% |
| SA3 (Mumbles, Gower) | 62.8% | 22.0% | 6.1% | 6.3% |
| SA4 (Gorseinon, Loughor) | 55.6% | 30.1% | 10.5% | 3.0% |
| SA5 (Fforestfach, Penlan) | 50.0% | 29.3% | 16.5% | 4.0% |
| SA6 (Morriston, Clydach) | 59.0% | 25.5% | 11.3% | 3.3% |
| SA7 (Llansamlet, Birchgrove) | 41.1% | 38.0% | 17.1% | 3.8% |
| SA8 (Pontardawe) | 67.6% | 26.7% | 2.8% | 2.9% |
SA1 stands apart as the postcode where smaller units dominate, with terraced houses at 38.7% and flats at 21.5%, the highest flat share in the city by a wide margin and the one outcode where detached homes are not the largest category. That is the stock that drives the buy-to-let market: city-centre flats suit single lets and student sharers, while the terraces serve lower-cost family and shared tenancies. It lines up with SA1 carrying the lowest asking price and the highest yield.
SA8 at Pontardawe is the most detached-dominated postcode at 67.6%, with terraced and flat stock together under 6%. The valley and edge-of-city outcodes are weighted towards owner-occupier family houses rather than the smaller units that generate rental income, which is why the higher yields cluster back in SA1, SA5, and SA6.
The flats figure covers both purpose-built blocks and conversions; a small share of non-standard dwellings is excluded, so rows may not total 100%.

Swansea Rental Market Analysis
Monthly rents in Swansea range from £864 in SA6 to £1,333 in SA3, with gross rental yields running from 3.7% up to 8.6% across the postcodes with rental data. For investors asking is buy to let worth it in Swansea, the sections below break down rents, yields, and tenant affordability postcode by postcode. If you are weighing how to build a property portfolio in South Wales, Swansea offers some of the highest headline yields in the country off a low price base, balanced against a lower-wage local economy. Browse current buy-to-let homes for sale across the region.
Average Rent & Gross Rental Yields in Swansea
Gross rental yields in Swansea range from 3.7% in SA3 to 8.6% in SA1. The cheapest postcode delivers by far the highest yield and the most expensive delivers the lowest. SA1 combines the lowest asking price in the city with a £1,134 monthly rent to produce an 8.6% gross yield, one of the highest single-postcode yields on any of our location guides.
| Area | Average Monthly Rent | Asking Price | Gross Yield |
|---|---|---|---|
| SA1 (City Centre, Maritime Quarter) | £1,134 | £158,897 | 8.6% |
| SA5 (Fforestfach, Penlan) | £875 | £175,203 | 6.0% |
| SA6 (Morriston, Clydach) | £864 | £192,092 | 5.4% |
| SA2 (Sketty, Uplands) | £1,243 | £313,927 | 4.8% |
| SA4 (Gorseinon, Loughor) | £895 | £269,559 | 4.0% |
| SA3 (Mumbles, Gower) | £1,333 | £427,201 | 3.7% |
| SA7 (Llansamlet, Birchgrove) | Not enough data | £237,407 | Not enough data |
| SA8 (Pontardawe) | Not enough data | £239,949 | Not enough data |
Two of Swansea's eight priced postcodes, SA7 (Llansamlet, Birchgrove) and SA8 (Pontardawe), carry too few rental listings at any one time to publish a reliable rent or yield, so they are shown for completeness without a figure. Across the six postcodes with rental data, SA1 at 8.6% is the standout, pairing the lowest asking price with a strong £1,134 monthly rent. The city centre draws students from Swansea University and young professionals into the Maritime Quarter flats and city terraces, and that demand against a £158,897 entry is what lifts the yield so far above the rest of the city. A 30% deposit of £47,669 gets an investor into the highest-yielding postcode.
SA3 at 3.7% sits at the bottom of the yield table even though it commands the highest rent in Swansea at £1,333. The £427,201 asking price means the income return is compressed: in the Gower postcode the premium price does far more for the headline rent than for the yield. SA2 at 4.8% follows the same logic, with a strong £1,243 rent held back by a £313,927 asking price.
Gross Rental Yield by Postcode
Is Swansea Rent High?
Monthly rents in Swansea consume between 28.3% and 43.7% of the local median gross monthly salary. The widely cited threshold for rent affordability is 30% of gross income. The three value postcodes, SA4, SA5, and SA6, sit at or below that line, while the city-centre and premium postcodes sit above it, a wider spread than in many cities and a reflection of Swansea's lower local wages against rents that the student and city-centre market can sustain.
The median gross weekly salary in Swansea is £703.60, which equates to £3,049 per month or £36,586 per year. This is just above the Wales median of £36,353 a year but below the Great Britain figure. Data from the Nomis Labour Market Profile (ASHE 2025).
| Rank | Area | Rent as % of Income |
|---|---|---|
| 1 | SA3 (Mumbles, Gower) | 43.7% |
| 2 | SA2 (Sketty, Uplands) | 40.8% |
| 3 | SA1 (City Centre, Maritime Quarter) | 37.2% |
| 4 | SA4 (Gorseinon, Loughor) | 29.4% |
| 5 | SA5 (Fforestfach, Penlan) | 28.7% |
| 6 | SA6 (Morriston, Clydach) | 28.3% |
| - | SA7 (Llansamlet, Birchgrove) | Not enough data |
| - | SA8 (Pontardawe) | Not enough data |
SA6 at 28.3% is the most affordable for tenants on the local median salary, with SA5 and SA4 close behind under or around the 30% line. For a landlord, rents that sit within reach of local incomes correlate with lower void periods and fewer arrears, because tenants who are not stretched tend to stay longer.
SA3 at 43.7% is the least affordable on the median salary, but context matters: the Gower commands Swansea's highest rents, and tenants in Mumbles and the peninsula villages are typically professional or dual-income households rather than single earners on the city median. SA1 at 37.2% reads high too, but a large share of its tenant base is students sharing the rent across a household rather than one earner carrying it.
How Big Is Swansea's Private Rented Sector?
The private rented sector is deepest in SA1, where it accounts for 23.4% of households, and thinnest in SA4 at 8.7%. The share of homes already rented privately is a guide to how established and tested the local lettings market is. The table below shows household tenure by postcode.
| Area | Owned Outright | Owned with Mortgage | Private Rented | Social Rented |
|---|---|---|---|---|
| SA1 (City Centre, Maritime Quarter) | 27.4% | 24.8% | 23.4% | 23.5% |
| SA7 (Llansamlet, Birchgrove) | 37.0% | 41.2% | 15.3% | 6.2% |
| SA6 (Morriston, Clydach) | 49.8% | 29.7% | 12.8% | 7.6% |
| SA2 (Sketty, Uplands) | 49.4% | 32.3% | 10.5% | 7.5% |
| SA3 (Mumbles, Gower) | 57.8% | 24.9% | 10.5% | 6.1% |
| SA5 (Fforestfach, Penlan) | 43.7% | 32.3% | 10.4% | 12.6% |
| SA4 (Gorseinon, Loughor) | 49.8% | 35.0% | 8.7% | 6.2% |
| SA8 (Pontardawe) | 58.2% | 28.1% | 8.3% | 4.9% |
SA1 has the largest private rented sector in Swansea at 23.4%, more than double the share in most other postcodes, and it pairs that with the city's smallest owner-occupier base. A deep rented sector points to an active, established lettings market and a wide pool of existing tenants, which is exactly the profile you want behind the city's highest yield. SA1 also carries the highest social-rented share at 23.5%, marking it out as the city's most tenanted, least owner-occupied postcode.
Across SA1 and SA2, where rental listings are deepest, the balance currently favours landlords. SA1 had around 138 homes on the rental market and SA2 around 63, each taking under three weeks to let on average, which points to strong tenant demand rather than a glut. The Gower and valley outcodes have too few rental listings at any one time to read with the same confidence.
Local Housing Allowance Rates in Swansea
Most of Swansea falls within the Swansea Broad Rental Market Area, where Local Housing Allowance runs from £86.30 a week for a shared room to £188.71 a week for a four-bedroom home, with SA8 (Pontardawe) sitting in the separate Neath Port Talbot area on lower rates. Local Housing Allowance caps the housing benefit a tenant can receive, so for that part of the market it sets an effective rent floor for landlords. The rates below cover the Swansea area; to check the rate for a specific address, you can use the government's official Local Housing Allowance calculator.
| Property Size | Weekly LHA Rate | Monthly Equivalent |
|---|---|---|
| Shared accommodation | £86.30 | £374 |
| 1 bedroom | £120.82 | £524 |
| 2 bedrooms | £126.58 | £549 |
| 3 bedrooms | £138.08 | £599 |
| 4 bedrooms | £188.71 | £818 |
The two-bedroom Swansea BRMA rate of £126.58 a week works out at about £549 a month, well below the £864 to £1,333 open-market rents recorded across the city's postcodes. A benefit-backed tenancy therefore sits under Swansea's market rents, and the stock that fits within these rates concentrates in the lower-priced SA1, SA5, and SA6 outcodes. SA8 at Pontardawe falls in the Neath Port Talbot Broad Rental Market Area, where the equivalent rates are lower, from £94.74 a week for a one-bedroom to £132.33 for a four-bedroom, so a landlord letting to the benefits market there should check the local figure rather than assume the Swansea rate.
Buy-to-Let Considerations
Are House Prices High in Swansea? Price-to-Earnings Ratios
Purchasing a property in Swansea requires between 4.3 and 11.7 times the median annual salary. This is based on the Nomis Labour Market Profile for Swansea showing the median gross annual income for Swansea residents is £36,586.
The national benchmark for price-to-earnings is 5.5x (the Wales average sold price of £213,240 divided by the Great Britain median annual salary of £39,125). Three of Swansea's eight priced postcodes sit below that benchmark, meaning they are more affordable relative to local incomes than the Wales average is relative to national incomes.
| Rank | Area | Price-to-Earnings Ratio |
|---|---|---|
| 1 | SA1 (City Centre, Maritime Quarter) | 4.3x |
| 2 | SA5 (Fforestfach, Penlan) | 4.8x |
| 3 | SA6 (Morriston, Clydach) | 5.3x |
| 4 | SA7 (Llansamlet, Birchgrove) | 6.5x |
| 5 | SA8 (Pontardawe) | 6.6x |
| 6 | SA4 (Gorseinon, Loughor) | 7.4x |
| 7 | SA2 (Sketty, Uplands) | 8.6x |
| 8 | SA3 (Mumbles, Gower) | 11.7x |
SA1 at 4.3x is the most affordable entry in Swansea and one of the lowest price-to-earnings ratios on any of our guides. A property at little over four times local earnings, paired with the city's top yield, is what makes the city-centre postcode the clearest income play in Swansea.
SA3 at 11.7x sits well above the national benchmark. At nearly twelve times the local median salary, the Gower postcode is firmly in premium territory, bought by households trading down from more expensive parts of Britain or buying second homes on the coast rather than by local first-time buyers. For an investor, that ratio is the warning sign behind SA3's 3.7% yield.
Deposit Requirements in Swansea
A 30% deposit on a buy-to-let property in Swansea ranges from £47,669 in SA1 to £128,160 in SA3. The gap between the cheapest and most expensive deposit is £80,491, more than enough to fund a second deposit in SA1 outright. For investors comparing Swansea with other South Wales markets, the city-centre deposit is among the lowest entry points of any major Welsh city.
Beyond the deposit, the stamp duty calculation and other buy-to-let running costs affect the total capital required.
| Rank | Area | 30% Deposit Required |
|---|---|---|
| 1 | SA1 (City Centre, Maritime Quarter) | £47,669 |
| 2 | SA5 (Fforestfach, Penlan) | £52,561 |
| 3 | SA6 (Morriston, Clydach) | £57,627 |
| 4 | SA7 (Llansamlet, Birchgrove) | £71,222 |
| 5 | SA8 (Pontardawe) | £71,985 |
| 6 | SA4 (Gorseinon, Loughor) | £80,868 |
| 7 | SA2 (Sketty, Uplands) | £94,178 |
| 8 | SA3 (Mumbles, Gower) | £128,160 |
SA1 is the cheapest way into Swansea at a £47,669 deposit, and it buys the highest yield and the fastest-selling stock in the city at the same time. Stepping up to SA5 costs under £5,000 more and moves the money into Fforestfach and Penlan, where a 6.0% yield comes with the strongest one-year growth in the city at 7.6%. The first three rungs of the ladder, SA1, SA5, and SA6, all sit under £58,000 at 30% down.
At the other end, SA3 demands £128,160, nearly three times the SA1 deposit, for the lowest yield in Swansea at 3.7%. That capital buys Gower coastline and the strongest rents in the city, but it is a capital-growth and lifestyle play rather than an income one, and its 10.2% reading over five years has lagged the rest of Swansea.

What the Swansea Data Tells Buy-to-Let Investors
In Swansea the cheapest way in is also the highest-yielding, the fastest-selling, and the most affordable against local wages. SA1 has the top yield at 8.6%, the lowest asking price for an investment property in Swansea at £158,897, the quickest sale at about 80 days, and a price-to-earnings ratio of just 4.3x. A 30% deposit there is £47,669, the lowest in the city, for a home renting at £1,134 a month. It is rare for one postcode to lead on income, liquidity, and affordability together.
SA5 and SA6 are the next rungs of the value ladder. SA5 (Fforestfach, Penlan) pairs a 6.0% yield with the strongest one-year growth in the city at 7.6% and the highest turnover at 31%. SA6 (Morriston, Clydach) offers a 5.4% yield with the most affordable rents against local income at 28.4%. Both sit under £58,000 at 30% down, keeping the entry cost low while spreading exposure beyond the city centre.
SA2 (Sketty, Uplands) sits in the middle, with a 4.8% yield, the second-strongest rents in the city, and a settled suburban tenant base near the university's Singleton Park campus. SA3 (Mumbles, Gower) is the outlier: the highest rent at £1,333 but the lowest yield at 3.7%, the longest sale at 380 days, and an 11.7x price-to-earnings ratio. It is a capital-growth and coastal-lifestyle proposition, not an income one. Buyers who want to come in below asking, particularly in the slower premium postcodes, tend to work the off-market property in Swansea route.
Swansea has no England-style selective licensing scheme for private landlords, though all Welsh landlords must register and, where they manage the property themselves, license through Rent Smart Wales. With its low price base, large student population, and over £1 billion of regeneration underway, Swansea reads as a yield-led market: high headline returns off cheap stock, balanced against a lower-wage local economy and a recent history of a deep, slow crash. For investors prioritising income, the city-centre and value postcodes are where that thesis concentrates.
How Swansea Compares
Swansea's mean asking price of £251,779 is the lowest of five South Wales and South West locations compared here, and its top yield of 8.6% is the highest in the group. The comparison below places Swansea alongside four nearby markets, each with a different investor profile. The mean asking price and mean monthly rent are simple averages across all postcodes with data, and the top gross yield is the single highest postcode yield in each location.
| Location | Mean Asking Price | Mean Monthly Rent | Mean Gross Yield | Top Yield (postcode) |
|---|---|---|---|---|
| Swansea | £251,779 | £1,057 | 5.0% | 8.6% (SA1) |
| Wrexham | £261,327 | £821 | 3.8% | 4.3% (LL11, LL14) |
| Newport | £276,613 | £1,012 | 4.4% | 5.1% (NP11, NP19) |
| Cardiff | £316,904 | £1,202 | 4.6% | 7.3% (CF10) |
| Bristol | £373,692 | £1,655 | 5.3% | 6.9% (BS7) |
Swansea is the cheapest location in this comparison at £251,779 mean asking price and tops the table on yield at 8.6%, ahead of Cardiff at 7.3% and Bristol at 6.9% across the Severn. For an investor whose priority is headline income off a low entry, Swansea leads this group on both counts at once.
For investors weighing the alternatives, Cardiff brings capital-city employment and the deepest student market in Wales, with a 7.3% top yield of its own on higher prices. Newport at 5.1% and Wrexham at 4.3% sit lower on yield, with Wrexham also carrying the lowest rents in the group at £821 a month. Swansea's case is the combination its rivals lack: the lowest prices, the highest yield, and a large university market, set against a lower-wage economy and a slower-moving premium tier. For a data-led view across every UK market, see our guide to the highest-yielding areas.
Frequently Asked Questions
Is Swansea a good place to live for buy-to-let tenants?
It works for the right tenant base. Swansea is an affordable coastal city with a big university, a seafront, and the Gower peninsula on the doorstep, which makes it an easy place to rent in for students and younger renters. The honest caveat is the local economy: the employment rate is 67.5%, below the Great Britain figure, and wages are lower than in Cardiff, so a lot of the rental demand leans on students and the benefit-supported end rather than a deep professional tenant base.
For a landlord, that shapes where you buy. The city-centre and value postcodes, where the university and lower-cost stock are, hold tenants more reliably than the premium Gower, which is owner-occupier country. Rents that sit close to local incomes tend to mean longer tenancies and fewer arrears.
What are the best areas in Swansea for property investment?
The data splits between income and more settled suburban demand. If income is the priority, SA1 (City Centre and Maritime Quarter) is the clear leader: the cheapest entry at £158,897, the highest yield at 8.6%, and the fastest sale in the city. SA5 (Fforestfach, Penlan) and SA6 (Morriston, Clydach) are the next value rungs, with 6.0% and 5.4% yields and entry deposits under £58,000.
If you want a more settled suburban tenant base, SA2 (Sketty, Uplands) sits near the university's Singleton Park campus with a 4.8% yield. The Gower postcode SA3 (Mumbles, Gower) is the premium end at £427,201 and the lowest yield at 3.7%, so it leans towards capital growth and lifestyle rather than income.
Why are rental yields so high in Swansea?
It comes down to a low price base meeting steady rental demand. SA1 sells at £158,897 on average, less than many cities charge for a flat, while a typical rent there runs to £1,134 a month, which is what pushes the gross yield to 8.6%. The student population and a sizeable benefit-supported rental segment keep rents firm even though local wages are modest.
The flip side is worth understanding. Yields are high partly because prices are low for a reason: Swansea is a lower-wage market that took almost twelve years to recover from the 2008 crash. The income return is genuine, but it sits on a market with slower long-run capital growth than higher-priced cities, so the headline yield is doing more of the work.
Is there demand for student accommodation in Swansea?
Yes, and it is one of the main drivers of the city's rental market. Swansea University enrolled close to 19,000 students in 2024/25 across its Singleton Park campus in SA2 and the Bay Campus on the eastern edge of the city. Most student demand concentrates in SA1 and SA2, where city-centre flats and shared terraces suit single lets and sharers, though student lets come with summer voids and more hands-on management than a standard tenancy. For the purpose-built end of the market, see our guide to student property investment.
On the HMO side, a sample of current SA1 room adverts puts a double room with a shared bathroom at around £108 a week, with most between £89 and £127, and an ensuite double nearer £145. SA2 reads similarly, at about £113 a week for a shared-bathroom double. For how the numbers work on a shared house, see our HMO investment guide.
Can I find buy-to-let property under £160,000 in Swansea?
Yes, in the city centre. SA1 (City Centre, Maritime Quarter) averages £158,897, the only postcode below the city-wide sold average of £205,243, so the cheapest stock in Swansea is also the highest-yielding. Below that average, the route is by property type: flats across Swansea average £109,316 on the Land Registry index, and terraced houses £168,769, both well under the city figure. If a sub-£160,000 entry is the target, SA1 flats and city terraces are where to look, or explore below market value stock.
How has the Copr Bay regeneration affected Swansea property?
Its main effect so far is on the city centre and the seafront rather than on prices directly. Copr Bay's first phase opened in 2022 with the Swansea Arena, a coastal park, 33 affordable homes, and a bridge linking the centre to the seafront, and it has drawn over 230,000 visitors to the arena. That has lifted footfall and added new homes to SA1, which supports the city-centre rental market.
The larger story is still ahead. Phase 2 at Porth Copr and the £750 million Urban Splash partnership across seven sites, including up to 600 homes on the Civic Centre seafront, are in masterplanning rather than built. Any meaningful effect on prices from those is a multi-year story, but the fact that Phase 1 actually got delivered gives the wider programme credibility.
What are average house prices in Swansea?
The average sold price across Swansea is £205,243 on the Land Registry index, about 3.8% below the Wales average of £213,240 as of March 2026. Asking prices by postcode run from £158,897 in SA1 (City Centre, Maritime Quarter) up to £427,201 in SA3 (Mumbles, Gower), with a city-wide mean of £251,779. By type, detached homes average £327,567, semi-detached £210,454, terraced £168,769, and flats £109,316.
Through a buy-to-let lens, SA1 is the cheapest entry and the highest-yielding at 8.6%, while SA3 on the Gower is the dearest and lowest-yielding at 3.7%.
What are the Local Housing Allowance rates in Swansea?
Most of Swansea falls in the Swansea Broad Rental Market Area, so the city shares one set of rates. As of June 2026, Local Housing Allowance there runs at £86.30 a week for a shared room, £120.82 for a one-bed, £126.58 for two beds, £138.08 for three, and £188.71 for four. The exception is SA8 at Pontardawe, which sits in the Neath Port Talbot area on lower rates. The LHA figure is the most a tenant on housing support can claim towards rent, so for that part of the market it effectively sets a floor.
What type of property is most common in Swansea?
Detached houses, in most of the city. They are the largest single category in six of the eight postcodes, peaking at 67.6% of the stock in SA8 (Pontardawe). The exception is SA1 (City Centre, Maritime Quarter), which stands apart as 38.7% terraced and 21.5% flats, by far the highest flat share in Swansea. That smaller-unit stock in SA1 is the natural buy-to-let pool, which is part of why the city's highest yield sits there.
How do I buy an investment property in Swansea?
Decide first whether you are buying for income or for growth, because in Swansea that points you at opposite ends of the city. For income, SA1 (City Centre, Maritime Quarter) is the clearest play at £158,897 and an 8.6% yield, with SA5 and SA6 close behind on value. For capital growth and a coastal tenant base, the premium Gower postcode SA3 carries the highest rents but the lowest yield. Budget for a 30% deposit, which runs from £47,669 in SA1 to £128,160 in SA3.
Beyond what is listed openly, experienced investors often buy below asking through off-market property and BMV property channels, which matters more in Swansea's slower premium postcodes. To see what is available now, browse investment property or buy-to-let homes for sale.
Ready to buy property?
Access off-market investment properties with an average 8%+ annual gross yield (beating the UK's typical 3-5%).
Get property alerts