Caernarfon is a town in Gwynedd, north-west Wales. Average sold prices across Gwynedd sit at £201,202 on the HM Land Registry House Price Index, 5.6% below the Wales average of £213,240. That places this corner of North West Wales among the more affordable parts of the country, with a sold price that has climbed from £37,786 in January 1995. For a buyer looking at Caernarfon, the data reads differently from most of our city guides: it is a small, historic, tourism-led town, and PropertyData publishes no long-term rental yield for its two postcodes because holiday and short-term lets take up much of the lettable stock. What the figures do record is the sold-price history and its growth over time; a conventional buy-to-let yield is not measured here, which is a gap in the data rather than a reading on it.
Caernarfon does not carry the postcode-level rental and yield data we publish for larger cities. PropertyData returns no rent or yield figures for either of the town's two postcodes, LL54 and LL55, which is what you would expect in a market where a large share of the lettable stock is holiday accommodation and seasonal tourist lets rather than year-round tenancies. So this guide gives you the full sold-price, price-per-square-foot, asking-price, and growth picture the data does support, and is honest about the rental gap where it matters.
One thing to be clear about from the start. Caernarfon is a town within the county of Gwynedd, so the area-level figures on this page, the sold prices, the growth history, the population, and the earnings, are reported at the Gwynedd local-authority level and cover the whole county, not the town in isolation. Gwynedd stretches from the Llŷn Peninsula across Snowdonia, so its average blends Caernarfon with a wide rural and coastal hinterland. The postcode figures for LL54 and LL55 are specific to the Caernarfon area; the county figures are the honest, verifiable backdrop around them.
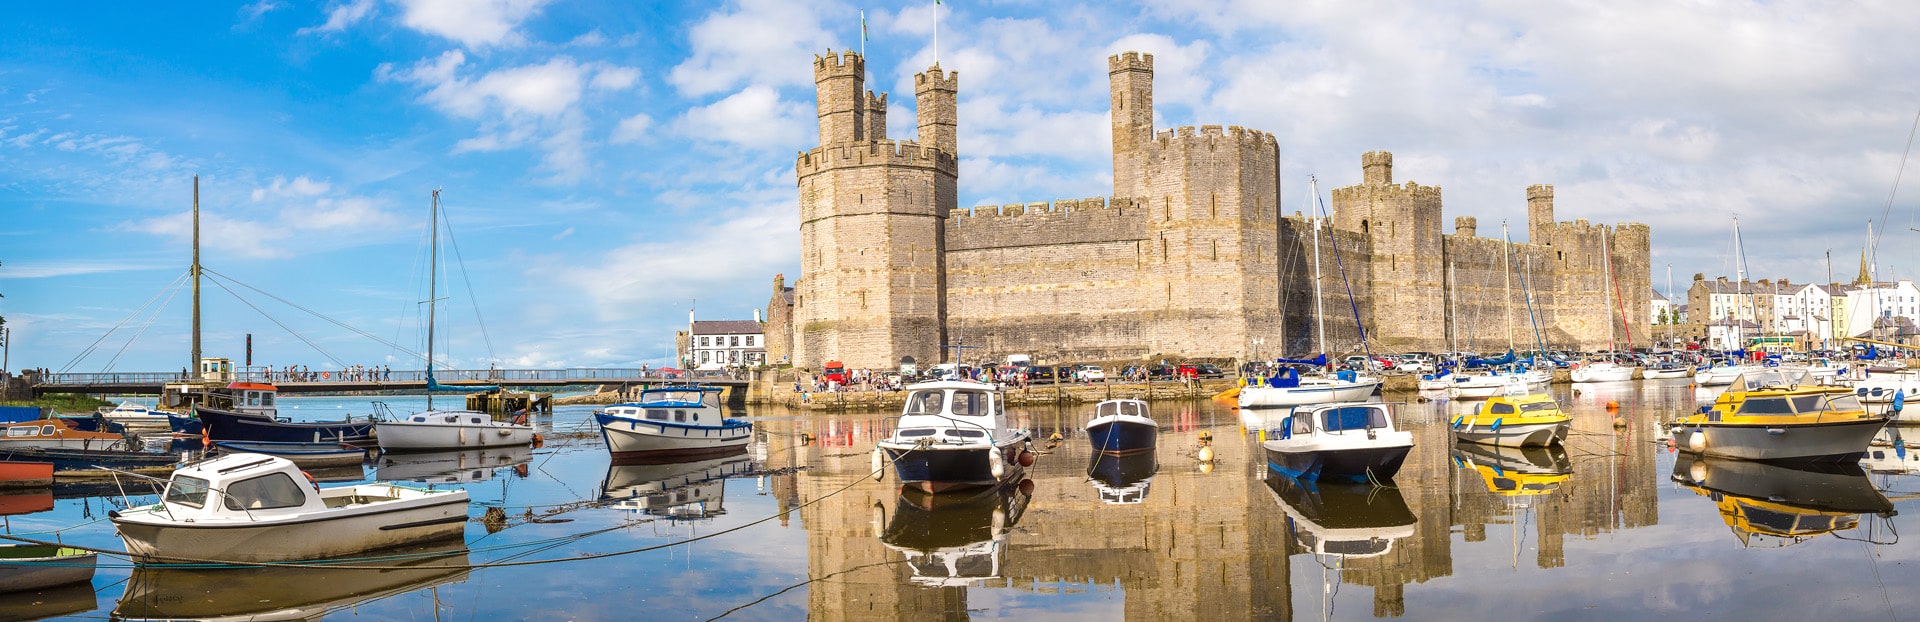
Caernarfon is a walled town on the Menai Strait in Gwynedd, best known for its UNESCO World Heritage castle and as one of the strongholds of the Welsh language. It sits at the gateway to Snowdonia, roughly nine miles south west of Bangor, and its economy leans heavily on tourism, public administration, and its role as the historic county town.
Article updated: July 2026
Why Invest in Caernarfon?
Gwynedd's population fell 3.68% between the 2011 and 2021 censuses, easing from 121,874 to 117,393 residents. A shrinking count is an honest signal for an investor to weigh: it points to a county losing working-age residents to larger centres rather than one drawing them in, and it is part of the reason the conventional rental market here is thin. What holds the property market up instead is tourism, which is also why the standard rental measures return nothing for LL54 and LL55. Caernarfon sits at the western edge of Snowdonia with a World Heritage castle at its centre, and the surrounding county draws millions of visitors a year, which pulls a large share of the local lettable stock into holiday and short-term accommodation and leaves LL54 and LL55 with no measurable long-term yield at all.
The Gwynedd employment rate of 72.4% sits below the Great Britain rate of 75.6%, and unemployment at 6.1% is a little above the national picture. This is a lower-wage, more seasonal economy than a Cardiff or a Chester: work concentrates in tourism, hospitality, public administration, and education, with Caernarfon serving as the administrative county town and Bangor's university and hospital nine miles away adding the largest employment anchor in the wider area. Welsh is the everyday language of much of the county, which shapes a settled, rooted community rather than a transient one.
Median gross annual earnings across Gwynedd are £32,868, which is 9.6% below the Wales median of £36,353 and 16.0% below the Great Britain median of £39,125. Lower local wages cap how far open-market rents can stretch, and combined with the pull of the holiday-let market, that is why a standard buy-to-let yield table does not exist for Caernarfon. The investment case here rests on the sold-price and growth data below, and on the holiday-let route the town's tourism economy supports, rather than on conventional long-term letting.
Gwynedd Economic Summary
- Population (Gwynedd): 117,393 (2021 Census). Change of -3.68% from 2011.
- Median annual salary: £32,868 (local), £36,353 (Wales), £39,125 (Great Britain)
- Employment rate: 72.4% (local), 75.6% (Great Britain)
- Unemployment rate: 6.1% (local)
- Key employment sectors: Tourism and hospitality, public administration, education, human health and social work, retail
Source: ONS Census 2021, Nomis Labour Market Profile (ASHE 2025, Employment Oct 2024-Sep 2025)
Regeneration and Investment in Caernarfon
Caernarfon has drawn more than £20 million of heritage and regeneration investment across its castle, waterfront, and town centre over the last decade, concentrated on the tourism and cultural offer that anchors the local economy. The spending is aimed squarely at the visitor economy and the historic core, which is where the town's property and letting demand is strongest.
- Caernarfon Castle enhancement (Complete, £5 million): A three-year Cadw project, part-funded with £1.04 million from the European Regional Development Fund, added a rooftop deck, a lift giving step-free access to the upper levels of the World Heritage castle, and new catering, retail, and education space. It opened in April 2023, reopening areas of the castle not accessible for centuries. Details from Cadw.
- Caernarfon Waterfront and Town Centre regeneration (Complete, £15 million): Led by Cyngor Gwynedd with £2.6 million from Vibrant and Viable Places and £12 million from the Tourism Attractor Destinations programme, this delivered the Galeri 2 cinema, the Cei Llechi waterfront scheme of 19 artisan units and three holiday lets, and a new Welsh Highland Railway terminus, completed between 2018 and 2020. Details from Cyngor Gwynedd.
- Adra Llanberis Road housing (Under construction): Housing association Adra is building 21 social-rent apartments, seven one-bedroom and 14 two-bedroom, on the former Lleiod Garage site on Llanberis Road in the town centre, funded through Cyngor Gwynedd's Social Housing Grant and targeted at residents aged 55 and over, with completion expected in winter 2025. Details from Adra.
Source: Office for National Statistics - Population for Gwynedd

Caernarfon Property Market Analysis
Average property prices across Gwynedd have risen 432.5% since January 1995, from £37,786 to £201,202. The sections below trace that journey cycle by cycle, then drill into the postcode-level data the market does support: sold prices by type, price per square foot, asking prices, growth trends, and monthly transaction volumes for the Caernarfon postcodes.
When was the last house price crash in Caernarfon?
Caernarfon's sold prices are recorded by HM Land Registry at the level of the Gwynedd local authority, which covers the whole county rather than the town alone. The Land Registry House Price Index tracks average prices from January 1995 to March 2026, covering 31 years of market cycles.
The 1995 to 2007 boom: Gwynedd started at £37,786 in January 1995. Prices climbed gently through the late 1990s, reaching £45,728 by January 2000, then accelerated hard through the early-2000s coastal boom, hitting £134,586 by March 2006. The market kept rising and peaked at £154,168 in September 2007, more than four times its 1995 starting point, as second-home and holiday-home demand drove prices across Snowdonia and the North Wales coast.
2007 to 2009, the financial crisis: Gwynedd's downturn was sharp. Prices fell from the September 2007 peak of £154,168 to a trough of £122,155 in March 2009, a decline of 20.8% in eighteen months. The worst single year-on-year reading was -16.2% in May 2009, a steeper annual fall than many mainland markets recorded, reflecting how exposed a second-home and holiday market is when discretionary buyers step back.
2009 to 2019, a long climb back: From the March 2009 trough, Gwynedd recovered slowly. Prices did not regain the September 2007 pre-crash peak until September 2019, when the average reached £154,835. That round-trip took twelve years, from the £122,155 trough in March 2009 back above the £154,168 peak by September 2019, one of the longer recoveries of any Welsh area and a marker of how heavily the crash sat on a market driven by optional, second-home purchases.
2020 to 2022, the pandemic surge: The stamp duty holiday and a rush to coastal and rural Wales moved Gwynedd decisively. Prices rose from £147,198 in June 2020 to £169,319 by December 2020, then ran to £182,224 by December 2021 and £202,612 by December 2022. Snowdonia and the coast were among the sharpest beneficiaries of the working-from-home shift, pushing the county to record highs.
The 2023 rate shock and beyond: Higher mortgage rates and a cooling second-home market flattened prices. Gwynedd reached an all-time high of £206,516 in November 2023, then eased back through 2024 and 2025 as the market absorbed higher rates and Welsh council-tax premiums on second homes. The latest reading is £201,202 in March 2026, up 2.8% over the year and 30.5% above the September 2007 pre-crash peak.
Long-term growth summary:
- 5 years (March 2021 to March 2026): 18.4% growth (£169,863 to £201,202)
- 10 years (March 2016 to March 2026): 42.2% growth (£141,475 to £201,202)
- 15 years (March 2011 to March 2026): 59.3% growth (£126,303 to £201,202)
- 20 years (March 2006 to March 2026): 49.5% growth (£134,586 to £201,202)
- 30 years (January 1995 to March 2026): 432.5% growth (£37,786 to £201,202)
Gwynedd's 20.8% crash and twelve-year recovery are the backdrop to the market today. This is a county whose prices are tied more tightly than most to discretionary second-home and holiday demand, which cuts both ways: it surged hardest in the pandemic and it fell hardest in the 2008 crash. A buyer entering now does so at prices just off their November 2023 high, in a market where Welsh Government policy on second homes and holiday lets is an active variable rather than a settled one.
- All property types
- Detached
- Semi-detached
- Terraced
- Flats
- All property types
- Detached
- Semi-detached
- Terraced
- Flats
Sold House Prices in Gwynedd
The average sold price across all property types in Gwynedd is £201,202, which is 5.6% below the Wales average of £213,240 as of March 2026. That discount holds across every property type, and it is widest for flats at 10.4% below the Wales figure. Flats sell at 10.4% below the Wales average, while semi-detached houses are just 2.8% below. The pattern fits an affordable, rural Welsh county: no premium tier of stock pulls the average up, and the cheapest end of the market carries the deepest discount to the national figure.
| Property Type | Gwynedd Average | Wales Average | Difference |
|---|---|---|---|
| Detached houses | £309,635 | £334,744 | -7.5% |
| Semi-detached houses | £207,057 | £212,913 | -2.8% |
| Terraced houses | £159,622 | £170,907 | -6.6% |
| Flats and maisonettes | £113,055 | £126,165 | -10.4% |
| All property types | £201,202 | £213,240 | -5.6% |
Detached houses at £309,635 carry a 7.5% discount to the Wales average of £334,744, the widest discount of the four house types. Gwynedd's detached stock includes the larger coastal and rural properties spread across Snowdonia and the Llŷn Peninsula, and it grew 3.1% over the year, the firmest of any type. For a county with so much second-home demand, the detached end is where that discretionary money concentrates, which is why its 7.5% discount to the Wales average is the widest of the four types.
Semi-detached houses at £207,057 sit 2.8% below the Wales average of £212,913, the smallest discount of the four types, and track the county average closely. These are the everyday family homes of Caernarfon and the larger Gwynedd towns, and they posted 3.5% annual growth, the strongest reading in the table.
Terraced houses at £159,622 are 6.6% below the Wales average of £170,907. The terraced stock is concentrated in the older cores of Caernarfon, Bangor, and the former slate-quarrying towns, and it is the cheapest house type for a buyer on a fixed budget. Terraced prices grew 3.0% over the year, in line with the wider market.
Flats and maisonettes at £113,055 show the deepest discount at 10.4% below the Wales average of £126,165, and are the single cheapest way into the county. Gwynedd's flat stock is thin outside Bangor and the town centres, and annual change of -2.3% makes it the one property type to fall over the year, a reminder that flats are a shallow, less liquid part of this rural market.
Price Per Square Foot in Caernarfon
Price per square foot in the Caernarfon postcodes runs from £194 in LL54 to £215 in LL55, a £21 gap across the two districts. Measuring by the square foot controls for how big the homes are, so it compares the areas themselves rather than the house types, and here it separates LL55 at £215 from LL54 at £194. LL55, the district covering the town of Caernarfon and its immediate surrounds, sits slightly above LL54 to the south, which reaches down towards the coast and the Llŷn.
| Rank | Area | Price Per Sq Ft |
|---|---|---|
| 1 | LL54 (Y Groeslon, Penygroes) | £194 |
| 2 | LL55 (Caernarfon, Llanberis) | £215 |
LL54 at £194 per square foot is the cheaper of the two districts, covering the villages south of Caernarfon such as Y Groeslon and Penygroes where older terraced and cottage stock keeps the bricks-and-mortar rate down. LL55 at £215 covers Caernarfon town itself and extends inland towards Llanberis and the foot of Snowdon, where proximity to the castle, the waterfront, and the national park lifts the rate around 11% above LL54.
For Sale Asking Prices in Caernarfon
Asking prices across the two Caernarfon postcodes average £242,844, with LL54 at £244,221 marginally ahead of LL55 at £241,467. The two districts sit close together on price, both above the £201,202 Gwynedd sold average, which reflects the larger detached and rural stock that comes to market across this part of the county.
| Rank | Area | Asking Price |
|---|---|---|
| 1 | LL55 (Caernarfon, Llanberis) | £241,467 |
| 2 | LL54 (Y Groeslon, Penygroes) | £244,221 |
LL55 at £241,467 is the town-centre district, covering Caernarfon itself and the route inland to Llanberis. Its asking prices sit just below LL54 despite the higher price per square foot, which tells you the town stock coming to market is smaller on average than the larger rural and detached homes listed in LL54. LL54 at £244,221 covers the villages to the south towards the Llŷn, where bigger detached and smallholding properties lift the average asking price even though the per-square-foot rate is lower.

House Price Growth in Caernarfon
Five-year asking-price growth in the Caernarfon postcodes runs from 12.2% in LL54 to 24.2% in LL55, while over one year the two districts diverge, with LL55 up 2.5% and LL54 down 1.9%. The longer window is the more reliable read in a thin, low-turnover rural market, where a handful of large sales can swing a single year. Over five years both districts have grown, with the town-centre LL55 clearly ahead.
| Area | 1 Year | 3 Years | 5 Years |
|---|---|---|---|
| LL55 (Caernarfon, Llanberis) | 2.5% | 2.5% | 24.2% |
| LL54 (Y Groeslon, Penygroes) | -1.9% | -8.2% | 12.2% |
LL55, covering Caernarfon town and Llanberis, has grown 24.2% over five years and held positive over one and three years too, the steadier of the two districts. The town core, with its castle, waterfront regeneration, and the pull of Snowdonia, has kept demand firmer than the surrounding villages.
LL54 to the south shows a 12.2% five-year gain but negative one and three-year readings, at -1.9% and -8.2%. That mid-term softness is typical of a rural district with few transactions, where the mix of what happens to sell moves the average around, and it is why the five-year figure is the fairer measure of the trend here.
Monthly Property Sales in Caernarfon
Transaction volumes run from 6 sales a month in LL54 to 19 in LL55, with turnover of 4% and 10% respectively. LL55, the busier town-centre district, sees more than three times the monthly activity of the rural LL54, and its higher turnover points to a deeper pool of buyers and an easier exit for a landlord who later wants to sell.
| Area | Sales Per Month | Turnover | Asking Price |
|---|---|---|---|
| LL55 (Caernarfon, Llanberis) | 19 | 10% | £241,467 |
| LL54 (Y Groeslon, Penygroes) | 6 | 4% | £244,221 |
LL55 at 19 sales a month is the active market of the two, covering Caernarfon town and the Llanberis corridor, where a mix of local buyers, second-home purchasers, and holiday-let owners keeps stock moving. A 10% turnover rate is respectable for a rural Welsh district and signals reasonable liquidity for an area of its size.
LL54 at 6 sales a month and 4% turnover is the quiet end, the villages south towards the Llŷn where a thinner buyer pool means property can sit on the market longer. For an investor, that lower turnover is worth weighing: a smaller, slower market can be harder to buy well in and slower to sell out of.
How Long Properties Take to Sell in Caernarfon
LL55 carries about 10.7 months of unsold stock against 19 sales a month, while the rural LL54 sits at roughly 20.5 months on 6 sales. In a low-volume rural market, a raw days-on-market figure swings wildly on a handful of sales, so the more reliable read is months of unsold stock: how long the current for-sale supply would take to clear at the present rate of sales. Both Caernarfon postcodes hold well over a year of supply, which places them firmly in buyers' market territory.
| Area | Months of Unsold Stock | Market |
|---|---|---|
| LL55 (Caernarfon, Llanberis) | 10.7 | Buyer's market |
| LL54 (Y Groeslon, Penygroes) | 20.5 | Buyer's market |
LL55's 10.7 months of unsold stock is the shorter of the two, and combined with 19 sales a month it is where a buyer will find the most choice and the cleanest exit later on. Even so, ten months of supply is a market where a patient buyer sets the pace, not the seller, which is part of why below-asking purchases are achievable here.
LL54 at 20.5 months is a genuinely thin market: with 6 sales a month against a standing pool of listings, a home in the southern villages can sit for a long stretch before it moves. For an investor that cuts both ways, more room to negotiate on the way in, but a slower, less certain sale on the way out.
What Type of Property Can You Buy in Caernarfon?
Detached houses are the largest single category in both Caernarfon postcodes, at 56.4% of stock in LL54 and 56.7% in LL55, with flats a negligible share in either. The mix reflects a rural county where the standing stock is overwhelmingly houses rather than apartments. The figures below are drawn from 2021 Census records for each postcode.
| Area | Detached | Semi-detached | Terraced | Flats |
|---|---|---|---|---|
| LL55 (Caernarfon, Llanberis) | 56.7% | 20.0% | 19.9% | 2.8% |
| LL54 (Y Groeslon, Penygroes) | 56.4% | 20.4% | 21.1% | 1.4% |
The two postcodes are close on the numbers, both a little over 56% detached with roughly a fifth semi-detached and a fifth terraced. LL55 carries the town of Caernarfon itself, so its terraced share of 19.9% represents the older streets around the castle and harbour, the cheaper stock a buyer on a fixed budget looks to first.
LL54's terraced share edges slightly higher at 21.1%, drawn from the former slate-quarrying villages such as Penygroes and Y Groeslon, while flats barely register in either postcode at 2.8% and 1.4%. For a buyer, the practical takeaway is that this is a house market: the smaller-unit flat stock that anchors single lets in a city is almost absent here, so the rentable and holiday-let options are terraces, semis, and the detached rural properties that dominate the county.
The flats figure covers both purpose-built blocks and conversions, and a small share of non-standard dwellings is excluded, so rows may not total 100%.
How Big Is Caernarfon's Private Rented Sector?
The private rented sector reaches 14.6% of households in LL55 but just 10.5% in LL54, both below the shares seen in the working rental markets to the south and east. The proportion of homes already let privately is a guide to how established the year-round lettings market is, which matters in a town where so much of the visible letting activity runs through holiday and short-term accommodation instead. The table below shows household tenure by postcode.
| Area | Owned Outright | Owned with Mortgage | Private Rented | Social Rented |
|---|---|---|---|---|
| LL55 (Caernarfon, Llanberis) | 54.1% | 22.1% | 14.6% | 8.8% |
| LL54 (Y Groeslon, Penygroes) | 53.1% | 27.3% | 10.5% | 8.8% |
LL55 has the larger private rented sector at 14.6%, consistent with it holding the town of Caernarfon, where the mix of local tenants, seasonal workers, and a share of the stock that flips between long and short lets keeps a functioning private rental base. Even so, at 14.6% it sits below the 17% to 19% shares recorded in an established lettings market like Wrexham, which is one reason PropertyData records no measurable long-term yield here.
LL54 at 10.5% has the thinner rented base, with the highest mortgaged-ownership share of the two at 27.3%. These southern villages are settled owner-occupier and smallholding country, where private renting is a small part of the picture. Across both postcodes, owner-occupation dominates and the conventional rental sector is modest, which fits a county where the lettings economy leans towards tourism rather than year-round tenancies.
Buy-to-Let Considerations
Are House Prices High in Caernarfon? Price-to-Earnings Ratios
The price-to-earnings ratio in the Caernarfon postcodes runs at 7.4x in LL54 and 7.3x in LL55, measured against the Gwynedd median salary of £32,868. The ratio divides the average asking price by local annual earnings, so it shows how many years of the typical local wage a home costs. Both districts sit above the level a local first-time buyer on an average wage can comfortably reach, which is a familiar picture in a county where second-home and incomer demand competes with local incomes.
| Rank | Area | Price-to-Earnings Ratio |
|---|---|---|
| 1 | LL55 (Caernarfon, Llanberis) | 7.3x |
| 2 | LL54 (Y Groeslon, Penygroes) | 7.4x |
At 7.3x and 7.4x, both Caernarfon districts sit well above the level local wages alone would support. When the average home costs more than seven times the median Gwynedd salary, the gap between what locals earn and what property costs is being filled by buyers from outside the county, whether that is second-home owners, retirees relocating to the coast, or holiday-let investors. That dynamic is central to the affordability debate in North Wales and to the Welsh Government policy response around it.
Deposit Requirements in Caernarfon
A 30% deposit on a buy-to-let property in Caernarfon is around £72,440 in LL55 and £73,266 in LL54. The two districts sit within £1,000 of each other, both requiring a little over £72,000 up front, which is a meaningful capital commitment for a market this size and reflects asking prices above the county sold average.
Beyond the deposit, the Wales LTT calculator and other buy-to-let running costs affect the total capital required. Buying in Wales means Land Transaction Tax rather than Stamp Duty, with a higher-rate surcharge on second homes and buy-to-let purchases, so an investor should budget for that on top of the deposit.
| Rank | Area | 30% Deposit Required |
|---|---|---|
| 1 | LL55 (Caernarfon, Llanberis) | £72,440 |
| 2 | LL54 (Y Groeslon, Penygroes) | £73,266 |
LL55 needs the lower deposit at £72,440, for the town-centre district with the higher price per square foot, the stronger five-year growth, and the busier market. LL54 requires £73,266, marginally more, for the larger rural stock to the south in a slower, thinner market. For a buyer weighing the two, the town district is where the liquidity and the growth record sit, while the rural district offers larger properties on more land at a similar asking price.

What the Caernarfon Data Tells Buy-to-Let Investors
The Caernarfon data records sold prices and their growth over time but no conventional rental yield, and the town-centre postcode carries the fuller set of figures. LL55, covering Caernarfon and Llanberis, recorded 24.2% growth over five years, sees 19 sales a month at 10% turnover, and carries a price-to-earnings ratio of 7.3x. It is the more liquid of the two districts, anchored by the castle, the regenerated waterfront, and the pull of Snowdonia.
LL54 to the south is the quieter, more rural district. Its asking prices rose 12.2% over five years, positive but well behind LL55, and its one and three-year readings have softened, at 6 sales a month with 4% turnover in a thin market that can be slow to buy into and slow to exit. The larger detached and smallholding stock here appeals to a particular buyer, but at 4% turnover the liquidity is not there in the way it is in LL55.
The honest limit on this guide is the rental data. PropertyData returns no rent or yield figures for LL54 or LL55, because so much of the lettable stock in this part of Gwynedd is holiday and short-term accommodation rather than year-round tenancies. An investor drawn here on income is usually looking at the holiday home income Caernarfon and the wider Snowdonia area can generate rather than a standard residential letting (in Wales, an occupation contract under the Renting Homes framework), and that is a different model with seasonal voids, more management, and its own tax and regulatory treatment. Buyers who want to come in below asking, which matters more in the slower LL54, tend to work the off-market property in Caernarfon route.
Caernarfon has no England-style selective licensing scheme for private landlords. Every landlord in Wales must register, and those who let or manage their own property must also license, through Rent Smart Wales. The wider policy backdrop carries more weight here than in most markets: Welsh Government council-tax premiums on second homes and tighter rules on short-term lets in tourism hotspots are an active variable in Gwynedd, and any investor weighing a holiday-let model should factor that in. The data describes a small, tourism-led market, with the recorded strength in sold prices and growth and the visitor economy, set against a lower-wage local base and thin conventional-rental data.
How Caernarfon Compares
Caernarfon's mean asking price of £242,844 is among the lower in the North and South Wales markets compared here, but unlike its peers it carries no measurable rental yield. The comparison below places Caernarfon alongside four nearby Welsh markets, each with a different investor profile. The mean asking price is a simple average across all postcodes with data; the mean monthly rent and top gross yield are the equivalent figures for the peer markets, and are shown as not available for Caernarfon because the rental data does not exist for its postcodes.
| Location | Mean Asking Price | Mean Monthly Rent | Mean Gross Yield | Top Yield (postcode) |
|---|---|---|---|---|
| Rhyl | £232,158 | £747 | 3.9% | 4.2% (LL18) |
| Caernarfon | £242,844 | N/A | N/A | N/A |
| Swansea | £251,779 | £1,057 | 5.0% | 8.6% (SA1) |
| Wrexham | £261,327 | £821 | 3.8% | 4.3% (LL11, LL14) |
| Bangor | £273,052 | £921 | 4.0% | 4.8% (LL57) |
Caernarfon at £242,844 is the second-cheapest entry in this group, above Rhyl at £232,158 and below Swansea, Wrexham, and neighbouring Bangor. Where it differs from all four is the absence of rental-yield data: Rhyl, Swansea, Wrexham, and Bangor all have measurable long-term rental markets and postcode yields ranging from 4.2% to 8.6%, while Caernarfon's lettable stock leans to holiday accommodation the standard yield measures do not capture.
For investors weighing the alternatives, Bangor nine miles north is the closest comparison with a functioning rental market, carrying a university and a hospital that anchor year-round tenant demand and a 4.8% top yield. Swansea leads this group on income at an 8.6% top yield off a low price base. Caernarfon differs from all of them: it is a smaller, tourism-led market with no measured long-term rental yield, because holiday and short-term lets take up much of the lettable stock. What the data records here is the sold-price history and its growth, alongside that holiday-let economy, rather than a conventional buy-to-let yield. For a data-led view across every UK market, see our guide to the highest-yielding areas.
Frequently Asked Questions
Is Caernarfon a good place to live for tenants?
It works for a particular kind of demand. Caernarfon is a historic, Welsh-speaking town at the gateway to Snowdonia, with a World Heritage castle, a regenerated waterfront, and a strong tourism economy, which makes it a draw for visitors and second-home owners more than for a large year-round rental population. The county's employment rate of 72.4% sits below the Great Britain figure, and wages are lower, so the conventional tenant base is thinner than in a city.
For a landlord, that shapes the model. Much of the lettable stock in the area goes to holiday and short-term lets rather than standard tenancies, which is why PropertyData records no long-term rental yield for the town's postcodes. A buyer looking for steady year-round tenants would find a deeper market nine miles north in Bangor, with its university and hospital.
What are the best areas in Caernarfon for property investment?
The data splits between the two postcodes. LL55, covering Caernarfon town and the route to Llanberis, is the more active and consistently growing district: 24.2% growth over five years, 19 sales a month, and the higher price per square foot at £215. It holds the town centre, the castle, and the waterfront regeneration, and it is the more liquid of the two.
LL54, the villages to the south towards the Llŷn Peninsula such as Y Groeslon and Penygroes, is quieter and more rural, with 12.2% five-year growth but a softer recent trend and just 6 sales a month. It offers larger detached and smallholding stock at a similar asking price near £244,221, but with less liquidity and a thinner buyer pool.
Why is there no rental yield data for Caernarfon?
It comes down to what the local rental market actually is. PropertyData returns no rent or gross yield for either LL54 or LL55, because a large share of the lettable property in this part of Gwynedd operates as holiday and short-term accommodation rather than conventional long-term tenancies. In a tourism town at the edge of Snowdonia, seasonal lets and second homes dominate the stock that would otherwise show up as buy-to-let.
That does not mean there is no investment case, but the data behind it is different. There is no measured long-term rental yield off a standard residential tenancy (in Wales, an occupation contract); what the record does show is the sold-price history and its growth over time, and the area also carries a holiday-let economy, which is seasonal, more management-intensive, and subject to Welsh Government rules on second homes and short-term lets. Our guide to holiday home investment in Anglesey and North Wales covers how those numbers work.
What are average house prices in Caernarfon?
The average sold price across Gwynedd, the county Caernarfon sits within, is £201,202 on the Land Registry index, about 5.6% below the Wales average of £213,240 as of March 2026. Asking prices in the two Caernarfon postcodes are higher, at £241,467 in LL55 and £244,221 in LL54, for a town mean of £242,844, reflecting the larger rural and detached stock that comes to market. By type, detached homes across Gwynedd average £309,635, semi-detached £207,057, terraced £159,622, and flats £113,055.
Bear in mind the county figures cover the whole of Gwynedd, from the Llŷn across Snowdonia, so they blend Caernarfon with a wide rural hinterland. The postcode figures are specific to the Caernarfon area.
How much deposit do I need to buy in Caernarfon?
Budget for a 30% deposit, which works out at around £72,440 in LL55 and £73,266 in LL54 on current asking prices, so a little over £72,000 in either district. On top of the deposit, a buy-to-let or second-home purchase in Wales attracts Land Transaction Tax with a higher-rate surcharge, which you can work through with the Wales LTT calculator, alongside the usual buy-to-let running costs. For a holiday-let purchase in particular, factor in furnishing and seasonal management costs that a standard let would not carry.
Do I need a licence to let property in Caernarfon?
Wales does not operate England-style selective licensing, but it has its own regime. Every private landlord in Wales must register with Rent Smart Wales, and landlords who let or manage their own property must also hold a licence, both under the Housing (Wales) Act 2014. Cyngor Gwynedd handles any HMO licensing. If you are considering a short-term or holiday let, check the county's own rules and the Welsh Government's planning and council-tax changes for second homes, which are more restrictive in tourism areas like Caernarfon than in most of the UK.
What type of property is most common in Caernarfon?
Gwynedd is a house market rather than a flats one. The Land Registry does not publish a stock-mix breakdown for the town itself, but the sold-price-by-type data tells the story: detached houses dominate the value at £309,635 on average, followed by semi-detached at £207,057 and terraced at £159,622, while flats at £113,055 are a thin, cheap, and less liquid part of the market concentrated in the larger towns. The typical property here is a traditional Welsh house, from town terraces in Caernarfon itself to detached and stone cottages across the surrounding villages and Snowdonia fringe.
For a buy-to-let or holiday-let buyer, that shapes the options. The cheaper terraced stock in and around Caernarfon town is the lowest-priced way in, while the detached and rural properties towards the Llŷn suit a larger holiday-home or lifestyle purchase, at a higher cost and in a slower market.
How does Caernarfon compare with Bangor for investment?
They are nine miles apart but different markets. Bangor, with its university and hospital, has a functioning year-round rental market and measurable postcode yields up to 4.8%, which is where the conventional buy-to-let case sits, on student and NHS tenant demand. Its mean asking price of £273,052 is higher than Caernarfon's £242,844.
Caernarfon is the cheaper, more tourism-led town, without the measurable long-term rental data Bangor carries. Its published data covers sold prices and their growth over time, alongside the World Heritage castle, the regenerated waterfront, and the holiday-let economy of the Snowdonia edge. Bangor carries the measurable year-round yield data of the two, up to 4.8%, while Caernarfon's figures are the growth and sold-price record without a published yield. See our full Bangor buy-to-let guide for the comparison.
How do I buy an investment property in Caernarfon?
Start by deciding what you are buying for, because Caernarfon records its strength in growth and its tourism economy rather than in conventional rental data. If the plan is capital growth, the town-centre LL55 postcode has the stronger record at 24.2% over five years and the busier market. If the plan is holiday-let income, the priority is location and visitor appeal near the castle, the waterfront, or the Snowdonia edge, and a different set of numbers around occupancy and seasonality. Budget for a 30% deposit of around £72,000 plus Welsh Land Transaction Tax.
Beyond what is listed openly, experienced investors often buy below asking through off-market property and BMV property channels, which matters more in a thin market like LL54. To see what is available now, browse investment property or buy-to-let homes for sale.
Ready to buy property?
Access off-market investment properties with an average 8%+ annual gross yield (beating the UK's typical 3-5%).
Get property alerts