Cheshire · North West

Where to Buy Property Investments in Cheshire: Yields to 4.8%

Cheshire prices split from £253k around Warrington to £299k in the east, up 22 to 24% in five years, with gross yields reaching 4.8%. Here are the areas and the numbers.


Top gross yield
4.8%
Towns covered
2
Investing in Cheshire? See buy-to-let deals across the UK

Cheshire is a county in the North West of England, sitting between the Welsh border and the Peak District, wrapped around the south of the Manchester and Liverpool conurbations. That position is the whole story for an investor. Much of the county earns its living commuting into two big city economies, and the housing market prices in that access. A detached home across the county now averages around £450,000, while a flat sits close to £135,000, so the number you land on depends almost entirely on where and what you buy.

There is no single Cheshire figure in the Land Registry, because the county is split across separate reporting areas. Group them and the range runs from £252,610 sold on average around Warrington to £298,548 in the affluent east, against an England average of £289,946. What ties them together is growth. Every part of Cheshire has climbed 22 to 24 per cent over five years, ahead of much of the South, which spent the same period going sideways. On the county's mid-point of roughly £270,000, a 30 per cent deposit is a little over £80,000, so this is a market where the deposit does most of the work of deciding what is within reach.

The two towns with their own detailed guides here are Warrington, the largest town in the county and its logistics engine, and Chester, the walled Roman city on the Welsh border. Warrington leads on gross yield at 4.8 per cent; Chester follows at 4.7 per cent on higher prices. The sections below cover the county-wide market data first, then the areas, sub-markets and the student demand behind those numbers.

Article updated: July 2026

Explore Cheshire town guides

Compare local yields and sold prices across Cheshire's town guides before the county market analysis.

The Cheshire property market

Cheshire is not a single Land Registry area. It splits into three: the borough of Cheshire East in the south and east, Cheshire West and Chester along the Welsh border, and the unitary authority of Warrington in the north. Ceremonially they are all Cheshire, and Warrington belongs in any honest read of the county even though it runs its own council. Because there is no combined series, the fair way to show the market is side by side, one row per reporting area, using the sold prices the Land Registry actually records.

AreaAvg Sold Price5-Year Change30-Year ChangeAvg DetachedAvg Flat
Cheshire East£298,548+23.0%+406%£484,711£150,207
Cheshire West and Chester£267,724+22.6%+410%£435,102£134,535
Warrington£252,610+24.2%+400%£434,518£132,398

The three areas rank exactly as reputation would suggest. Cheshire East is the priciest at £298,548, pulled up by the villages around Wilmslow, Alderley Edge and Prestbury. Cheshire West and Chester sits in the middle at £267,724, carrying the tourist city itself plus the industrial towns of the Wirral fringe. Warrington is the most affordable at £252,610, which fits a town built on distribution and manufacturing rather than commuter-village premiums.

Cheshire East

Cheshire East covers the south and east of the county, pulled up by the golden-triangle villages around Wilmslow, Alderley Edge and Prestbury, plus the towns of Macclesfield and Crewe. At £298,548 it is the priciest of the three, up 23.0% over five years. It peaked at £190,576 in November 2007, bottomed at £160,907 by June 2009, and set a fresh record in the last twelve months. A detached home averages £484,711 against £150,207 for a flat.

Average property price by type in Cheshire East, 1995 to 2026
£0£125k£250k£375k£500kDetached 1995-01: £99,010Detached 1996-02: £95,209Detached 1997-03: £98,213Detached 1998-04: £106,352Detached 1999-05: £116,035Detached 2000-06: £126,095Detached 2001-07: £142,280Detached 2002-08: £178,227Detached 2003-09: £217,366Detached 2004-10: £252,540Detached 2005-11: £262,002Detached 2006-12: £278,522Detached 2008-01: £302,367Detached 2009-02: £259,521Detached 2010-03: £282,495Detached 2011-04: £280,624Detached 2012-05: £270,441Detached 2013-06: £278,336Detached 2014-07: £293,316Detached 2015-08: £309,420Detached 2016-09: £331,842Detached 2017-10: £347,168Detached 2018-11: £362,725Detached 2019-12: £363,361Detached 2021-01: £391,768Detached 2022-02: £414,131Detached 2023-03: £442,625Detached 2024-04: £443,653Detached 2025-05: £475,412Detached 2026-03: £484,711Semi-detached 1995-01: £54,039Semi-detached 1996-02: £52,673Semi-detached 1997-03: £53,633Semi-detached 1998-04: £58,074Semi-detached 1999-05: £63,200Semi-detached 2000-06: £68,271Semi-detached 2001-07: £76,399Semi-detached 2002-08: £96,242Semi-detached 2003-09: £121,604Semi-detached 2004-10: £145,900Semi-detached 2005-11: £152,678Semi-detached 2006-12: £163,169Semi-detached 2008-01: £174,292Semi-detached 2009-02: £147,624Semi-detached 2010-03: £160,661Semi-detached 2011-04: £155,626Semi-detached 2012-05: £154,228Semi-detached 2013-06: £158,185Semi-detached 2014-07: £168,382Semi-detached 2015-08: £177,734Semi-detached 2016-09: £190,560Semi-detached 2017-10: £198,016Semi-detached 2018-11: £206,955Semi-detached 2019-12: £209,569Semi-detached 2021-01: £225,215Semi-detached 2022-02: £239,046Semi-detached 2023-03: £255,138Semi-detached 2024-04: £258,354Semi-detached 2025-05: £277,035Semi-detached 2026-03: £286,002Terraced 1995-01: £40,921Terraced 1996-02: £39,337Terraced 1997-03: £40,171Terraced 1998-04: £42,999Terraced 1999-05: £46,893Terraced 2000-06: £50,348Terraced 2001-07: £56,019Terraced 2002-08: £70,770Terraced 2003-09: £89,345Terraced 2004-10: £110,643Terraced 2005-11: £118,768Terraced 2006-12: £128,352Terraced 2008-01: £138,113Terraced 2009-02: £116,231Terraced 2010-03: £125,844Terraced 2011-04: £121,543Terraced 2012-05: £120,490Terraced 2013-06: £123,958Terraced 2014-07: £131,822Terraced 2015-08: £138,391Terraced 2016-09: £147,959Terraced 2017-10: £152,660Terraced 2018-11: £158,438Terraced 2019-12: £159,575Terraced 2021-01: £173,603Terraced 2022-02: £184,349Terraced 2023-03: £195,531Terraced 2024-04: £199,551Terraced 2025-05: £213,696Terraced 2026-03: £220,571Flats 1995-01: £37,540Flats 1996-02: £36,067Flats 1997-03: £36,261Flats 1998-04: £38,283Flats 1999-05: £42,189Flats 2000-06: £46,152Flats 2001-07: £52,630Flats 2002-08: £68,252Flats 2003-09: £85,728Flats 2004-10: £103,376Flats 2005-11: £108,785Flats 2006-12: £114,609Flats 2008-01: £122,693Flats 2009-02: £103,136Flats 2010-03: £105,432Flats 2011-04: £101,697Flats 2012-05: £99,674Flats 2013-06: £100,439Flats 2014-07: £105,328Flats 2015-08: £110,037Flats 2016-09: £117,989Flats 2017-10: £123,516Flats 2018-11: £125,220Flats 2019-12: £124,651Flats 2021-01: £132,330Flats 2022-02: £138,403Flats 2023-03: £143,581Flats 2024-04: £146,332Flats 2025-05: £152,277Flats 2026-03: £150,207All property types 1995-01: £58,999All property types 1996-02: £56,967All property types 1997-03: £58,290All property types 1998-04: £62,903All property types 1999-05: £68,626All property types 2000-06: £74,226All property types 2001-07: £83,314All property types 2002-08: £105,042All property types 2003-09: £131,033All property types 2004-10: £157,168All property types 2005-11: £165,403All property types 2006-12: £176,793All property types 2008-01: £190,213All property types 2009-02: £161,271All property types 2010-03: £174,156All property types 2011-04: £169,940All property types 2012-05: £166,664All property types 2013-06: £171,055All property types 2014-07: £181,181All property types 2015-08: £190,735All property types 2016-09: £204,363All property types 2017-10: £212,604All property types 2018-11: £221,119All property types 2019-12: £222,313All property types 2021-01: £239,590All property types 2022-02: £253,550All property types 2023-03: £269,796All property types 2024-04: £272,897All property types 2025-05: £291,616All property types 2026-03: £298,5481995200020052010201520202026
  • All property types
  • Detached
  • Semi-detached
  • Terraced
  • Flats

Source: HM Land Registry House Price Index

Year-on-year price change by type in Cheshire East, 1995 to 2026
-15%-10%-5%0%+5%+10%+15%+20%+25%+30%+35%+40%Detached 1996-01: -5.5%Detached 1997-02: +1.9%Detached 1998-03: +6.6%Detached 1999-04: +8.4%Detached 2000-05: +9.9%Detached 2001-06: +10.4%Detached 2002-07: +20.7%Detached 2003-08: +20.2%Detached 2004-09: +16.4%Detached 2005-10: +6.0%Detached 2006-11: +7.8%Detached 2007-12: +8.2%Detached 2009-01: -12.4%Detached 2010-02: +8.4%Detached 2011-03: -0.5%Detached 2012-04: -3.6%Detached 2013-05: +3.8%Detached 2014-06: +6.1%Detached 2015-07: +3.2%Detached 2016-08: +7.5%Detached 2017-09: +3.8%Detached 2018-10: +4.4%Detached 2019-11: +1.0%Detached 2020-12: +9.0%Detached 2022-01: +6.5%Detached 2023-02: +6.7%Detached 2024-03: +0.9%Detached 2025-04: +7.2%Detached 2026-03: +1.6%Semi-detached 1996-01: -4.3%Semi-detached 1997-02: +1.1%Semi-detached 1998-03: +5.9%Semi-detached 1999-04: +7.9%Semi-detached 2000-05: +9.0%Semi-detached 2001-06: +9.7%Semi-detached 2002-07: +21.6%Semi-detached 2003-08: +24.3%Semi-detached 2004-09: +20.4%Semi-detached 2005-10: +6.5%Semi-detached 2006-11: +8.0%Semi-detached 2007-12: +6.7%Semi-detached 2009-01: -13.7%Semi-detached 2010-02: +9.4%Semi-detached 2011-03: -3.2%Semi-detached 2012-04: -1.2%Semi-detached 2013-05: +3.0%Semi-detached 2014-06: +7.1%Semi-detached 2015-07: +3.3%Semi-detached 2016-08: +7.5%Semi-detached 2017-09: +3.3%Semi-detached 2018-10: +4.6%Semi-detached 2019-11: +1.8%Semi-detached 2020-12: +8.0%Semi-detached 2022-01: +6.7%Semi-detached 2023-02: +6.9%Semi-detached 2024-03: +1.8%Semi-detached 2025-04: +7.5%Semi-detached 2026-03: +2.3%Terraced 1996-01: -5.6%Terraced 1997-02: +1.0%Terraced 1998-03: +4.9%Terraced 1999-04: +7.8%Terraced 2000-05: +8.5%Terraced 2001-06: +9.4%Terraced 2002-07: +21.9%Terraced 2003-08: +24.2%Terraced 2004-09: +24.0%Terraced 2005-10: +9.2%Terraced 2006-11: +8.8%Terraced 2007-12: +7.5%Terraced 2009-01: -14.2%Terraced 2010-02: +9.2%Terraced 2011-03: -3.6%Terraced 2012-04: -1.2%Terraced 2013-05: +3.1%Terraced 2014-06: +7.0%Terraced 2015-07: +2.6%Terraced 2016-08: +7.5%Terraced 2017-09: +2.7%Terraced 2018-10: +4.0%Terraced 2019-11: +1.4%Terraced 2020-12: +9.0%Terraced 2022-01: +6.7%Terraced 2023-02: +6.9%Terraced 2024-03: +2.4%Terraced 2025-04: +7.6%Terraced 2026-03: +1.6%Flats 1996-01: -5.2%Flats 1997-02: -0.6%Flats 1998-03: +3.7%Flats 1999-04: +9.3%Flats 2000-05: +9.8%Flats 2001-06: +12.1%Flats 2002-07: +25.2%Flats 2003-08: +24.7%Flats 2004-09: +20.1%Flats 2005-10: +7.0%Flats 2006-11: +6.1%Flats 2007-12: +6.9%Flats 2009-01: -14.7%Flats 2010-02: +2.9%Flats 2011-03: -3.6%Flats 2012-04: -2.5%Flats 2013-05: +1.4%Flats 2014-06: +5.8%Flats 2015-07: +2.5%Flats 2016-08: +7.6%Flats 2017-09: +4.5%Flats 2018-10: +1.6%Flats 2019-11: +0.5%Flats 2020-12: +5.6%Flats 2022-01: +5.1%Flats 2023-02: +4.5%Flats 2024-03: +1.9%Flats 2025-04: +5.1%Flats 2026-03: -3.5%All property types 1996-01: -5.1%All property types 1997-02: +1.3%All property types 1998-03: +5.9%All property types 1999-04: +8.2%All property types 2000-05: +9.2%All property types 2001-06: +10.1%All property types 2002-07: +21.6%All property types 2003-08: +22.9%All property types 2004-09: +20.2%All property types 2005-10: +7.2%All property types 2006-11: +8.0%All property types 2007-12: +7.4%All property types 2009-01: -13.6%All property types 2010-02: +8.3%All property types 2011-03: -2.4%All property types 2012-04: -2.1%All property types 2013-05: +3.2%All property types 2014-06: +6.6%All property types 2015-07: +3.0%All property types 2016-08: +7.5%All property types 2017-09: +3.4%All property types 2018-10: +4.1%All property types 2019-11: +1.3%All property types 2020-12: +8.4%All property types 2022-01: +6.5%All property types 2023-02: +6.6%All property types 2024-03: +1.7%All property types 2025-04: +7.2%All property types 2026-03: +1.4%1996200120062011201620212026
  • All property types
  • Detached
  • Semi-detached
  • Terraced
  • Flats

Source: HM Land Registry House Price Index

Cheshire West and Chester

Cheshire West and Chester runs along the Welsh border and takes in the tourist city of Chester itself plus the industrial towns towards the Wirral. At £267,724 it sits in the middle, up 22.6% over five years, with detached homes averaging £435,102 and flats £134,535.

Average property price by type in Cheshire West and Chester, 1995 to 2026
£0£113k£225k£338k£450kDetached 1995-01: £89,229Detached 1996-02: £88,036Detached 1997-03: £91,913Detached 1998-04: £99,470Detached 1999-05: £109,342Detached 2000-06: £123,600Detached 2001-07: £139,566Detached 2002-08: £168,133Detached 2003-09: £202,736Detached 2004-10: £243,134Detached 2005-11: £255,143Detached 2006-12: £264,784Detached 2008-01: £278,508Detached 2009-02: £251,275Detached 2010-03: £258,813Detached 2011-04: £257,633Detached 2012-05: £255,206Detached 2013-06: £257,011Detached 2014-07: £266,940Detached 2015-08: £278,737Detached 2016-09: £296,028Detached 2017-10: £304,167Detached 2018-11: £317,274Detached 2019-12: £319,727Detached 2021-01: £348,699Detached 2022-02: £376,847Detached 2023-03: £403,766Detached 2024-04: £397,401Detached 2025-05: £414,677Detached 2026-03: £435,102Semi-detached 1995-01: £49,808Semi-detached 1996-02: £49,685Semi-detached 1997-03: £51,323Semi-detached 1998-04: £55,616Semi-detached 1999-05: £61,079Semi-detached 2000-06: £68,838Semi-detached 2001-07: £77,112Semi-detached 2002-08: £93,392Semi-detached 2003-09: £116,263Semi-detached 2004-10: £144,243Semi-detached 2005-11: £153,117Semi-detached 2006-12: £160,201Semi-detached 2008-01: £166,328Semi-detached 2009-02: £148,322Semi-detached 2010-03: £153,128Semi-detached 2011-04: £149,581Semi-detached 2012-05: £151,459Semi-detached 2013-06: £152,364Semi-detached 2014-07: £159,280Semi-detached 2015-08: £166,202Semi-detached 2016-09: £175,731Semi-detached 2017-10: £179,656Semi-detached 2018-11: £187,267Semi-detached 2019-12: £190,524Semi-detached 2021-01: £206,939Semi-detached 2022-02: £224,905Semi-detached 2023-03: £240,917Semi-detached 2024-04: £239,773Semi-detached 2025-05: £250,265Semi-detached 2026-03: £265,997Terraced 1995-01: £38,406Terraced 1996-02: £37,859Terraced 1997-03: £39,250Terraced 1998-04: £42,075Terraced 1999-05: £46,268Terraced 2000-06: £51,867Terraced 2001-07: £57,782Terraced 2002-08: £70,202Terraced 2003-09: £87,380Terraced 2004-10: £111,471Terraced 2005-11: £121,128Terraced 2006-12: £127,887Terraced 2008-01: £133,525Terraced 2009-02: £118,628Terraced 2010-03: £121,485Terraced 2011-04: £118,675Terraced 2012-05: £120,215Terraced 2013-06: £121,415Terraced 2014-07: £126,680Terraced 2015-08: £131,313Terraced 2016-09: £138,544Terraced 2017-10: £141,192Terraced 2018-11: £146,054Terraced 2019-12: £148,094Terraced 2021-01: £161,981Terraced 2022-02: £175,683Terraced 2023-03: £187,254Terraced 2024-04: £188,028Terraced 2025-05: £196,221Terraced 2026-03: £208,676Flats 1995-01: £33,265Flats 1996-02: £32,774Flats 1997-03: £33,493Flats 1998-04: £35,269Flats 1999-05: £39,133Flats 2000-06: £44,753Flats 2001-07: £50,914Flats 2002-08: £63,384Flats 2003-09: £78,430Flats 2004-10: £97,723Flats 2005-11: £105,176Flats 2006-12: £108,556Flats 2008-01: £112,898Flats 2009-02: £100,355Flats 2010-03: £96,536Flats 2011-04: £94,199Flats 2012-05: £94,505Flats 2013-06: £93,301Flats 2014-07: £96,281Flats 2015-08: £99,229Flats 2016-09: £105,412Flats 2017-10: £108,941Flats 2018-11: £109,756Flats 2019-12: £109,986Flats 2021-01: £117,080Flats 2022-02: £125,026Flats 2023-03: £130,379Flats 2024-04: £130,995Flats 2025-05: £132,512Flats 2026-03: £134,535All property types 1995-01: £52,516All property types 1996-02: £52,012All property types 1997-03: £53,945All property types 1998-04: £58,210All property types 1999-05: £64,010All property types 2000-06: £72,255All property types 2001-07: £81,149All property types 2002-08: £98,366All property types 2003-09: £121,147All property types 2004-10: £149,942All property types 2005-11: £159,833All property types 2006-12: £167,017All property types 2008-01: £174,251All property types 2009-02: £155,659All property types 2010-03: £159,267All property types 2011-04: £156,482All property types 2012-05: £157,254All property types 2013-06: £158,162All property types 2014-07: £164,746All property types 2015-08: £171,450All property types 2016-09: £181,517All property types 2017-10: £185,910All property types 2018-11: £192,817All property types 2019-12: £195,182All property types 2021-01: £212,235All property types 2022-02: £229,828All property types 2023-03: £245,410All property types 2024-04: £244,194All property types 2025-05: £253,969All property types 2026-03: £267,7241995200020052010201520202026
  • All property types
  • Detached
  • Semi-detached
  • Terraced
  • Flats

Source: HM Land Registry House Price Index

Year-on-year price change by type in Cheshire West and Chester, 1995 to 2026
-15%-10%-5%0%+5%+10%+15%+20%+25%+30%+35%Detached 1996-01: -1.5%Detached 1997-02: +3.3%Detached 1998-03: +7.6%Detached 1999-04: +7.8%Detached 2000-05: +13.1%Detached 2001-06: +11.1%Detached 2002-07: +17.5%Detached 2003-08: +17.9%Detached 2004-09: +18.7%Detached 2005-10: +3.8%Detached 2006-11: +3.5%Detached 2007-12: +4.8%Detached 2009-01: -10.1%Detached 2010-02: +1.7%Detached 2011-03: +0.5%Detached 2012-04: -2.3%Detached 2013-05: +1.1%Detached 2014-06: +3.4%Detached 2015-07: +2.9%Detached 2016-08: +5.8%Detached 2017-09: +2.9%Detached 2018-10: +4.7%Detached 2019-11: +0.8%Detached 2020-12: +9.3%Detached 2022-01: +6.9%Detached 2023-02: +9.1%Detached 2024-03: -0.7%Detached 2025-04: +6.2%Detached 2026-03: +2.6%Semi-detached 1996-01: -0.4%Semi-detached 1997-02: +2.6%Semi-detached 1998-03: +7.1%Semi-detached 1999-04: +7.4%Semi-detached 2000-05: +12.5%Semi-detached 2001-06: +10.2%Semi-detached 2002-07: +18.4%Semi-detached 2003-08: +21.7%Semi-detached 2004-09: +23.1%Semi-detached 2005-10: +4.8%Semi-detached 2006-11: +3.9%Semi-detached 2007-12: +3.6%Semi-detached 2009-01: -11.1%Semi-detached 2010-02: +2.8%Semi-detached 2011-03: -1.5%Semi-detached 2012-04: -0.3%Semi-detached 2013-05: +0.5%Semi-detached 2014-06: +4.0%Semi-detached 2015-07: +2.9%Semi-detached 2016-08: +5.3%Semi-detached 2017-09: +2.6%Semi-detached 2018-10: +4.7%Semi-detached 2019-11: +1.4%Semi-detached 2020-12: +8.1%Semi-detached 2022-01: +7.2%Semi-detached 2023-02: +9.5%Semi-detached 2024-03: +0.1%Semi-detached 2025-04: +6.4%Semi-detached 2026-03: +3.4%Terraced 1996-01: -1.6%Terraced 1997-02: +2.6%Terraced 1998-03: +6.1%Terraced 1999-04: +7.3%Terraced 2000-05: +12.0%Terraced 2001-06: +9.9%Terraced 2002-07: +18.7%Terraced 2003-08: +21.5%Terraced 2004-09: +26.3%Terraced 2005-10: +7.3%Terraced 2006-11: +4.5%Terraced 2007-12: +4.3%Terraced 2009-01: -11.4%Terraced 2010-02: +2.4%Terraced 2011-03: -1.6%Terraced 2012-04: -0.2%Terraced 2013-05: +0.7%Terraced 2014-06: +3.8%Terraced 2015-07: +2.2%Terraced 2016-08: +5.4%Terraced 2017-09: +2.3%Terraced 2018-10: +4.1%Terraced 2019-11: +1.4%Terraced 2020-12: +8.6%Terraced 2022-01: +6.9%Terraced 2023-02: +9.6%Terraced 2024-03: +0.8%Terraced 2025-04: +6.5%Terraced 2026-03: +2.8%Flats 1996-01: -1.3%Flats 1997-02: +1.0%Flats 1998-03: +4.3%Flats 1999-04: +8.4%Flats 2000-05: +13.7%Flats 2001-06: +12.5%Flats 2002-07: +21.8%Flats 2003-08: +21.9%Flats 2004-09: +22.4%Flats 2005-10: +6.0%Flats 2006-11: +1.9%Flats 2007-12: +3.8%Flats 2009-01: -11.8%Flats 2010-02: -4.0%Flats 2011-03: -1.7%Flats 2012-04: -1.5%Flats 2013-05: -1.2%Flats 2014-06: +3.0%Flats 2015-07: +2.0%Flats 2016-08: +6.1%Flats 2017-09: +4.2%Flats 2018-10: +1.5%Flats 2019-11: +0.4%Flats 2020-12: +5.1%Flats 2022-01: +5.1%Flats 2023-02: +7.1%Flats 2024-03: +0.4%Flats 2025-04: +3.7%Flats 2026-03: -2.5%All property types 1996-01: -1.1%All property types 1997-02: +2.8%All property types 1998-03: +6.9%All property types 1999-04: +7.6%All property types 2000-05: +12.8%All property types 2001-06: +10.6%All property types 2002-07: +18.4%All property types 2003-08: +20.4%All property types 2004-09: +22.5%All property types 2005-10: +5.3%All property types 2006-11: +3.7%All property types 2007-12: +4.1%All property types 2009-01: -11.0%All property types 2010-02: +1.7%All property types 2011-03: -0.9%All property types 2012-04: -1.0%All property types 2013-05: +0.6%All property types 2014-06: +3.7%All property types 2015-07: +2.6%All property types 2016-08: +5.6%All property types 2017-09: +2.8%All property types 2018-10: +4.2%All property types 2019-11: +1.1%All property types 2020-12: +8.3%All property types 2022-01: +6.9%All property types 2023-02: +9.2%All property types 2024-03: 0.0%All property types 2025-04: +6.0%All property types 2026-03: +2.5%1996200120062011201620212026
  • All property types
  • Detached
  • Semi-detached
  • Terraced
  • Flats

Source: HM Land Registry House Price Index

Warrington

Warrington, the unitary authority in the north between Manchester and Liverpool, is the most affordable at £252,610 and the fastest-growing of the three at 24.2% over five years, a town built on distribution and manufacturing rather than commuter-village premiums. It also set a record high in the last twelve months. Detached homes average £434,518, flats £132,398.

Average property price by type in Warrington, 1995 to 2026
£0£113k£225k£338k£450kDetached 1995-01: £90,819Detached 1996-02: £84,980Detached 1997-03: £90,730Detached 1998-04: £93,939Detached 1999-05: £103,017Detached 2000-06: £117,239Detached 2001-07: £132,801Detached 2002-08: £164,553Detached 2003-09: £200,065Detached 2004-10: £238,201Detached 2005-11: £250,779Detached 2006-12: £253,602Detached 2008-01: £272,765Detached 2009-02: £223,129Detached 2010-03: £234,277Detached 2011-04: £239,732Detached 2012-05: £241,402Detached 2013-06: £245,041Detached 2014-07: £262,441Detached 2015-08: £273,871Detached 2016-09: £288,568Detached 2017-10: £306,753Detached 2018-11: £324,304Detached 2019-12: £320,935Detached 2021-01: £350,666Detached 2022-02: £391,908Detached 2023-03: £415,958Detached 2024-04: £403,160Detached 2025-05: £423,586Detached 2026-03: £434,518Semi-detached 1995-01: £50,652Semi-detached 1996-02: £47,439Semi-detached 1997-03: £50,332Semi-detached 1998-04: £52,061Semi-detached 1999-05: £56,848Semi-detached 2000-06: £64,367Semi-detached 2001-07: £72,102Semi-detached 2002-08: £89,628Semi-detached 2003-09: £113,331Semi-detached 2004-10: £139,930Semi-detached 2005-11: £148,631Semi-detached 2006-12: £151,529Semi-detached 2008-01: £161,031Semi-detached 2009-02: £129,855Semi-detached 2010-03: £136,577Semi-detached 2011-04: £135,899Semi-detached 2012-05: £140,560Semi-detached 2013-06: £142,201Semi-detached 2014-07: £153,368Semi-detached 2015-08: £160,252Semi-detached 2016-09: £168,289Semi-detached 2017-10: £178,039Semi-detached 2018-11: £188,400Semi-detached 2019-12: £187,533Semi-detached 2021-01: £205,326Semi-detached 2022-02: £230,890Semi-detached 2023-03: £244,403Semi-detached 2024-04: £239,744Semi-detached 2025-05: £250,784Semi-detached 2026-03: £262,028Terraced 1995-01: £37,567Terraced 1996-02: £34,655Terraced 1997-03: £36,948Terraced 1998-04: £37,772Terraced 1999-05: £41,283Terraced 2000-06: £46,318Terraced 2001-07: £51,390Terraced 2002-08: £63,751Terraced 2003-09: £80,582Terraced 2004-10: £103,578Terraced 2005-11: £113,477Terraced 2006-12: £117,148Terraced 2008-01: £125,435Terraced 2009-02: £100,401Terraced 2010-03: £105,341Terraced 2011-04: £105,050Terraced 2012-05: £108,522Terraced 2013-06: £110,280Terraced 2014-07: £119,009Terraced 2015-08: £123,652Terraced 2016-09: £129,485Terraced 2017-10: £136,625Terraced 2018-11: £143,318Terraced 2019-12: £142,019Terraced 2021-01: £156,972Terraced 2022-02: £177,045Terraced 2023-03: £186,156Terraced 2024-04: £184,256Terraced 2025-05: £192,893Terraced 2026-03: £201,554Flats 1995-01: £33,189Flats 1996-02: £30,766Flats 1997-03: £32,194Flats 1998-04: £32,487Flats 1999-05: £35,780Flats 2000-06: £40,738Flats 2001-07: £46,011Flats 2002-08: £58,656Flats 2003-09: £74,206Flats 2004-10: £93,354Flats 2005-11: £99,354Flats 2006-12: £99,853Flats 2008-01: £105,753Flats 2009-02: £84,333Flats 2010-03: £83,094Flats 2011-04: £82,751Flats 2012-05: £84,766Flats 2013-06: £84,845Flats 2014-07: £90,992Flats 2015-08: £93,579Flats 2016-09: £98,992Flats 2017-10: £106,440Flats 2018-11: £109,280Flats 2019-12: £106,464Flats 2021-01: £114,769Flats 2022-02: £127,982Flats 2023-03: £132,134Flats 2024-04: £130,540Flats 2025-05: £132,486Flats 2026-03: £132,398All property types 1995-01: £50,509All property types 1996-02: £47,117All property types 1997-03: £50,134All property types 1998-04: £51,684All property types 1999-05: £56,553All property types 2000-06: £64,005All property types 2001-07: £71,737All property types 2002-08: £89,135All property types 2003-09: £111,434All property types 2004-10: £138,079All property types 2005-11: £147,565All property types 2006-12: £150,350All property types 2008-01: £160,449All property types 2009-02: £129,198All property types 2010-03: £134,925All property types 2011-04: £135,300All property types 2012-05: £138,848All property types 2013-06: £140,639All property types 2014-07: £151,390All property types 2015-08: £157,598All property types 2016-09: £165,635All property types 2017-10: £175,619All property types 2018-11: £184,816All property types 2019-12: £183,202All property types 2021-01: £200,751All property types 2022-02: £225,459All property types 2023-03: £237,983All property types 2024-04: £233,546All property types 2025-05: £243,809All property types 2026-03: £252,6101995200020052010201520202026
  • All property types
  • Detached
  • Semi-detached
  • Terraced
  • Flats

Source: HM Land Registry House Price Index

Year-on-year price change by type in Warrington, 1995 to 2026
-20%-15%-10%-5%0%+5%+10%+15%+20%+25%+30%+35%+40%Detached 1996-01: -6.1%Detached 1997-02: +4.5%Detached 1998-03: +2.9%Detached 1999-04: +8.4%Detached 2000-05: +11.1%Detached 2001-06: +11.3%Detached 2002-07: +21.5%Detached 2003-08: +20.4%Detached 2004-09: +20.3%Detached 2005-10: +5.4%Detached 2006-11: +1.6%Detached 2007-12: +9.4%Detached 2009-01: -16.6%Detached 2010-02: +5.1%Detached 2011-03: +3.2%Detached 2012-04: -0.1%Detached 2013-05: +1.4%Detached 2014-06: +6.3%Detached 2015-07: +4.8%Detached 2016-08: +5.9%Detached 2017-09: +6.0%Detached 2018-10: +4.7%Detached 2019-11: -0.3%Detached 2020-12: +9.2%Detached 2022-01: +11.7%Detached 2023-02: +6.4%Detached 2024-03: -2.5%Detached 2025-04: +5.4%Detached 2026-03: +2.6%Semi-detached 1996-01: -5.9%Semi-detached 1997-02: +4.3%Semi-detached 1998-03: +2.0%Semi-detached 1999-04: +7.7%Semi-detached 2000-05: +10.1%Semi-detached 2001-06: +10.3%Semi-detached 2002-07: +22.1%Semi-detached 2003-08: +25.0%Semi-detached 2004-09: +25.1%Semi-detached 2005-10: +6.1%Semi-detached 2006-11: +2.0%Semi-detached 2007-12: +8.2%Semi-detached 2009-01: -17.8%Semi-detached 2010-02: +6.4%Semi-detached 2011-03: +0.3%Semi-detached 2012-04: +2.3%Semi-detached 2013-05: +0.6%Semi-detached 2014-06: +7.0%Semi-detached 2015-07: +5.0%Semi-detached 2016-08: +5.6%Semi-detached 2017-09: +5.7%Semi-detached 2018-10: +4.9%Semi-detached 2019-11: +0.2%Semi-detached 2020-12: +8.7%Semi-detached 2022-01: +12.1%Semi-detached 2023-02: +6.6%Semi-detached 2024-03: -1.6%Semi-detached 2025-04: +5.2%Semi-detached 2026-03: +3.5%Terraced 1996-01: -7.3%Terraced 1997-02: +4.5%Terraced 1998-03: +0.9%Terraced 1999-04: +7.4%Terraced 2000-05: +9.3%Terraced 2001-06: +9.5%Terraced 2002-07: +21.7%Terraced 2003-08: +24.8%Terraced 2004-09: +30.0%Terraced 2005-10: +9.4%Terraced 2006-11: +2.9%Terraced 2007-12: +9.1%Terraced 2009-01: -18.4%Terraced 2010-02: +6.4%Terraced 2011-03: +0.3%Terraced 2012-04: +2.3%Terraced 2013-05: +0.7%Terraced 2014-06: +7.1%Terraced 2015-07: +4.3%Terraced 2016-08: +5.6%Terraced 2017-09: +5.5%Terraced 2018-10: +4.2%Terraced 2019-11: +0.1%Terraced 2020-12: +9.4%Terraced 2022-01: +12.2%Terraced 2023-02: +6.6%Terraced 2024-03: -0.8%Terraced 2025-04: +5.4%Terraced 2026-03: +2.9%Flats 1996-01: -6.4%Flats 1997-02: +2.4%Flats 1998-03: -0.3%Flats 1999-04: +9.1%Flats 2000-05: +10.1%Flats 2001-06: +11.5%Flats 2002-07: +25.1%Flats 2003-08: +26.1%Flats 2004-09: +26.4%Flats 2005-10: +6.3%Flats 2006-11: +0.1%Flats 2007-12: +7.8%Flats 2009-01: -19.1%Flats 2010-02: -0.3%Flats 2011-03: +0.3%Flats 2012-04: +1.1%Flats 2013-05: -0.2%Flats 2014-06: +6.7%Flats 2015-07: +3.8%Flats 2016-08: +6.5%Flats 2017-09: +7.8%Flats 2018-10: +2.2%Flats 2019-11: -1.3%Flats 2020-12: +6.0%Flats 2022-01: +10.8%Flats 2023-02: +4.4%Flats 2024-03: -1.4%Flats 2025-04: +2.7%Flats 2026-03: -2.1%All property types 1996-01: -6.3%All property types 1997-02: +4.4%All property types 1998-03: +1.9%All property types 1999-04: +7.9%All property types 2000-05: +10.2%All property types 2001-06: +10.4%All property types 2002-07: +21.9%All property types 2003-08: +23.6%All property types 2004-09: +25.3%All property types 2005-10: +6.8%All property types 2006-11: +1.9%All property types 2007-12: +8.7%All property types 2009-01: -18.0%All property types 2010-02: +5.5%All property types 2011-03: +1.0%All property types 2012-04: +1.6%All property types 2013-05: +0.8%All property types 2014-06: +6.8%All property types 2015-07: +4.6%All property types 2016-08: +5.8%All property types 2017-09: +5.9%All property types 2018-10: +4.4%All property types 2019-11: 0.0%All property types 2020-12: +8.8%All property types 2022-01: +11.9%All property types 2023-02: +6.4%All property types 2024-03: -1.6%All property types 2025-04: +5.0%All property types 2026-03: +2.6%1996200120062011201620212026
  • All property types
  • Detached
  • Semi-detached
  • Terraced
  • Flats

Source: HM Land Registry House Price Index

Best areas to invest in Cheshire

The two towns covered in detail here are the ones where the rental numbers stack up rather than the ones with the biggest house prices. Warrington leads the county on gross yield, and its top postcode, WA1 around the town centre, returns 4.8 per cent on a mean asking price of £233,722. Chester's best outcode, CH1 covering the city centre and its northern edge, returns 4.7 per cent on £258,806 asking. Both beat the county's expensive villages, where yields fall below 3 per cent once prices run past half a million.

AreaMean Asking Price30% DepositTop Gross Yield
Warrington£307,783£92,3354.8%
Chester£339,728£101,9184.7%

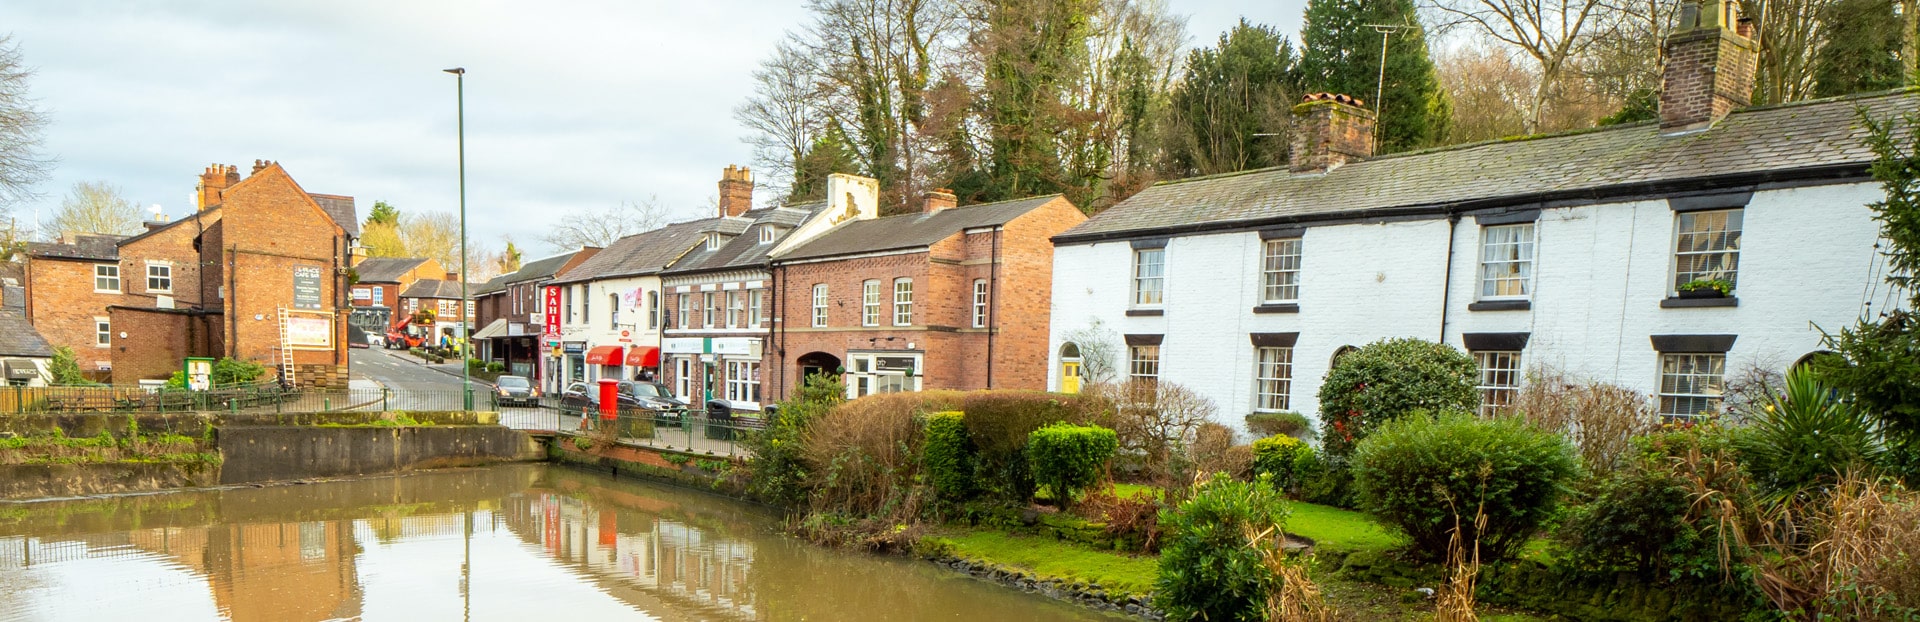
Beyond the two guide towns, three other Cheshire markets show up repeatedly in county searches and are worth naming as areas to consider. Crewe, in the south of Cheshire East, is the county's classic value town, a railway junction and the home of Bentley, with a future high-speed rail station in the plan. Nantwich, a market town just to its west, draws the commuter buyers Crewe's prices do not. And the villages of the Cheshire Golden Triangle, between Wilmslow, Alderley Edge and Prestbury, are the county's prestige postcodes, where prices are highest and gross yields tightest. We do not hold detailed postcode data on those three, so treat them as context for the county rather than figures to underwrite a purchase on.

An aerial view of Crewe town centre in Cheshire.
Crewe town centre, in the south of Cheshire East

Cheshire's commuter and tourist markets

Cheshire runs two very different rental economies at once, and they explain the price and yield spread better than any single county number.

The Manchester and Liverpool corridor

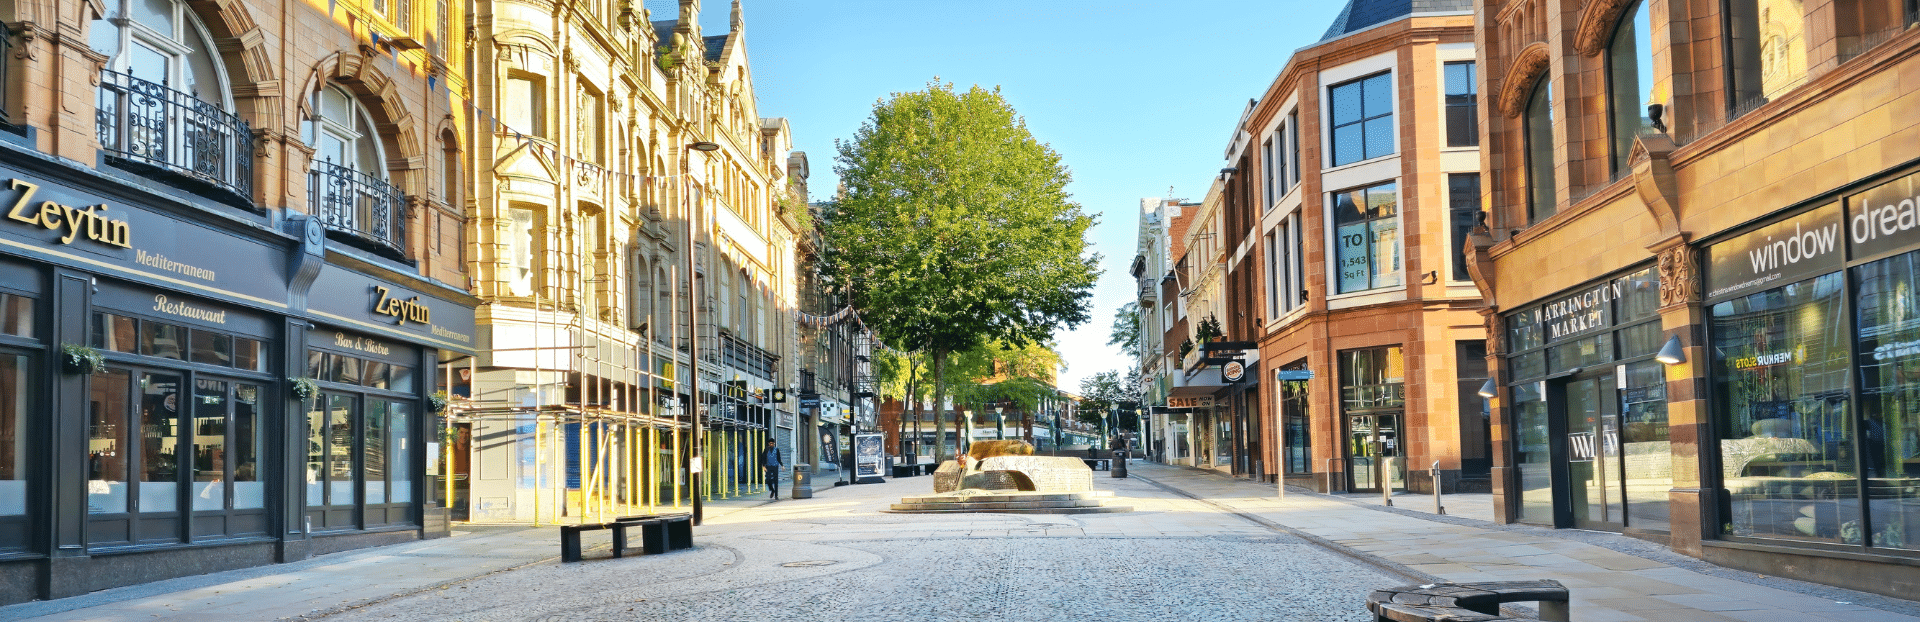
The northern half of the county lives off two city labour markets. Warrington sits almost exactly between Manchester and Liverpool, on the M6, M56 and M62 and on the West Coast Main Line, and it has built a large distribution and logistics economy on that access. Tenants here are a mix of local workers, people employed on the business parks, and commuters priced out of the two cities themselves. That steady, jobs-led demand is what holds Warrington's 4.8 per cent gross yield up while its sold price stays the lowest of the three reporting areas at £252,610. Runcorn and Widnes, across the Mersey, run the same working-town profile at lower prices again.

The tourist and border city

Chester is a different market entirely. It is one of Britain's most complete walled cities, with Roman origins, a racecourse and a tourist trade that supports a large hospitality and service economy, sitting right on the Welsh border so it also draws Wrexham and North Wales commuters. That mix of visitor spend, professional jobs and heritage appeal is why Chester carries a higher average sold price, with Cheshire West and Chester at £267,724, and a slightly lower top yield of 4.7 per cent. It is the county's stability-and-prestige market where Warrington is its cash-flow one.

The affluent east

East of the two guide towns sit the villages that gave Cheshire its expensive reputation. The Golden Triangle around Wilmslow, Alderley Edge and Prestbury holds the county's dearest homes, with Cheshire East detached prices averaging £484,711, and Macclesfield anchors the area with AstraZeneca's large research site nearby. Rental demand here is real, but the maths are the opposite of Warrington's. High prices and comparatively modest rents pull gross yields below 3 per cent, so this end of the county has historically been a capital-value market far more than an income one.

Black and white timber-framed buildings in Chester city centre.
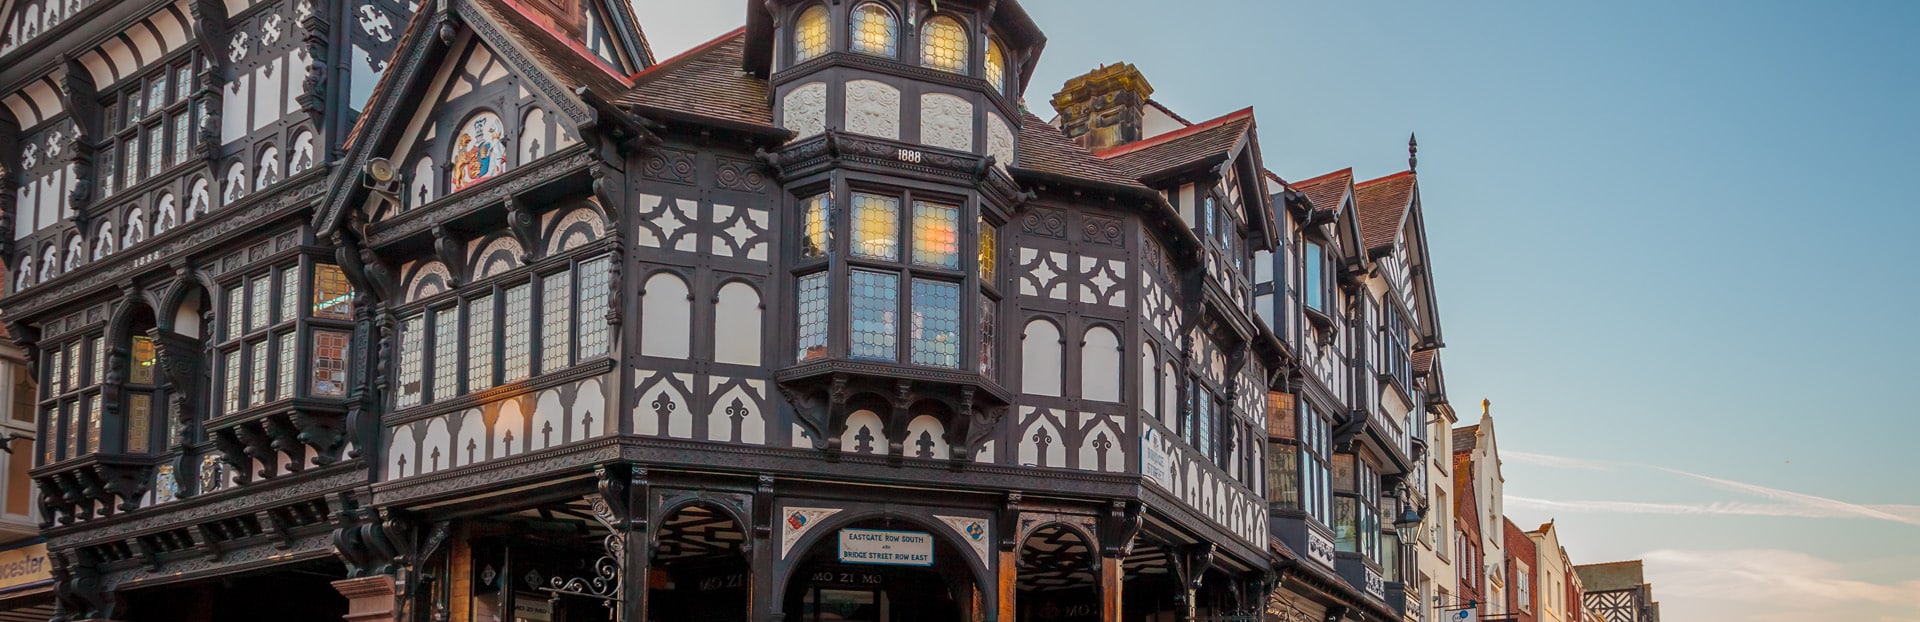
The Rows, Chester city centre

Cheshire's student and HMO market

Cheshire's student demand runs through one institution with a foot in both guide towns. The University of Chester has its main campuses in Chester itself, on Parkgate Road and at Exton Park and Queens Park, and a second campus in Warrington. That gives a landlord a genuine, term-time-driven tenant pool in exactly the two towns where the yields already lead the county.

Student and shared-house lets are the usual route to push yields above a town's single-let average, and both towns support that. In Chester the demand clusters around the university sites and the city centre, where CH1 already returns the town's top 4.7 per cent. In Warrington the campus adds to a rental market that is otherwise led by jobs rather than students, which is part of why WA1 holds 4.8 per cent. A house in multiple occupation needs the right licence from the local council before it is let, and the rules differ between Cheshire West and Chester and Warrington's own authority, so the licensing position is worth checking with the relevant council for any specific property.

How to invest in Cheshire

Buying a rental in Cheshire means paying the buy-to-let stamp duty surcharge on top of standard rates, and on county prices of £250,000 to £340,000 that is a real line in the budget. Our stamp duty calculator works out the full bill for a second or investment property before you commit.

From there, the routes into the county depend on what you are after. If you want to see the deals we are introducing to investors, our current investment property listings are the place to start. For buyers focused on rental returns, we also list buy-to-let deals across the UK, and for anyone chasing a discount going in, we source below market value property too. Cheshire is only one North West market. The two big city economies its tenants commute into have their own detailed guides, so it is worth reading them alongside this one, covering buy-to-let in Manchester and the Liverpool market, and the wider regional picture in our best places for buy-to-let rundown.

Frequently Asked Questions

What is the average house price in Cheshire?

There is no single Cheshire figure, because the county is split across three Land Registry areas. Cheshire East averages £298,548, Cheshire West and Chester £267,724, and Warrington £252,610, against an England average of £289,946. The mid-point of the county sits close to £270,000, but a detached home runs to around £450,000 while a flat averages nearer £135,000, so the type of property matters as much as the area.

Where are the best rental yields in Cheshire?

Of the towns covered here, Warrington leads at a 4.8 per cent top gross yield, with its WA1 town-centre postcode returning that on a £233,722 mean asking price. Chester follows at 4.7 per cent, led by CH1 at £258,806 asking. The county's expensive eastern villages sit below 3 per cent, because high prices there outpace rents.

Is Cheshire an expensive place to buy property?

Parts of it are among the dearest in England outside the South East. The Golden Triangle villages around Wilmslow and Alderley Edge push Cheshire East detached prices to £484,711 on average. But the county also holds towns well below the England average, with Warrington at £252,610, and flats across the county averaging between £132,000 and £150,000. The headline reputation and the actual range are two different things.

How much has Cheshire property grown in value?

All three reporting areas have grown 22 to 24 per cent over the last five years, with Warrington leading at 24.2 per cent, ahead of much of southern England over the same period. Over thirty years each area has climbed from around £50,000 to £59,000 in 1995 to £253,000 to £299,000 today, roughly a fivefold increase.

Which are the cheapest places to buy in Cheshire?

The county's value markets are the working towns of the north and south. Crewe, the railway and manufacturing town in the south of Cheshire East, is the classic example, alongside Runcorn and Widnes near the Mersey. Warrington is the most affordable of the three main reporting areas at £252,610 sold on average, and flats county-wide start well below the detached prices that set Cheshire's expensive reputation.

Is Crewe a good place to invest in property?

Crewe is one of the most searched-for towns in the county, and the reasons are its low prices, its position as a major West Coast Main Line junction with a fast link to London, and a planned regeneration of the town centre. We do not hold detailed postcode-level yield data for Crewe on this hub, so the figures to underwrite a purchase would come from a town-level view rather than the county numbers here.

Ready to buy property?

Access off-market investment properties with an average 8%+ annual gross yield (beating the UK's typical 3-5%).

Get property alerts
Buy investment property, 8%+ yields