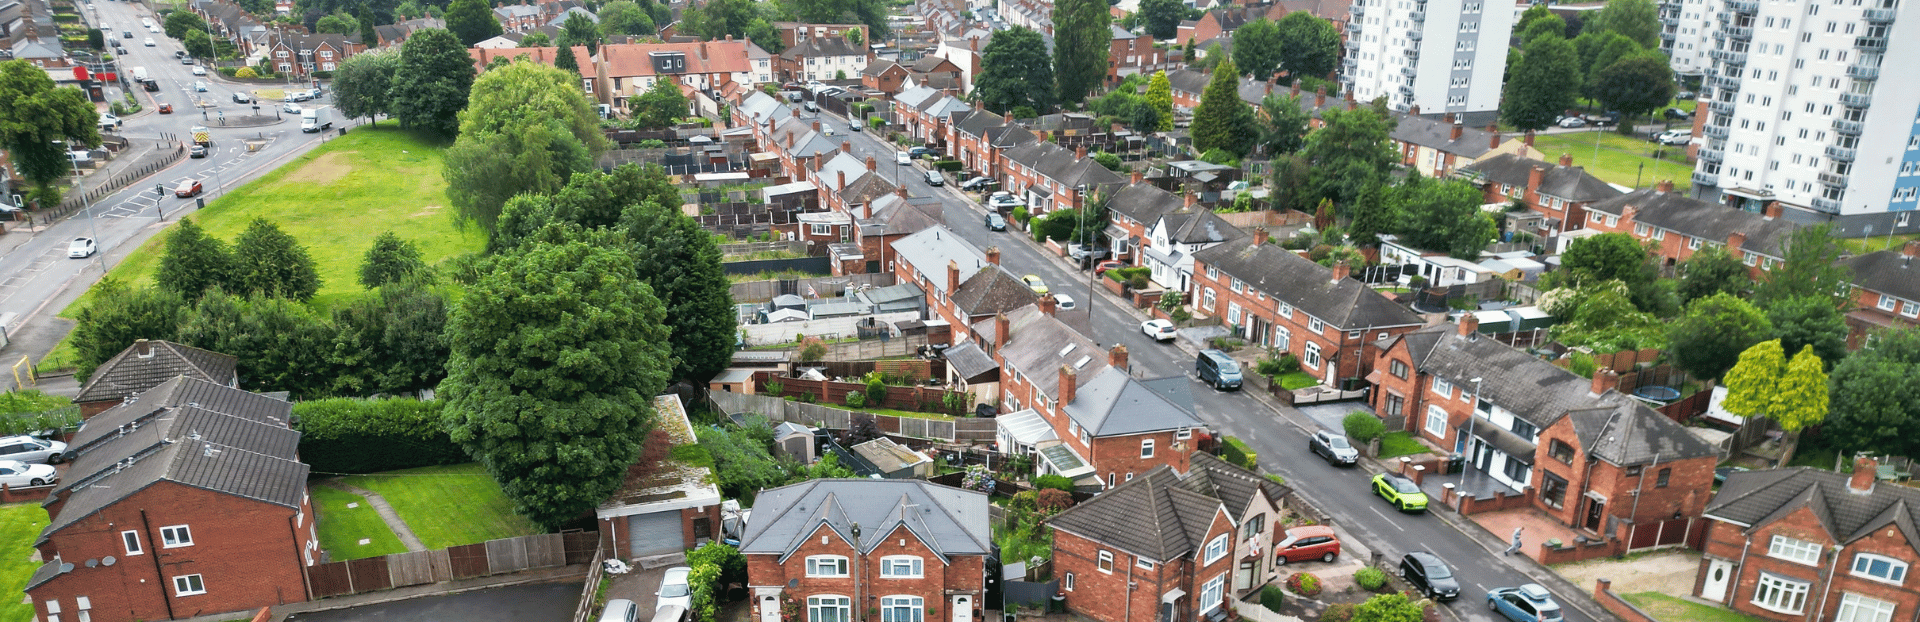
Walsall is a Black Country borough in the West Midlands, north of Birmingham. Average sold prices in Walsall sit at £212,390 on the HM Land Registry House Price Index, 26.7% below the England average of £289,946 and 8.8% under the £232,897 West Midlands regional figure. That is one of the cheaper entry points in the West Midlands, a Black Country borough north of Birmingham where a low price base is what builds the yields. The borough's population grew 5.5% between the 2011 and 2021 censuses, from 269,323 to 284,124 residents.
Walsall's affordability does not run evenly across the borough. The town-centre and western postcodes around Pleck, Wednesbury and Willenhall hold sold prices well under the borough average, while the Aldridge and Streetly fringe in the east runs much dearer. B74 (Streetly, Little Aston) averages £516,097 on asking prices against £185,999 in WS2 (Pleck, Bentley), a spread of 178% across a single borough. For an income-focused investor, the cheaper western postcodes are where the rent works hardest against the purchase price; the eastern end is owner-occupier territory with the borough's highest prices and lowest yields.
This guide covers the metropolitan borough of Walsall (ONS code E08000030) across 11 postcodes: WS1, WS2, WS3, WS4, WS5, WS8, WS9, WS10, WV12, WV13 and B74. Walsall sits in the West Midlands, eight miles north-west of Birmingham, with Wolverhampton on its western border. The wider West Midlands buy-to-let market also includes Dudley and Sandwell to the south.
Article updated: July 2026

Why Invest in Walsall?
Walsall grew its population 5.5% between the 2011 and 2021 censuses, from 269,323 to 284,124 residents, a slower pace than the 6.3% England and Wales average. Walsall is one of the seven metropolitan boroughs of the West Midlands, an industrial Black Country town with leatherworking and metal trades in its history and a market town at its core. Its appeal to investors is built on price rather than prestige: it offers some of the lowest property values in the conurbation while sitting inside Birmingham's commuting orbit.
The local employment rate is 65.7%, below the Great Britain average of 75.6%, and unemployment runs at 5.6%. Median gross annual earnings for Walsall residents are £34,036, which is below both the West Midlands regional median and the Great Britain median of £39,125. Those wage levels matter to a landlord in two ways: they keep open-market rents grounded, and they mean a meaningful share of local tenancies sit close to the benefit-funded end of the market, where Local Housing Allowance sets the floor.
What Walsall offers a buy-to-let investor is a low cost of entry against rents that hold up. Tenant demand is anchored by Birmingham's labour market eight miles south, by Walsall's own logistics and manufacturing base, and by a road and rail network that puts the town inside the West Midlands commuter belt. The borough is not a wage-growth story like the Cheshire commuter towns; it is an affordability and yield story.
Walsall Economic Summary
- Population (Walsall): 284,124 (2021 Census). Growth of 5.5% from 2011.
- Median annual salary: £34,036 (local), £39,125 (Great Britain)
- Median weekly salary: £654.50 (local), £712.50 (West Midlands), £752.40 (Great Britain)
- Employment rate: 65.7% (local), 75.6% (Great Britain)
- Unemployment rate: 5.6% (local)
- Economic base: Logistics and distribution, manufacturing, retail, health and social work, public administration
Source: ONS Census 2021, Nomis Labour Market Profile (ASHE 2025)
Regeneration and Investment in Walsall
Walsall has secured £140 million of government funding over five years for town-centre regeneration, with a new Town Centre Framework approved in December 2025 as the blueprint for that spend. The investment is concentrated on the town centre itself, where the council is reworking the transport hubs, the retail core and the public buildings rather than building out a single large residential scheme.
- Walsall Town Centre Regeneration (Framework approved December 2025, £70 million-plus programme): A comprehensive town-centre programme spanning the Connected Gateway project that reconnects the bus and rail hubs, the second phase of the Saddlers Centre, the restoration of the Guildhall (reopening summer 2026), and a new Adult Learning Centre opening in September 2027. The New Town Centre Framework, approved in December 2025, sets the strategic blueprint, drawing on £140 million of government funding committed over five years. Updates at Walsall Council.
- SPARK Enterprise Hub (First buildings completed November 2025, full opening 2026): A flagship cluster for enterprise, innovation and advanced manufacturing, with its first buildings completed in November 2025. The council expects it to generate over 1,000 jobs across logistics, technology, light manufacturing and business services when fully operational in 2026, adding to the local labour demand that underpins tenant need. Updates at Walsall Council.
Source: Office for National Statistics - Population for Walsall

Walsall Property Market Analysis
Average property prices in Walsall have risen 393.9% since January 1995, from £43,005 to £212,390. The sections below break down that journey cycle by cycle, then drill into current postcode-level data for sold prices, price per square foot, asking prices, growth trends, and monthly transaction volumes.
When was the last house price crash in Walsall?
Walsall is a metropolitan borough, so all sold property prices from HM Land Registry are recorded at borough level. The Land Registry House Price Index tracks average prices from January 1995 to March 2026, covering 31 years of market cycles.
The 1995 to 2007 boom: Walsall started at £43,005 in January 1995. By December 2000, prices had reached £55,720, a 29.6% rise over six years. Growth then accelerated hard through the early 2000s as cheap credit and a buoyant Black Country market pushed the average to £123,873 by December 2005. Prices peaked at £138,764 in December 2007.
2008 to 2009, the financial crisis: Walsall fell from its December 2007 peak of £138,764 to a trough of £113,192 in July 2009, a decline of 18.4% over 19 months. The worst year-on-year reading was -14.9% in July 2009. As a lower-priced market with a higher share of mortgaged and first-time buyers, Walsall took a deeper hit than the England fall of 18.2% from peak to trough, with affordable Black Country stock the most exposed when lending tightened.
The 2010 to 2013 stagnation: Prices bounced off the July 2009 trough but then went nowhere for several years. The average stood at £118,090 by December 2010 and was still only £118,525 by December 2012, before edging up to £123,575 by December 2013. Walsall spent four years essentially flat, well short of its pre-crash level.
Recovery, 2014 to 2016: Growth returned slowly. Prices rose from £126,482 in December 2014 to £139,923 in June 2016, the first month the average climbed back above the December 2007 pre-crash peak of £138,764. The recovery took eight and a half years, longer than England's, reflecting how deep the 2010 to 2013 stagnation ran in lower-priced Midlands markets.
The 2017 to 2019 pre-pandemic growth: Steady single-digit growth followed. The average moved from £149,466 in December 2017 to £158,784 in December 2018 and £160,964 in December 2019. This was the most settled stretch of the cycle, with annual growth running in the low single digits.
2020 to 2022, the pandemic surge: The stamp duty holiday and the race for space lifted affordable commuter markets like Walsall sharply. Prices rose from £162,086 in June 2020 to £171,836 by December 2020, then to £179,842 by December 2021 and £204,350 by December 2022, a 13.6% annual jump in the final year of the surge.
The 2023 rate shock: Higher mortgage rates cooled the market. Prices eased to £200,273 by June 2023 before recovering modestly to £203,841 by December 2023. The correction was shallow, with the lower price base limiting how far values could fall.
2024 to present: Prices reached £205,930 by December 2024 and ran on to an all-time high of £218,058 in December 2025, before easing to £212,390 by the latest March 2026 reading. That recent dip of 2.6% off the December 2025 high is a gentle softening rather than a correction, and the current price still sits 53.1% above the December 2007 pre-crash peak.
Long-term growth summary:
- 5 years (March 2021 to March 2026): 21.4% growth (£174,989 to £212,390)
- 10 years (March 2016 to March 2026): 61.6% growth (£131,409 to £212,390)
- 15 years (March 2011 to March 2026): 83.6% growth (£115,687 to £212,390)
- 20 years (March 2006 to March 2026): 70.0% growth (£124,942 to £212,390)
- 30 years (January 1995 to March 2026): 393.9% growth (£43,005 to £212,390)
Walsall's 18.4% crash was deeper than the England average, the price you pay for an affordable, mortgage-reliant market, but the 30-year return of 393.9% shows that the low base has compounded into strong long-term growth. An investor who bought at the exact December 2007 peak would now be sitting on a 53.1% gain on the Land Registry average, despite buying at the worst possible moment.
- All property types
- Detached
- Semi-detached
- Terraced
- Flats
- All property types
- Detached
- Semi-detached
- Terraced
- Flats
Sold House Prices in Walsall
The average sold price across all property types in Walsall is £212,390, which is 26.7% below the England average of £289,946 as of March 2026. That discount runs across every property type, but it is widest at the bottom of the market. Flats are 44.5% below the England figure while detached houses are 25.5% below. The pattern fits a borough where the cheaper, smaller stock is where most of the rental activity sits.
| Property Type | Walsall Average | England Average | Difference |
|---|---|---|---|
| Detached houses | £350,453 | £470,492 | -25.5% |
| Semi-detached houses | £226,724 | £288,185 | -21.3% |
| Terraced houses | £187,681 | £243,788 | -23.0% |
| Flats and maisonettes | £119,031 | £214,563 | -44.5% |
| All property types | £212,390 | £289,946 | -26.7% |
Detached houses at £350,453 carry the borough's largest average price tag and a 25.5% discount to England's £470,492. They concentrate in the eastern postcodes, B74 (Streetly, Little Aston) and WS9 (Aldridge), where the borough takes on a suburban character closer to neighbouring Sutton Coldfield than to the Black Country towns. Annual growth of 1.8% points to a stable rather than a heated market.
Semi-detached houses at £226,724 sit 21.3% below England's £288,185 and just above the borough average. This is Walsall's mainstream stock, spread across almost every postcode, from the inter-war estates of Bloxwich and Wednesbury to the family streets of Willenhall. Annual growth of 2.4% is the strongest of the four property types and reflects steady owner-occupier and landlord demand for the borough's most common home.
Terraced houses at £187,681 offer a 23.0% discount to England's £243,788. The terraced stock is densest in the town-centre and western postcodes, WS1 (Town Centre, Caldmore), WS2 (Pleck, Bentley) and WV13 (Willenhall), where Victorian and early-20th-century terraces form the backbone of the lower-priced rental market. Annual growth of 1.6% keeps terraced values moving gently upward.
Flats and maisonettes at £119,031 show the deepest discount at 44.5% below England's £214,563. Walsall has a relatively thin flat market, concentrated around the town centre, so flat values reflect purely local demand without the institutional buying that lifts apartment prices in larger cities. Annual change of -3.6% confirms a soft flat market and the only property type in the borough showing a price fall.
Price Per Square Foot in Walsall
£161 per square foot separates Walsall's cheapest postcode from its dearest, with WS1 at £190 and B74 at £351. Measuring by the square foot strips out how big the homes are and isolates what each location itself commands. B74 (Streetly, Little Aston) tops the table by a clear margin, reflecting the large detached homes and the affluent suburban feel of the borough's eastern fringe.
| Rank | Area | Price Per Sq Ft |
|---|---|---|
| 1 | WS1 (Town Centre, Caldmore) | £190 |
| 2 | WS2 (Pleck, Bentley) | £193 |
| 3 | WV13 (Willenhall) | £217 |
| 4 | WS10 (Wednesbury) | £224 |
| 5 | WS3 (Bloxwich, Pelsall) | £233 |
| 6 | WS4 (Rushall, Shelfield) | £241 |
| 7 | WV12 (Willenhall, Short Heath) | £243 |
| 8 | WS8 (Brownhills) | £248 |
| 9 | WS5 (Bescot, Tamebridge) | £286 |
| 10 | WS9 (Aldridge) | £288 |
| 11 | B74 (Streetly, Little Aston) | £351 |
WS1 at £190 per square foot is the cheapest bricks-and-mortar value in the borough. The town-centre and Caldmore stock leans towards smaller terraces and flats, the kind of space a buy-to-let investor buys for income, and the figure is based on 250 transactions analysed. WS2 at £193 sits just above it on a much larger sample of 421 transactions, so the two western postcodes share the lowest cost of space in Walsall.
B74 at £351 per square foot tops the table, 85% above WS1, on 599 transactions analysed. That premium buys location: the detached homes of Streetly and Little Aston, a Sutton Coldfield-facing suburb that sits apart from the rest of the borough in both price and character. When a buyer pays this much per square foot in Walsall, they are paying for that setting rather than for rental income.
For Sale Asking Prices in Walsall
WS2 at £185,999 and B74 at £516,097 sit 178% apart, the widest asking-price gap of any postcode pair in the borough. That hierarchy mirrors sold prices but stretches further at the top. The mean asking price across all 11 Walsall postcodes is £284,303.
| Rank | Area | Asking Price |
|---|---|---|
| 1 | WS2 (Pleck, Bentley) | £185,999 |
| 2 | WS1 (Town Centre, Caldmore) | £218,693 |
| 3 | WV13 (Willenhall) | £219,712 |
| 4 | WS10 (Wednesbury) | £232,271 |
| 5 | WS8 (Brownhills) | £233,360 |
| 6 | WV12 (Willenhall, Short Heath) | £243,170 |
| 7 | WS3 (Bloxwich, Pelsall) | £248,642 |
| 8 | WS4 (Rushall, Shelfield) | £290,563 |
| 9 | WS9 (Aldridge) | £353,790 |
| 10 | WS5 (Bescot, Tamebridge) | £385,034 |
| 11 | B74 (Streetly, Little Aston) | £516,097 |
WS2 at £185,999 is the cheapest way into Walsall and the only postcode with an asking price below the borough's Land Registry sold average of £212,390. Pleck and Bentley hold a dense pool of terraced and semi-detached stock close to the town centre, which is why this postcode pairs the lowest asking price with the borough's highest yield. For an investor on a fixed budget, WS2 buys the most property for the money.
B74 at £516,097 is the clear outlier. Streetly and Little Aston sit on the Sutton Coldfield border and trade like a Birmingham commuter suburb rather than a Black Country town: the asking price is nearly three times WS2's and almost double the next-dearest Walsall postcode, WS5 at £385,034. The four dearest postcodes, B74, WS5, WS9 and WS4, are all eastern or southern fringe and account for the borough's premium, owner-occupier end.

House Price Growth in Walsall
Every Walsall postcode posted positive five-year growth, ranging from 5.4% in B74 to 48.6% in WS1, but the one-year picture is far more mixed. WS1 (Town Centre, Caldmore) leads the five-year table by a wide margin, while four postcodes show one-year price falls. The spread shows a borough where the cheaper western postcodes have done the heavy lifting on capital growth over the medium term.
| Area | 1 Year | 3 Years | 5 Years |
|---|---|---|---|
| WS1 (Town Centre, Caldmore) | 1.4% | 13.0% | 48.6% |
| WV12 (Willenhall, Short Heath) | 5.6% | 9.8% | 29.1% |
| WS10 (Wednesbury) | 9.6% | 10.3% | 28.0% |
| WS3 (Bloxwich, Pelsall) | -4.1% | 2.6% | 26.4% |
| WS8 (Brownhills) | 5.2% | 11.5% | 25.1% |
| WV13 (Willenhall) | -0.7% | 7.6% | 24.3% |
| WS2 (Pleck, Bentley) | -0.7% | 3.1% | 24.2% |
| WS9 (Aldridge) | 1.2% | 1.8% | 19.1% |
| WS5 (Bescot, Tamebridge) | 3.0% | -3.4% | 17.1% |
| WS4 (Rushall, Shelfield) | -3.0% | 6.2% | 14.2% |
| B74 (Streetly, Little Aston) | 6.6% | 4.0% | 5.4% |
WS1 at 48.6% five-year growth is in a league of its own, nearly 20 points clear of the next postcode. The town-centre and Caldmore stock started from the lowest price base in the borough, and its 13.0% three-year and 1.4% one-year readings show the climb has continued, if at a gentler pace recently. That is the classic low-base catch-up an affordable inner area produces when a wider market lifts.
WS10 (Wednesbury) is the standout on recent momentum, up 9.6% over a year and 10.3% over three, the only postcode strong across both the short and medium term. At the other end, B74 (Streetly, Little Aston) shows the borough's weakest five-year figure at 5.4%; the dearest postcode has grown the least over five years, and premium suburban stock has grown more slowly than the cheaper homes lower down the table.
Monthly Property Sales in Walsall
Monthly sales across Walsall's postcodes range from 10 to 35 transactions, with turnover rates spanning 8% in B74 to 22% in WS8 and WV12. Higher turnover means homes change hands more often, which points to an easier exit when an investor comes to sell. The busiest postcodes by volume are not always the ones with the quickest turnover, because a larger or pricier housing stock can record steady sales while still turning over slowly.
| Area | Sales Per Month | Turnover | Asking Price |
|---|---|---|---|
| WS3 (Bloxwich, Pelsall) | 35 | 17% | £248,642 |
| B74 (Streetly, Little Aston) | 29 | 8% | £516,097 |
| WS2 (Pleck, Bentley) | 19 | 20% | £185,999 |
| WS10 (Wednesbury) | 18 | 11% | £232,271 |
| WS9 (Aldridge) | 18 | 9% | £353,790 |
| WS5 (Bescot, Tamebridge) | 16 | 15% | £385,034 |
| WS8 (Brownhills) | 15 | 22% | £233,360 |
| WS4 (Rushall, Shelfield) | 14 | 12% | £290,563 |
| WV12 (Willenhall, Short Heath) | 13 | 22% | £243,170 |
| WS1 (Town Centre, Caldmore) | 10 | 10% | £218,693 |
| WV13 (Willenhall) | 10 | 15% | £219,712 |
WS8 (Brownhills) and WV12 (Willenhall, Short Heath) share the borough's highest turnover at 22%, well ahead of the rest. A high turnover rate in these mid-priced postcodes means a deeper pool of buyers waiting when it is time to sell, the kind of liquidity an investor values when planning an exit. WS3 (Bloxwich, Pelsall) records the most transactions at 35 a month, but on a larger housing stock that works out to a steadier 17% turnover.
B74 (Streetly, Little Aston) sits at the other end with the lowest turnover at 8%, despite its 29 sales a month. The premium homes here are bought to live in and held for the long term, so the stock changes hands slowly. WS9 (Aldridge) shows a similar pattern at 9%, confirming that the eastern, higher-priced postcodes are the slowest-moving part of the Walsall market.
How Long Properties Take to Sell in Walsall
Selling speed splits Walsall sharply: WS8 (Brownhills) clears fastest at around 152 days, while B74 (Streetly, Little Aston) sits longest at roughly 380 days. Two postcodes can show a similar yield yet very different exit times, and that gap is a real holding cost. Days on market is the typical time a home is listed before it sells, and the months of unsold stock shows how much for-sale supply is sitting there at the current sales rate.
| Area | Avg Days to Sell | Months of Unsold Stock | Market |
|---|---|---|---|
| WS8 (Brownhills) | 152 | 5.0 | Seller's market |
| WS2 (Pleck, Bentley) | 160 | 5.3 | Seller's market |
| WV12 (Willenhall, Short Heath) | 160 | 5.3 | Seller's market |
| WS3 (Bloxwich, Pelsall) | 190 | 6.3 | Balanced market |
| WS5 (Bescot, Tamebridge) | 217 | 7.1 | Balanced market |
| WV13 (Willenhall) | 217 | 7.1 | Balanced market |
| WS4 (Rushall, Shelfield) | 234 | 7.7 | Balanced market |
| WS1 (Town Centre, Caldmore) | 254 | 8.3 | Balanced market |
| WS10 (Wednesbury) | 304 | 10.0 | Balanced market |
| WS9 (Aldridge) | 304 | 10.0 | Balanced market |
| B74 (Streetly, Little Aston) | 380 | 12.5 | Buyer's market |
WS2 (Pleck, Bentley) is the postcode to weigh carefully here: it carries the borough's highest yield at 6.2% and sells in about 160 days with only 5.3 months of unsold stock, so the income and the exit both work in the investor's favour. B74's 380 days and 12.5 months of supply mean money tied up far longer at the point of sale, on top of the lowest yield in the borough, which is the trade-off that comes with buying at the premium eastern end.
What Type of Property Can You Buy in Walsall?
Semi-detached houses are the largest single category in most Walsall postcodes, peaking at 54.5% of stock in WV12, while detached homes dominate only in the eastern WS9 and B74. The mix of housing stock shapes which strategy fits each postcode. The figures below are drawn from 2021 Census records for each postcode.
| Area | Detached | Semi-detached | Terraced | Flats |
|---|---|---|---|---|
| WS1 (Town Centre, Caldmore) | 14.2% | 35.0% | 25.6% | 25.1% |
| WS2 (Pleck, Bentley) | 6.9% | 42.6% | 27.0% | 23.3% |
| WS3 (Bloxwich, Pelsall) | 19.4% | 44.5% | 22.9% | 11.3% |
| WS4 (Rushall, Shelfield) | 29.2% | 42.2% | 13.4% | 15.3% |
| WS5 (Bescot, Tamebridge) | 39.9% | 35.8% | 12.1% | 12.1% |
| WS8 (Brownhills) | 25.6% | 44.9% | 15.3% | 13.3% |
| WS9 (Aldridge) | 49.3% | 33.3% | 8.0% | 9.3% |
| WS10 (Wednesbury) | 10.2% | 50.3% | 21.4% | 18.0% |
| WV12 (Willenhall, Short Heath) | 18.2% | 54.5% | 15.9% | 11.4% |
| WV13 (Willenhall) | 14.8% | 41.9% | 20.6% | 22.3% |
| B74 (Streetly, Little Aston) | 47.0% | 22.2% | 3.5% | 27.3% |
WS2 (Pleck, Bentley) holds the borough's smallest detached share at 6.9% and one of the largest terraced shares at 27.0%, with flats adding another 23.3%. That smaller-unit stock is exactly what tends to form a buy-to-let market, and it lines up with WS2 carrying the lowest asking price and the highest yield in Walsall. The town-centre WS1 follows a similar pattern, with a quarter of its stock terraced and another quarter flats.
WS9 (Aldridge) and B74 (Streetly, Little Aston) are the detached-dominated postcodes at 49.3% and 47.0%, with the smallest terraced shares in the borough. Their housing is weighted towards owner-occupier family homes, which matches their premium asking prices and lowest yields. Semi-detached houses are the connective tissue across the rest of Walsall, the most common type in postcodes from Wednesbury to Willenhall.
Flats cover both purpose-built blocks and converted units. A small share of mobile and temporary dwellings is excluded, so rows may not add up to 100%.

Walsall Rental Market Analysis
Monthly rents in Walsall run from £825 in WS1 to £1,286 in B74, with gross rental yields from 3.0% to 6.2% across the eight postcodes that carry rental data. For investors asking is buy to let worth it in Walsall, the sections below break down rents, yields, and tenant affordability postcode by postcode. If you are working out how to build a property portfolio in the West Midlands, Walsall's low price base is what lets its rents convert into yields above the regional norm. Browse current buy-to-let homes for sale across the region.
Average Rent & Gross Rental Yields in Walsall
Gross rental yields in Walsall range from 3.0% in B74 to 6.2% in WS2. The cheapest postcode delivers the highest yield and the dearest delivers the lowest, the inverse relationship that holds across most of the borough. WS2 charges a middling £959 a month but tops the yield table because its £185,999 asking price is the lowest in Walsall. Three postcodes (WS4, WS8 and WS9) carry too few rental listings to publish a reliable yield, so their rent and yield cells read "Not enough data".
| Area | Average Monthly Rent | Asking Price | Gross Yield |
|---|---|---|---|
| WS2 (Pleck, Bentley) | £959 | £185,999 | 6.2% |
| WV13 (Willenhall) | £944 | £219,712 | 5.2% |
| WS3 (Bloxwich, Pelsall) | £1,008 | £248,642 | 4.9% |
| WS10 (Wednesbury) | £955 | £232,271 | 4.9% |
| WV12 (Willenhall, Short Heath) | £964 | £243,170 | 4.8% |
| WS1 (Town Centre, Caldmore) | £825 | £218,693 | 4.5% |
| WS5 (Bescot, Tamebridge) | £1,199 | £385,034 | 3.7% |
| B74 (Streetly, Little Aston) | £1,286 | £516,097 | 3.0% |
| WS8 (Brownhills) | Not enough data | £233,360 | Not enough data |
| WS4 (Rushall, Shelfield) | Not enough data | £290,563 | Not enough data |
| WS9 (Aldridge) | Not enough data | £353,790 | Not enough data |
WS2 at 6.2% pairs the lowest asking price in the borough with a solid £959 monthly rent, and a 30% deposit of £55,800 buys into the highest-yielding postcode in Walsall. Pleck and Bentley sit close to the town centre with the dense terraced and semi-detached stock that lets reliably, which is what keeps the income return at the top of the table.
B74 at 3.0% sits at the bottom of the yield table even though it commands the highest rent at £1,286 a month. The £516,097 asking price in Streetly and Little Aston means that strong rent still produces a weak return; this is a postcode bought for the home and the location rather than for the yield, and the rental figures confirm it.
Gross Rental Yield by Postcode
Is Walsall Rent High?
Monthly rents in Walsall take between 29.1% and 45.3% of the local median gross monthly salary. The widely cited affordability threshold is 30% of gross income. Only WS1 falls below that line, and the rest sit above it, a reflection of Walsall's below-average local wages rather than unusually high rents. The lower the local salary, the larger the share even a modest rent consumes.
The median gross weekly salary in Walsall is £654.50, which equates to £2,836 per month or £34,036 per year. This is below both the West Midlands regional median of £712.50 per week and the Great Britain median of £752.40 per week. Data from the Nomis Labour Market Profile (ASHE 2025).
| Rank | Area | Rent as % of Income |
|---|---|---|
| 1 | B74 (Streetly, Little Aston) | 45.3% |
| 2 | WS5 (Bescot, Tamebridge) | 42.3% |
| 3 | WS3 (Bloxwich, Pelsall) | 35.5% |
| 4 | WV12 (Willenhall, Short Heath) | 34.0% |
| 5 | WS2 (Pleck, Bentley) | 33.8% |
| 6 | WS10 (Wednesbury) | 33.7% |
| 7 | WV13 (Willenhall) | 33.3% |
| 8 | WS1 (Town Centre, Caldmore) | 29.1% |
| — | WS4 (Rushall, Shelfield) | Not enough data |
| — | WS8 (Brownhills) | Not enough data |
| — | WS9 (Aldridge) | Not enough data |
WS1 at 29.1% is the most affordable postcode for tenants, the only one inside the 30% threshold. An £825 monthly rent against a £2,836 monthly salary leaves room in the budget, and that headroom matters for a landlord: tenants who are not stretched tend to stay longer and fall into arrears less often. The borough's median against B74's £1,286 rent is what pushes that postcode to 45.3%, though the tenants who can afford Streetly homes are typically dual-income households well above the median.
The cluster of postcodes in the 33% to 36% band, from Willenhall to Wednesbury, reflects rents that are modest in cash terms but sit just above the affordability line because local wages are below the national average. For benefit-supported tenancies in this band, Local Housing Allowance becomes the figure that anchors what rent the market can bear.
How Big Is Walsall's Private Rented Sector?
The private rented sector is deepest in the town-centre and western postcodes, reaching 28.2% of households in WS1, and shallowest in the eastern WS9 at 8.7%. The share of homes already rented privately points to the size of the established tenant pool and how tested the local lettings market is. The table below shows household tenure by postcode.
| Area | Owned Outright | Owned with Mortgage | Private Rented | Social Rented |
|---|---|---|---|---|
| WS1 (Town Centre, Caldmore) | 26.2% | 22.4% | 28.2% | 22.6% |
| WV13 (Willenhall) | 26.6% | 22.8% | 25.1% | 24.7% |
| WS2 (Pleck, Bentley) | 26.1% | 20.4% | 23.8% | 29.0% |
| B74 (Streetly, Little Aston) | 41.9% | 34.2% | 17.6% | 6.1% |
| WS10 (Wednesbury) | 25.1% | 24.3% | 17.2% | 32.4% |
| WS3 (Bloxwich, Pelsall) | 30.6% | 25.0% | 15.6% | 27.1% |
| WS5 (Bescot, Tamebridge) | 40.3% | 32.4% | 14.1% | 12.8% |
| WS4 (Rushall, Shelfield) | 39.5% | 31.6% | 12.2% | 15.6% |
| WV12 (Willenhall, Short Heath) | 43.5% | 29.4% | 11.4% | 15.2% |
| WS8 (Brownhills) | 35.6% | 30.1% | 10.8% | 21.9% |
| WS9 (Aldridge) | 48.5% | 35.4% | 8.7% | 7.0% |
WS1, WV13 and WS2 hold the largest private rented sectors in the borough, between roughly a quarter and 28% of households. A deep existing rented sector points to an active lettings market and a wide pool of renters already in place, and it is no accident that these three western postcodes also carry the highest yields. WS2 pairs its 23.8% rented share with the borough-topping 6.2% yield, while WS1 combines the deepest rented sector with the most affordable rent-to-income ratio.
WS9 (Aldridge) sits at the other extreme with just 8.7% private rented and the highest outright ownership at 48.5%, the profile of a settled owner-occupier suburb rather than a rental market. The town-centre and western postcodes also carry the borough's largest social-rented shares, from 22.6% in WS1 to 32.4% in WS10, which is part of why Local Housing Allowance is a live consideration in those areas.
Rental-listing volume is thin in most of Walsall, so it can be read with confidence in only three postcodes, B74, WS1 and WS10, where the balance currently sits with landlords rather than tenants. WS1 had around 38 homes advertised to rent and let in about 40 days on average, a sign of steady tenant demand against limited supply. The other postcodes have too few rental listings at any one time to read reliably.
Local Housing Allowance Rates in Walsall
Walsall straddles two Broad Rental Market Areas: the ten western and central postcodes fall in the Black Country BRMA, where Local Housing Allowance runs from £73.64 a week for a shared room to £212.88 for a four-bedroom home, while B74 alone sits in the higher Birmingham BRMA. Local Housing Allowance sets the maximum housing support a tenant on benefits can receive, so for the lower end of the market it works as a rent floor. The rates below apply from June 2026; to check the current rate for a specific address, use the government's official Local Housing Allowance calculator.
| Property Size | Black Country BRMA (weekly) | Birmingham BRMA (weekly, B74) |
|---|---|---|
| Shared accommodation | £73.64 | £78.61 |
| 1 bedroom | £113.92 | £159.95 |
| 2 bedrooms | £143.84 | £172.60 |
| 3 bedrooms | £172.60 | £189.86 |
| 4 bedrooms | £212.88 | £253.15 |
For most of Walsall, the Black Country two-bedroom rate of £143.84 a week works out at about £623 a month, which sits below the £944 to £1,008 open-market rents recorded across the western postcodes. A benefit-backed tenancy at the LHA rate therefore comes in under Walsall's open-market rents, and the stock that fits within these rates is concentrated in WS1, WS2 and WV13, where both asking prices and rents are lowest. B74 (Streetly, Little Aston) is the single exception that falls in the Birmingham BRMA, where every rate is higher, but it is also the borough's least likely postcode for a benefit-funded let given its prices.
Buy-to-Let Considerations
Are House Prices High in Walsall? Price-to-Earnings Ratios
Buying in Walsall takes between 5.5 and 15.2 times the local median annual salary. This is based on the Nomis Labour Market Profile for Walsall, which puts the median gross annual income for Walsall residents at £34,036.
The national benchmark for price-to-earnings is 7.4x (England's average sold price of £289,946 divided by the Great Britain median annual salary of £39,125). Seven of Walsall's 11 postcodes sit below that national benchmark, meaning they are more affordable against local incomes than the England average is against national incomes.
| Rank | Area | Price-to-Earnings Ratio |
|---|---|---|
| 1 | WS2 (Pleck, Bentley) | 5.5x |
| 2 | WS1 (Town Centre, Caldmore) | 6.4x |
| 3 | WV13 (Willenhall) | 6.5x |
| 4 | WS10 (Wednesbury) | 6.8x |
| 5 | WS8 (Brownhills) | 6.9x |
| 6 | WV12 (Willenhall, Short Heath) | 7.1x |
| 7 | WS3 (Bloxwich, Pelsall) | 7.3x |
| 8 | WS4 (Rushall, Shelfield) | 8.5x |
| 9 | WS9 (Aldridge) | 10.4x |
| 10 | WS5 (Bescot, Tamebridge) | 11.3x |
| 11 | B74 (Streetly, Little Aston) | 15.2x |
WS2 at 5.5x is the most affordable postcode in Walsall against local earnings, well below the national 7.4x benchmark. At five and a half times the local salary, Pleck and Bentley sit in the band where a buy-to-let purchase is most achievable for a local buyer, and that affordability underpins both the demand and the yield. The seven postcodes below the benchmark are all western or central, the income-focused half of the borough.
B74 at 15.2x is more than double the national benchmark and the least affordable postcode by a wide margin. At over fifteen times the local median salary, Streetly and Little Aston are bought by households earning well above the Walsall average or trading in from pricier parts of the region. For an investor, that ratio compresses the yield and lengthens the payback, which is why the premium postcodes sit at the bottom of the rental return table.
Deposit Requirements in Walsall
A 30% deposit on a buy-to-let property in Walsall ranges from £55,800 in WS2 to £154,829 in B74. The gap between the cheapest and most expensive deposit is £99,029, almost enough to fund a second WS2 deposit twice over. For investors comparing Walsall with the wider West Midlands, the western postcodes sit among the most affordable entry points in the conurbation, while the eastern fringe runs closer to Solihull money.
Beyond the deposit, the stamp duty calculation and other buy-to-let running costs affect the total capital required.
| Rank | Area | 30% Deposit Required |
|---|---|---|
| 1 | WS2 (Pleck, Bentley) | £55,800 |
| 2 | WS1 (Town Centre, Caldmore) | £65,608 |
| 3 | WV13 (Willenhall) | £65,913 |
| 4 | WS10 (Wednesbury) | £69,681 |
| 5 | WS8 (Brownhills) | £70,008 |
| 6 | WV12 (Willenhall, Short Heath) | £72,951 |
| 7 | WS3 (Bloxwich, Pelsall) | £74,592 |
| 8 | WS4 (Rushall, Shelfield) | £87,169 |
| 9 | WS9 (Aldridge) | £106,137 |
| 10 | WS5 (Bescot, Tamebridge) | £115,510 |
| 11 | B74 (Streetly, Little Aston) | £154,829 |
WS2 is the cheapest way into Walsall at a £55,800 deposit, and it happens to be the highest-yielding postcode too, so the lowest capital outlay buys the strongest income return. Stepping up to WS1 or WV13 costs roughly £10,000 more and lands in the same income-focused western band, where deposits stay under £75,000 and yields run between 4.5% and 5.2%. For an investor building a portfolio on a fixed budget, the seven postcodes below £75,000 are where Walsall does its work.
The deposits then climb steeply at the eastern end. WS9 (Aldridge) at £106,137 and B74 (Streetly, Little Aston) at £154,829 ask for two to three times the WS2 figure, and they buy a different proposition: lower yields, slower-moving stock and a suburban character. The £99,029 gap between the cheapest and dearest deposit is, in effect, the price of choosing capital character over rental income.

What the Walsall Data Tells Buy-to-Let Investors
In Walsall the cheapest way in is also the highest-yielding postcode. WS2 (Pleck, Bentley) holds the top yield at 6.2%, the lowest asking price for an investment property in Walsall at £185,999, and the most affordable prices against local earnings at 5.5 times income. A 30% deposit there is £55,800, the lowest in the borough, for a home renting at £959 a month, and the postcode sells in about 160 days with a tight 5.3 months of unsold stock.
The income-focused half of the borough is its western and central postcodes. WV13, WS1, WS3, WS10 and WV12 all carry yields between 4.5% and 5.2% on deposits under £75,000, and they hold the borough's deepest private rented sectors, between roughly a fifth and 28% of households. WS1 leads on capital growth with a 48.6% five-year rise off the borough's lowest price base, while WS10 (Wednesbury) shows the strongest recent momentum at 9.6% over a year.
The eastern fringe is a different proposition. B74 (Streetly, Little Aston) carries the highest rent at £1,286 a month, but with a 3.0% yield, a 15.2 times price-to-earnings ratio and 380 days to sell, the premium price does far more for the prestige than for the return. Buyers who want to come in below asking often work the off-market property routes, where the cheaper entries surface before a property is openly listed.
Walsall has no selective licensing scheme for private landlords across the borough, though shared houses fall under HMO and additional HMO licensing set out on Walsall Council's property licensing pages. With below-average wages, a low cost of entry and rents that convert into yields above the regional norm, it reads as an income-first market: lower prices, higher yields, and a tenant base whose affordability ceiling makes Local Housing Allowance a real reference point at the lower end.
How Walsall Compares
Walsall's mean asking price of £284,303 is the fourth-cheapest of five West Midlands locations compared here, and its top yield of 6.2% is the second-highest in the group. The comparison below places Walsall alongside four neighbouring markets, each with a different investor profile. The mean asking price and mean monthly rent are simple averages across all postcodes with data; top gross yield is the single highest postcode yield in each location.
| Location | Mean Asking Price | Mean Monthly Rent | Mean Gross Yield | Top Yield (postcode) |
|---|---|---|---|---|
| Wolverhampton | £255,437 | £986 | 4.6% | 5.5% (WV1) |
| Birmingham | £274,029 | £1,111 | 4.9% | 7.2% (B18) |
| Dudley | £274,570 | £947 | 4.1% | 5.0% (DY4, WV14) |
| Walsall | £284,303 | £1,017 | 4.3% | 6.2% (WS2) |
| Coventry | £293,448 | £1,085 | 4.4% | 6.9% (CV1) |
Walsall's mean asking price of £284,303 sits in the upper half of this group, pulled up by its expensive eastern postcodes, yet its 6.2% top yield is bettered only by Birmingham at 7.2% and Coventry at 6.9%. Wolverhampton on its western border offers the cheapest mean asking price in the comparison at £255,437 but a lower top yield of 5.5%, while Dudley to the south sits at a similar price point with the group's lowest top yield at 5.0%.
For investors chasing income, Birmingham at 7.2% and Coventry at 6.9% lead the group on top-line yield, both larger and deeper markets than Walsall. Walsall's case is its specific WS2 entry point: the borough's single cheapest postcode delivers a 6.2% yield that holds its own against far bigger cities, on a deposit of £55,800. For a data-driven view across the whole country, see our guide to the best buy-to-let areas.
Frequently Asked Questions
Is Walsall a good place to live for buy-to-let tenants?
For the right tenant, yes, and it comes down to cost. Walsall's rents are modest in cash terms, from around £825 a month in WS1 up to about £1,008 in WS3, on a local median wage of £654.50 a week. That keeps the borough accessible to working tenants and to households on housing support, which is a large part of who rents here.
The flip side is that local wages sit below the West Midlands and national averages, so a meaningful share of tenancies sits close to the benefit-funded end of the market. For a landlord, that means steady demand for affordable, well-priced homes rather than a premium professional-rental story.
What are the best areas in Walsall for property investment?
It depends whether you are buying for income or for growth. For yield, the western and central postcodes lead: WS2 (Pleck, Bentley) tops the borough at 6.2% on the lowest asking price of £185,999, with WV13 (Willenhall) at 5.2% and WS3 (Bloxwich, Pelsall) and WS10 (Wednesbury) both at 4.9% close behind.
For capital growth, WS1 (Town Centre, Caldmore) has risen 48.6% over five years off the borough's lowest price base, and WS10 shows the strongest recent run at 9.6% over a year. The eastern postcodes, WS9 (Aldridge) and B74 (Streetly, Little Aston), are premium owner-occupier areas with the highest prices and lowest yields, so they suit a capital-preservation buyer rather than an income one.
How does Walsall compare to Wolverhampton for buy-to-let?
They are close neighbours with a similar affordability story, but Walsall edges it on yield. Wolverhampton has the cheaper mean asking price at £255,437 against Walsall's £284,303, but its top postcode yield is 5.5% where Walsall's WS2 reaches 6.2%. Both are Black Country boroughs with below-average wages and Local Housing Allowance as a live floor at the lower end.
The practical difference is the entry point. Walsall's single cheapest postcode, WS2, undercuts most of Wolverhampton on price while topping it on yield, so an income-focused investor often finds the sharper individual deal in Walsall even though Wolverhampton looks cheaper on the borough average.
Is there demand for HMO and student lets in Walsall?
There is HMO demand, concentrated in the cheaper town-centre and western postcodes where the terraced stock suits room-by-room letting, though Walsall is not a student city in the way Birmingham or Coventry are. Rental-listing volume is thin enough that room-level rents cannot be read reliably across the borough, so anyone modelling an HMO should price it on local lettings evidence rather than a published average.
The borough does have a deep affordable-rental base, with private rented shares of 23% to 28% in WS1, WS2 and WV13, which is the pool an HMO landlord draws from. For how the numbers work on a shared house, see our HMO investment guide.
Can I find buy-to-let property under £200,000 in Walsall?
Yes, more readily than in most of the West Midlands. WS2 (Pleck, Bentley) has the lowest postcode asking price in the borough at £185,999, so the average buy-to-let purchase there already sits under £200,000. Beyond that, property type widens the options: terraced houses across Walsall average £187,681 on the Land Registry index and flats average £119,031, so the cheaper stock in WS1, WS2 and WV13 brings plenty of homes in below the £200,000 mark.
If a lower entry point is the goal, the western postcodes and the terraced-and-flat end of the market are where to look, or explore below market value property.
When will the town-centre regeneration affect Walsall property prices?
Not immediately. The New Town Centre Framework was approved in December 2025 and the £140 million of government funding runs over five years, with visible milestones like the Guildhall reopening in summer 2026 and the Adult Learning Centre opening in September 2027. Any real effect on residential prices is a later-decade story rather than a 2026 one.
What is already underway gives the wider plan credibility: the SPARK Enterprise Hub's first buildings were completed in November 2025 and the council expects it to generate over 1,000 jobs when fully operational. More local jobs support tenant demand, but pricing that in today is looking several years ahead.
What are average house prices in Walsall?
The average sold price across Walsall is £212,390 on the Land Registry index, about 26.7% below the England average of £289,946 as of March 2026. Asking prices by postcode run from £185,999 in WS2 (Pleck, Bentley) up to £516,097 in B74 (Streetly, Little Aston), with a borough-wide mean of £284,303. By type, detached homes average £350,453, semi-detached £226,724, terraced £187,681 and flats £119,031.
Through a buy-to-let lens, WS2 is the cheapest entry and the highest-yielding at 6.2%, while B74 is the dearest and lowest-yielding at 3.0%.
What are the Local Housing Allowance rates in Walsall?
Walsall sits across two Broad Rental Market Areas. Ten of its postcodes fall in the Black Country BRMA, where, as of June 2026, Local Housing Allowance runs at £73.64 a week for a shared room, £113.92 for a one-bed, £143.84 for two beds, £172.60 for three and £212.88 for four. B74 (Streetly, Little Aston) alone falls in the higher Birmingham BRMA, where every rate is higher, from £78.61 for a shared room to £253.15 for four bedrooms. Those figures set the most a tenant on housing support can claim, so for that part of the market they effectively fix a floor.
What type of property is most common in Walsall?
Semi-detached houses, across most of the borough. They run from a third of the stock up to 54.5% in WV12 (Willenhall, Short Heath), and are the most common type in the majority of postcodes. The smaller homes that usually suit buy-to-let, terraces and flats, cluster in the town-centre and western postcodes, with WS1, WS2 and WV13 carrying the largest combined terraced-and-flat shares. Detached houses dominate only at the eastern end, in WS9 (Aldridge) at 49.3% and B74 (Streetly, Little Aston) at 47.0%.
How do I buy an investment property in Walsall?
Start by deciding whether you are buying for income or for growth, because the two goals point to different ends of the borough. WS2 (Pleck, Bentley) is the cheapest entry at £185,999 and the highest-yielding at 6.2%, the natural home for an income buyer. WS1 (Town Centre, Caldmore) pairs a 4.5% yield with the borough's strongest five-year growth at 48.6%. Budget for a 30% deposit, which runs from £55,800 in WS2 to £154,829 in B74.
Beyond what is listed openly, experienced investors often buy below asking through off-market property and BMV property. To see what is available now, browse investment properties or buy-to-let homes for sale.
Ready to buy property?
Browse investment properties with prices and gross yields shown for each opportunity.
Get property alerts