Islington is a borough of inner north London. Average sold prices across Islington stand at £679,463 on the HM Land Registry House Price Index, 134.3% above the England average of £289,946, yet the borough now sits 9.6% below its own May 2024 high of £751,356. That places Islington firmly in prime inner-London territory, dearer than Hackney or Haringey to the east and north but below Camden and Westminster to the west. The local authority's population grew 5.08% between the 2011 and 2021 censuses, from 206,125 to 216,589 residents, in one of the most densely built boroughs in the country.
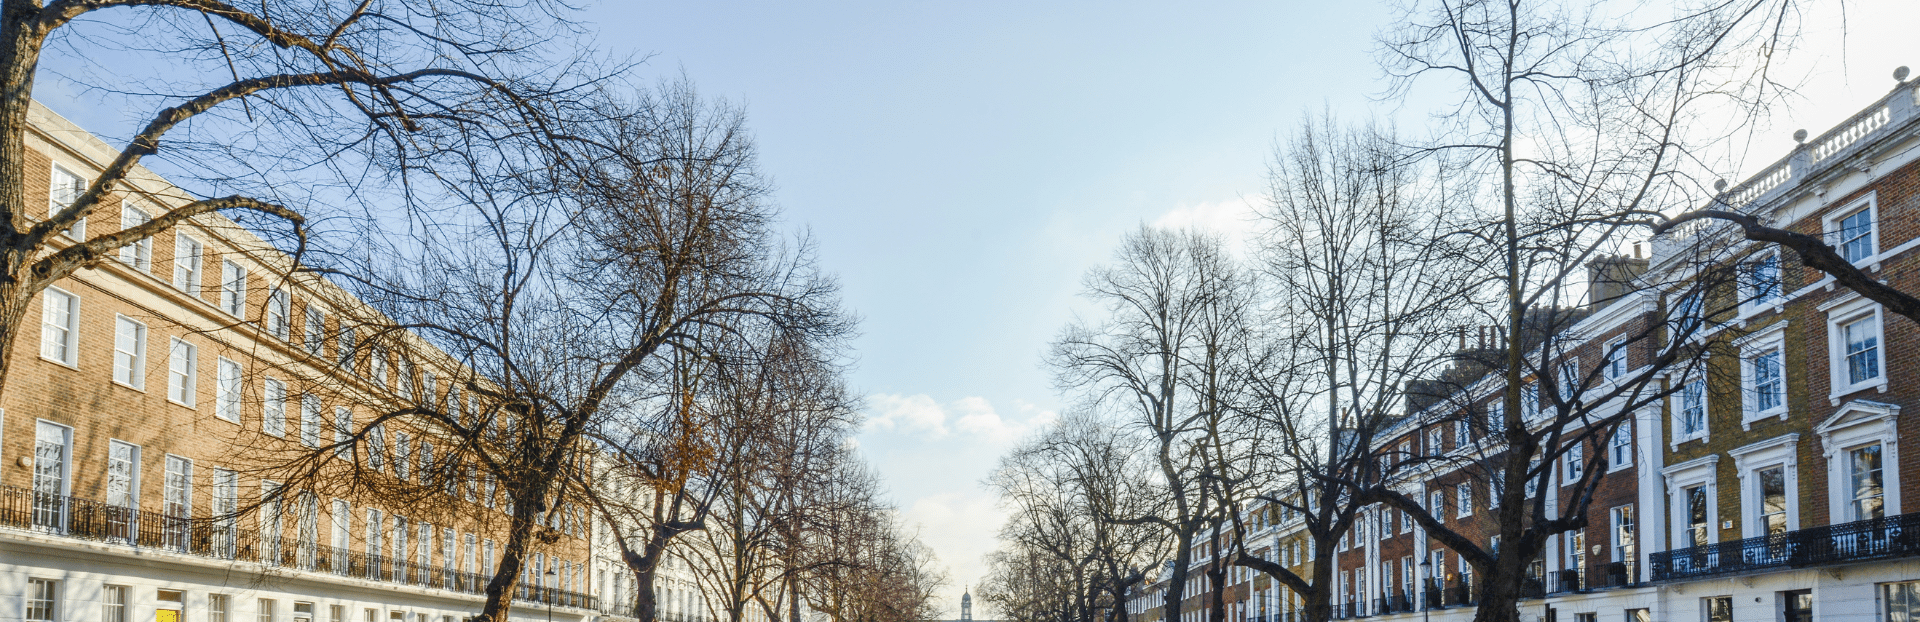
Islington's premium rests on its position. It wraps around the northern edge of the City of London, runs from Clerkenwell and Farringdon in the south up through Angel, Highbury and Holloway to Archway, and pairs some of London's best-known Georgian and Victorian streets with the technology and creative cluster around Old Street. The median gross weekly salary for residents is £974.80, well above the London figure of £892.60 and the Great Britain figure of £752.40. For investors, the headline is a two-tier market: gross yields run from 4.1% in N16 up to 5.3% in N7 and N19, and asking prices from £545,168 in Holloway to £864,025 in Bloomsbury.
This guide covers the London Borough of Islington (ONS code E09000019) across postcodes EC1, N1, N4, N5, N7, N16, N19, NW1 and WC1. Islington sits in inner north London, bordered by Hackney to the east, Camden to the west and Haringey to the north.
Article updated: June 2026

Why Invest in Islington?
Islington added 10,464 residents between the 2011 and 2021 censuses, a 5.08% rise to 216,589, packed into roughly six square miles that make it one of the most densely populated areas in England. That density is the point. Demand for homes consistently outruns the land available to build on, which has underpinned both prices and rents through every cycle since the 1990s.
The local economy leans on Islington's position next to the City of London. Clerkenwell and Farringdon house design, media and professional firms, the technology cluster around Old Street and Angel has drawn start-ups and established tech employers for more than a decade, and the City's financial and legal jobs sit a short walk or one Tube stop south. Resident earnings reflect that: a median gross annual salary of £50,692 is 9.2% above the London median of £46,414 and 29.6% above the Great Britain median of £39,125. Higher local pay supports the rents that Islington's stock commands.
The borough also carries a large student and young-professional population. City, University of London sits in Clerkenwell, London Metropolitan University runs its main campus on Holloway Road in N7, and several other institutions are within a short commute, which keeps a steady flow of sharers and graduate renters moving through the market. The employment rate of 76.1% sits a little above the Great Britain figure of 75.6%.
Islington Economic Summary
- Population (Islington): 216,589 (2021 Census). Growth of 5.08% from 2011.
- Median annual salary: £50,692 (local), £46,414 (London), £39,125 (Great Britain)
- Employment rate: 76.1% (local), 74.9% (London), 75.6% (Great Britain)
- Unemployment rate: 6.8% (local)
- Key economic strengths: Proximity to the City of London, the Old Street and Clerkenwell technology and creative cluster, professional and financial services, higher education
Source: ONS Census 2021, Nomis Labour Market Profile (ASHE 2025, Employment Oct 2024-Sep 2025)
Regeneration and Investment in Islington
The largest single housing project in Islington is Holloway Park, the redevelopment of the former Holloway Prison site in N7, set to deliver 985 homes with the first residents moving in from 2027. In a borough where space to build is scarce, schemes that add several hundred homes at once carry real weight for the local market.
- Holloway Park, N7 (Under construction, 985 homes): Peabody bought the former Holloway Prison site in 2019 and is building 985 homes across three phases, with 60% earmarked as affordable, alongside a Women's Building and public open space. The first phase of social-rent homes has reached topping-out and residents are due from 2027. The scheme reshapes a large, long-closed site in the heart of Holloway. Details at Islington Council.
- Islington New Council Homes Programme (Active, 750+ homes): The council is delivering more than 750 new council homes, which it describes as the biggest council house-building scheme in Islington for a generation, spread across infill and estate sites borough-wide. Updates at Islington Council.
- Old Street and Clerkenwell employment cluster (Established): The technology and creative economy around Old Street, Angel and Clerkenwell continues to draw firms and workers into the south of the borough, sustaining the young-professional rental demand that underpins EC1, N1 and N7.
Source: Office for National Statistics - Population for Islington

Islington Property Market Analysis
Average property prices in Islington have risen 633.9% since January 1995, from £92,577 to £679,463. The sections below trace that journey cycle by cycle, then drill into current postcode-level data for sold prices, price per square foot, asking prices, growth trends and monthly transaction volumes.
When was the last house price crash in Islington?
Islington is recorded as a single local authority by HM Land Registry (ONS code E09000019), so every sold-price average below covers the whole borough. The House Price Index runs from January 1995 to the latest reading in March 2026, covering 31 years of London cycles.
The 1995 to 2007 boom: Islington started at £92,577 in January 1995. London's long bull run carried the borough to £205,968 by December 2000 and £291,468 by December 2005. The market peaked at £419,429 in October 2007, a 353% climb from the 1995 base in little more than a decade.
2008 to 2009, the financial crisis: Prices fell from the October 2007 peak to a trough of £327,025 in March 2009, a drop of 22.0% over 17 months. The worst year-on-year reading was -19.3% in January 2009. Islington's fall was steeper than England's decline of around 18%, which is the usual pattern for high-value London markets: they drop hardest in a downturn and recover fastest afterwards.
The fast recovery, 2010 to 2011: Where many regions spent years stuck below their pre-crash peaks, Islington bounced quickly. By December 2010 the average had reached £408,265, and by April 2011 prices passed the October 2007 peak at £428,455. The borough took around three and a half years to recover, against more than eight years in parts of the North.
The 2012 to 2014 London surge: The capital's post-crisis boom ran hard in Islington. Prices reached £540,199 by December 2013 (16.8% annual growth) and £605,422 by December 2014 (12.1% annual). Cheap money and strong international demand pushed inner-London values up faster than almost anywhere else in the country.
2016 to 2019, the prime-London cooling: Growth then stalled. The average reached £648,277 by December 2016 but drifted to £641,796 by December 2019, slightly below where it had been three years earlier. Tax changes on second homes and buy-to-let from 2016 cooled the top of the London market while cheaper regions kept rising.
2020 to 2022, a muted pandemic: Islington saw none of the surge that lifted commuter and rural markets during the stamp duty holiday. Prices edged from £663,199 in December 2020 (3.3% annual) to £711,978 by December 2021 (7.4% annual), as buyer attention shifted towards space and gardens that inner London could not offer.
The 2023 rate shock and the 2024 high: Higher mortgage rates knocked the market to £676,694 by December 2022 (-5.0% annual), before a recovery carried it to an all-time high of £751,356 in May 2024. Since then prices have eased, to £694,811 by December 2024 and £673,478 by March 2025, settling at £679,463 by March 2026.
Long-term growth summary:
- 5 years (March 2021 to March 2026): -1.1% growth (£687,266 to £679,463)
- 10 years (March 2016 to March 2026): 5.1% growth (£646,444 to £679,463)
- 15 years (March 2011 to March 2026): 65.1% growth (£411,469 to £679,463)
- 20 years (March 2006 to March 2026): 118.7% growth (£310,689 to £679,463)
- 30 years (January 1995 to March 2026): 633.9% growth (£92,577 to £679,463)
The shape of Islington's recent record is what sets it apart. The 30-year return of 633.9% is among the strongest in the country, but the borough is down 1.1% over five years and up just 5.1% over ten, and it currently trades 9.6% below its May 2024 high while still standing 62.0% above the October 2007 pre-crash peak. An investor who bought at the very top in May 2024 would be holding a paper loss today; one who held through the long run has done well.
- All property types
- Detached
- Semi-detached
- Terraced
- Flats
- All property types
- Detached
- Semi-detached
- Terraced
- Flats
Sold House Prices in Islington
The average sold price across all property types in Islington is £679,463, which is 134.3% above the England average of £289,946 as of March 2026. The premium runs across every property type, but it is widest where it is hardest to find space. Semi-detached houses cost 393.2% more than the England average, while flats, the type most investors actually buy here, cost 163.1% more.
| Property Type | Islington Average | England Average | Difference |
|---|---|---|---|
| Detached houses | £1,687,234 | £470,492 | +258.6% |
| Semi-detached houses | £1,421,353 | £288,185 | +393.2% |
| Terraced houses | £1,156,081 | £243,788 | +374.2% |
| Flats and maisonettes | £564,501 | £214,563 | +163.1% |
| All property types | £679,463 | £289,946 | +134.3% |
Detached houses at £1,687,234 are 258.6% above the England average, but they barely exist in Islington. A standalone house in this borough is a rarity, found only on a handful of streets, and the figure reflects a thin, expensive slice of the market rather than anything an investor is likely to buy. Detached values rose 6.3% over the year.
Semi-detached houses at £1,421,353 carry the widest premium of all at 393.2% above England. These are the large period houses of Canonbury, Barnsbury and Highbury, owner-occupier homes that change hands rarely and rose 6.5% over the year, the strongest annual growth of any type in the borough.
Terraced houses at £1,156,081 sit 374.2% above the England average. Islington's terraces, the Georgian and Victorian streets that define areas like Barnsbury and Canonbury, are the family-house end of the market and grew 5.0% over the year.
Flats and maisonettes at £564,501 are 163.1% above England, the narrowest premium of the four types and the part of the market that matters most here. Islington is overwhelmingly a flat borough, and the all-property average of £679,463 sits much closer to the flat figure than to any house type because flats make up the bulk of the stock. Flat values were broadly flat over the year at -0.2%, which is why the headline all-types figure barely moved.
Price Per Square Foot in Islington
£277 per square foot separates Islington's cheapest postcode from its dearest, with N16 at £767 and WC1 at £1,044. Measuring by the square foot strips out how big the homes are and shows what the location itself commands. WC1 (Bloomsbury, Holborn) tops the table, reflecting its central position on the City and West End fringe.
| Rank | Area | Price Per Sq Ft |
|---|---|---|
| 1 | N16 (Stoke Newington, Stamford Hill) | £767 |
| 2 | N4 (Finsbury Park, Manor House) | £780 |
| 3 | N7 (Holloway) | £783 |
| 4 | N19 (Archway, Upper Holloway) | £796 |
| 5 | NW1 (Camden Town, Regent's Park) | £911 |
| 6 | N5 (Highbury) | £949 |
| 7 | N1 (Islington, Barnsbury, Canonbury) | £960 |
| 8 | EC1 (Clerkenwell, Farringdon) | £973 |
| 9 | WC1 (Bloomsbury, Holborn) | £1,044 |
N16 at £767 per square foot is the most affordable space in the borough, covering Stoke Newington and Stamford Hill in the north-east corner. Based on 576 transactions analysed, its rate sits 27% below WC1's. The figure reflects a slightly less central position than the southern postcodes, with the trade-off of more house for the money.
WC1 at £1,044 per square foot tops the table from 182 transactions, with EC1 close behind at £973. These two southern postcodes wrap around the City and West End fringe, where small central flats command the highest rate per square foot in Islington, the opposite end of the spectrum from the larger family stock further north.
For Sale Asking Prices in Islington
N7 at £545,168 and WC1 at £864,025 sit 58.5% apart, the full width of Islington's asking-price range. The hierarchy broadly follows the price-per-square-foot table, with the central southern postcodes dearest and the northern ones cheaper. The mean asking price across all nine postcodes is £699,752.
| Rank | Area | Asking Price |
|---|---|---|
| 1 | N7 (Holloway) | £545,168 |
| 2 | N19 (Archway, Upper Holloway) | £546,223 |
| 3 | N4 (Finsbury Park, Manor House) | £613,648 |
| 4 | N16 (Stoke Newington, Stamford Hill) | £671,958 |
| 5 | N1 (Islington, Barnsbury, Canonbury) | £733,679 |
| 6 | N5 (Highbury) | £749,272 |
| 7 | EC1 (Clerkenwell, Farringdon) | £760,560 |
| 8 | NW1 (Camden Town, Regent's Park) | £813,235 |
| 9 | WC1 (Bloomsbury, Holborn) | £864,025 |
N7 at £545,168 is the cheapest way into the borough, covering Holloway in the north-west. It is the only postcode where the average asking price sits below the borough's Land Registry sold average of £679,463, and at £1,055 below N19 the two Holloway and Archway postcodes are effectively level as the entry point. For a buyer working to a fixed budget, this is where the most property per pound sits.
WC1 at £864,025 is the most expensive, a small-flat market on the Bloomsbury and Holborn fringe of the West End. The step from N7 to WC1 is £318,857, which buys a far more central location rather than more space, and the rental yields in the sections below show what that premium does to the income return.

House Price Growth in Islington
N19 leads Islington's recent growth with a five-year return of 9.1%, the only postcode in double figures, while six of the nine are negative over five years. The growth table tells the same story as the borough-wide cycle: prime inner London has corrected since 2022, and the picture varies sharply by postcode.
| Area | 1 Year | 3 Years | 5 Years |
|---|---|---|---|
| N19 (Archway, Upper Holloway) | 0.4% | -0.1% | 9.1% |
| N4 (Finsbury Park, Manor House) | 3.2% | -6.8% | 2.4% |
| N7 (Holloway) | -1.2% | -2.5% | 1.4% |
| N1 (Islington, Barnsbury, Canonbury) | 1.4% | 0.8% | -2.2% |
| N16 (Stoke Newington, Stamford Hill) | -7.3% | -7.2% | -2.9% |
| NW1 (Camden Town, Regent's Park) | -0.7% | -13.8% | -4.4% |
| N5 (Highbury) | -10.4% | -12.9% | -7.7% |
| EC1 (Clerkenwell, Farringdon) | -11.2% | -17.0% | -20.1% |
| WC1 (Bloomsbury, Holborn) | -14.4% | -27.9% | -31.9% |
N19 (Archway, Upper Holloway) posted a five-year return of 9.1%, the strongest in the borough, helped by buyers priced out of pricier neighbours moving north for relatively cheaper stock. Its one-year and three-year readings of 0.4% and -0.1% are close to flat, so most of that gain landed earlier in the five-year window.
WC1 (Bloomsbury, Holborn) sits at the other end, down 31.9% over five years and 14.4% over the past year. The small central-flat markets of WC1 and EC1, both heavily exposed to investor and overseas buyers, have corrected hardest as that demand thinned, a reminder that the dearest postcode per square foot is not the same as the best recent performer.
Monthly Property Sales in Islington
Islington records around 196 sales a month across its nine postcodes, but they are concentrated in N1, where 48 change hands, more than the four quietest postcodes combined. Transaction volumes and turnover both vary widely, which matters for how easily an investor can buy or later sell.
| Area | Sales Per Month | Turnover | Asking Price |
|---|---|---|---|
| N1 (Islington, Barnsbury, Canonbury) | 48 | 7% | £733,679 |
| N16 (Stoke Newington, Stamford Hill) | 28 | 14% | £671,958 |
| N4 (Finsbury Park, Manor House) | 28 | 7% | £613,648 |
| NW1 (Camden Town, Regent's Park) | 20 | 3% | £813,235 |
| N5 (Highbury) | 19 | 14% | £749,272 |
| N7 (Holloway) | 19 | 6% | £545,168 |
| N19 (Archway, Upper Holloway) | 14 | 8% | £546,223 |
| EC1 (Clerkenwell, Farringdon) | 12 | 3% | £760,560 |
| WC1 (Bloomsbury, Holborn) | 8 | 3% | £864,025 |
N1 is the busiest market at 48 sales a month, a deep, liquid postcode covering the core of Islington around Angel, Barnsbury and Canonbury. For a buyer, more transactions mean more choice and more comparable evidence on price; for a future seller, they point to an easier exit.
N16 and N5 share the highest turnover at 14%, meaning a larger share of their homes change hands each year, while the central southern postcodes EC1, NW1 and WC1 all sit at 3%. Low turnover in those central flats means stock sits longer and sells more slowly, which the selling-times section below sets out in full.
How Long Properties Take to Sell in Islington
Selling is slow across most of Islington: N16 and N5 clear quickest at around 234 days, while EC1, NW1 and WC1 carry roughly 33 months of unsold stock at the current rate of sale. Days on market is the typical time a home is listed before it sells, and months of unsold stock measures how much for-sale supply is queued at the current pace. A headline yield says nothing about how long your money is tied up at the end, and in Islington that exit cost varies far more than the rent does. The table is ranked fastest first.
| Area | Avg Days to Sell | Months of Unsold Stock | Market |
|---|---|---|---|
| N16 (Stoke Newington, Stamford Hill) | 234 | 7.7 | Balanced market |
| N5 (Highbury) | 234 | 7.7 | Balanced market |
| N19 (Archway, Upper Holloway) | 435 | 14.3 | Buyer's market |
| N4 (Finsbury Park, Manor House) | 435 | 14.3 | Buyer's market |
| N1 (Islington, Barnsbury, Canonbury) | 507 | 16.7 | Buyer's market |
| N7 (Holloway) | 507 | 16.7 | Buyer's market |
| EC1 (Clerkenwell, Farringdon) | 1,014 | 33.3 | Buyer's market |
| NW1 (Camden Town, Regent's Park) | 1,014 | 33.3 | Buyer's market |
| WC1 (Bloomsbury, Holborn) | 1,014 | 33.3 | Buyer's market |
The gap is stark. N16 and N5 sit on about 7.7 months of unsold stock and register as balanced markets, while EC1, NW1 and WC1 carry more than four times that supply and read clearly as buyers' markets. For an investor, the slow central postcodes mean room to negotiate on the way in, but also a long, costly wait whenever the time comes to sell. The sales-volume table above explains why: those same central postcodes see the fewest transactions a month.
What Type of Property Can You Buy in Islington?
Flats dominate every Islington postcode, from 73.3% of stock in N16 up to 95.7% in EC1, with houses a small minority across the borough. The mix is the single most important fact about Islington for a buy-to-let investor: this is a flat market, and the strategies that fit elsewhere do not all apply here. The figures below are drawn from 2021 Census records for each postcode.
| Area | Detached | Semi-detached | Terraced | Flats |
|---|---|---|---|---|
| EC1 (Clerkenwell, Farringdon) | 0.4% | 0.5% | 3.4% | 95.7% |
| N1 (Islington, Barnsbury, Canonbury) | 0.8% | 3.6% | 12.2% | 83.1% |
| N4 (Finsbury Park, Manor House) | 1.4% | 3.0% | 15.2% | 80.2% |
| N5 (Highbury) | 1.4% | 3.8% | 18.9% | 75.9% |
| N7 (Holloway) | 0.9% | 3.6% | 12.8% | 82.5% |
| N16 (Stoke Newington, Stamford Hill) | 1.8% | 4.7% | 20.0% | 73.3% |
| N19 (Archway, Upper Holloway) | 1.0% | 3.9% | 18.1% | 76.9% |
| NW1 (Camden Town, Regent's Park) | 1.8% | 2.7% | 11.1% | 84.1% |
| WC1 (Bloomsbury, Holborn) | 0.6% | 0.8% | 3.9% | 94.6% |
EC1 and WC1 are almost entirely flats, at 95.7% and 94.6%, the dense central postcodes where purpose-built blocks and converted period buildings make up nearly all the stock. These are the single-let and professional-sharer postcodes, with very little for an investor chasing a house.
N16 and N5 hold the most terraced housing, at 20.0% and 18.9%, the Victorian streets of Stoke Newington and Highbury that draw families. Even there, flats remain the clear majority, so a buyer wanting a house in Islington competes in a thin part of the market against owner-occupiers.
Flats combine purpose-built blocks and converted units, and a small share of other dwelling types is left out, so rows may not total 100%.

Islington Rental Market Analysis
Monthly rents in Islington range from £2,296 in N16 to £3,284 in EC1, with gross rental yields from 4.1% to 5.3% across the nine postcodes. For investors weighing whether buy to let is worth it in a low-yield, high-value borough, the sections below break down rents, yields and tenant affordability postcode by postcode. The rental market is the strong half of the Islington story: every postcode reads as a landlord's market, and homes let in well under two months. Browse current buy-to-let property for sale across the capital.
Average Rent & Gross Rental Yields in Islington
Gross rental yields in Islington run from 4.1% in N16 to 5.3% in N7 and N19. The two cheapest postcodes deliver the highest yields, and the dearest deliver the lowest, the same inverse relationship that runs through most of inner London. EC1 charges the highest rent at £3,284 a month but yields 5.2% because its £760,560 asking price is among the steepest in the borough.
| Area | Average Monthly Rent | Asking Price | Gross Yield |
|---|---|---|---|
| N19 (Archway, Upper Holloway) | £2,402 | £546,223 | 5.3% |
| N7 (Holloway) | £2,420 | £545,168 | 5.3% |
| EC1 (Clerkenwell, Farringdon) | £3,284 | £760,560 | 5.2% |
| N1 (Islington, Barnsbury, Canonbury) | £3,055 | £733,679 | 5.0% |
| N4 (Finsbury Park, Manor House) | £2,437 | £613,648 | 4.8% |
| NW1 (Camden Town, Regent's Park) | £3,087 | £813,235 | 4.6% |
| N5 (Highbury) | £2,687 | £749,272 | 4.3% |
| WC1 (Bloomsbury, Holborn) | £3,113 | £864,025 | 4.3% |
| N16 (Stoke Newington, Stamford Hill) | £2,296 | £671,958 | 4.1% |
N7 and N19 share the top yield at 5.3%, pairing the borough's two lowest asking prices with mid-range rents of around £2,400 a month. A 30% deposit in N7 is £163,550, the lowest figure in Islington, for a home letting at £2,420 a month in Holloway.
N16 sits at the bottom of the yield table at 4.1%, where a £671,958 asking price meets the lowest rent in the borough at £2,296. The Stoke Newington stock holds its value as a family-friendly area, but the income return is compressed by a purchase price that the rent does not keep pace with.
Gross Rental Yield by Postcode
Is Islington Rent High?
Islington rents consume between 54.4% and 77.7% of the local median individual salary, far above the 30% affordability benchmark and a clear sign of how the borough's rental market is priced. The widely cited rule of thumb is that rent should take around 30% of gross income. No Islington postcode comes close to that on a single median salary, which tells you who actually rents here.
The median gross weekly salary in Islington is £974.80, which works out at £4,224 per month or £50,692 per year. That is above the London median of £892.60 a week and the Great Britain median of £752.40. Data from the Nomis Labour Market Profile (ASHE 2025).
| Rank | Area | Rent as % of Income |
|---|---|---|
| 1 | EC1 (Clerkenwell, Farringdon) | 77.7% |
| 2 | WC1 (Bloomsbury, Holborn) | 73.7% |
| 3 | NW1 (Camden Town, Regent's Park) | 73.1% |
| 4 | N1 (Islington, Barnsbury, Canonbury) | 72.3% |
| 5 | N5 (Highbury) | 63.6% |
| 6 | N4 (Finsbury Park, Manor House) | 57.7% |
| 7 | N7 (Holloway) | 57.3% |
| 8 | N19 (Archway, Upper Holloway) | 56.9% |
| 9 | N16 (Stoke Newington, Stamford Hill) | 54.4% |
These figures compare a one-bedroom-or-larger market rent against a single resident's median pay, so they read high by design. In practice Islington's renters are mostly couples and sharers pooling two or more incomes, which is how a borough with rents above £2,300 a month sustains the demand it does. N16 at 54.4% is the most affordable on this measure, where the lowest rent in the borough meets the same median salary.
How Big Is Islington's Private Rented Sector?
The private rented sector is deepest in EC1, WC1 and N4, where it accounts for 42.8%, 41.3% and 41.0% of households, and shallowest in N19 at 27.9%. The share of homes already rented privately is a guide to how large and established the local tenant pool is, and across Islington it is consistently high, sitting alongside an unusually large social-rented sector. The table below shows household tenure by postcode.
| Area | Owned Outright | Owned with Mortgage | Private Rented | Social Rented |
|---|---|---|---|---|
| EC1 (Clerkenwell, Farringdon) | 12.8% | 13.2% | 42.8% | 29.3% |
| WC1 (Bloomsbury, Holborn) | 12.1% | 7.3% | 41.3% | 37.9% |
| N4 (Finsbury Park, Manor House) | 11.9% | 17.5% | 41.0% | 27.6% |
| NW1 (Camden Town, Regent's Park) | 18.8% | 13.2% | 36.9% | 30.0% |
| N16 (Stoke Newington, Stamford Hill) | 13.3% | 16.3% | 36.7% | 32.2% |
| N1 (Islington, Barnsbury, Canonbury) | 12.8% | 14.4% | 33.8% | 36.6% |
| N7 (Holloway) | 11.0% | 14.7% | 33.4% | 38.4% |
| N5 (Highbury) | 16.4% | 20.7% | 32.5% | 28.9% |
| N19 (Archway, Upper Holloway) | 14.3% | 18.4% | 27.9% | 37.9% |
EC1 and WC1 have the largest private rented sectors, at 42.8% and 41.3%, the central postcodes where renting is the default tenure for the professionals and students who fill them. A deep rented sector points to a tested, liquid lettings market rather than an untried one.
Across the whole borough, social renting runs from 27.6% in N4 up to 38.4% in N7, far higher than most of the country, with outright ownership rarely above one home in six. Islington is a borough of renters far more than owners, which on the demand side is what keeps the lettings market moving. Rental listings clear fast everywhere: every postcode reads as a landlord's market, with homes typically let in 30 to 60 days.
Local Housing Allowance Rates in Islington
Islington straddles two Broad Rental Market Areas, so its Local Housing Allowance rates are not uniform: the western and northern postcodes fall in Inner North London, while N4 and N16 sit in the slightly lower Inner East London area. Local Housing Allowance is the most a tenant on housing support can claim towards rent, so for that part of the market it sets an effective floor. Because the borough crosses two areas, the rate depends on the postcode. To check the figure for a specific address, use the government's official Local Housing Allowance calculator.
| Property Size | Inner North London (weekly) | Inner East London (weekly) |
|---|---|---|
| Shared accommodation | £163.00 | £160.98 |
| 1 bedroom | £331.39 | £331.39 |
| 2 bedrooms | £412.86 | £402.74 |
| 3 bedrooms | £497.10 | £497.10 |
| 4 bedrooms | £704.22 | £690.41 |
The Inner North London two-bedroom rate of £412.86 a week works out at about £1,789 a month, and the Inner East London rate of £402.74 at about £1,745, both well below Islington's open-market rents of £2,296 to £3,284. A benefit-backed tenancy at the LHA rate therefore sits comfortably under the borough's market rents, with the gap widest in the central postcodes. These figures cover seven of the nine postcodes; EC1 and WC1 fall in central rate areas not shown here, so the VOA calculator is the place to check those. The rates above are the June 2026 figures and are reset each April.
Buy-to-Let Considerations
Are House Prices High in Islington? Price-to-Earnings Ratios
Buying in Islington takes between 10.8 and 17.0 times the local median salary, with every postcode well above the national benchmark. This is based on the Nomis Labour Market Profile for Islington, which puts the median gross annual income for residents at £50,692.
The national benchmark for price-to-earnings is 7.4x (England's average sold price of £289,946 divided by the Great Britain median annual salary of £39,125). No Islington postcode comes close to that, which puts the whole borough firmly in expensive territory relative to local incomes, even before the deposit and purchase costs are added.
| Rank | Area | Price-to-Earnings Ratio |
|---|---|---|
| 1 | N7 (Holloway) | 10.8x |
| 2 | N19 (Archway, Upper Holloway) | 10.8x |
| 3 | N4 (Finsbury Park, Manor House) | 12.1x |
| 4 | N16 (Stoke Newington, Stamford Hill) | 13.3x |
| 5 | N1 (Islington, Barnsbury, Canonbury) | 14.5x |
| 6 | N5 (Highbury) | 14.8x |
| 7 | EC1 (Clerkenwell, Farringdon) | 15.0x |
| 8 | NW1 (Camden Town, Regent's Park) | 16.0x |
| 9 | WC1 (Bloomsbury, Holborn) | 17.0x |
N7 and N19 are the most affordable on this measure at 10.8x, which is still well above the national 7.4x. Even the cheapest way into Holloway and Archway takes more than ten years of the local median salary, a reminder that Islington buyers are rarely relying on a single local wage.
WC1 at 17.0x is the least affordable in the borough. At seventeen times the local median salary, the small central flats of Bloomsbury and Holborn are bought largely by higher earners, dual-income households and investors rather than typical local residents, which is consistent with their lower yields and slower sales.
Deposit Requirements in Islington
A 30% deposit on a buy-to-let in Islington ranges from £163,550 in N7 to £259,207 in WC1. The £95,657 gap between the cheapest and dearest deposit is itself larger than the full purchase price of a home in many parts of the country. For investors comparing Islington with the rest of London, these deposits sit above the outer-London boroughs but below the prime western neighbours of Camden and Westminster.
Beyond the deposit, the stamp duty calculation and other buy to let costs add materially to the capital required, particularly at Islington's price points where the surcharge on additional property runs into six figures.
| Rank | Area | 30% Deposit Required |
|---|---|---|
| 1 | N7 (Holloway) | £163,550 |
| 2 | N19 (Archway, Upper Holloway) | £163,867 |
| 3 | N4 (Finsbury Park, Manor House) | £184,094 |
| 4 | N16 (Stoke Newington, Stamford Hill) | £201,587 |
| 5 | N1 (Islington, Barnsbury, Canonbury) | £220,104 |
| 6 | N5 (Highbury) | £224,782 |
| 7 | EC1 (Clerkenwell, Farringdon) | £228,168 |
| 8 | NW1 (Camden Town, Regent's Park) | £243,970 |
| 9 | WC1 (Bloomsbury, Holborn) | £259,207 |
N7 keeps the entry cost down at a £163,550 deposit, and N19 is within a few hundred pounds of it. The two Holloway and Archway postcodes are the practical starting point for an investor working to a budget, pairing the lowest deposits with the joint-highest yields in the borough at 5.3%.
At the top, WC1 needs a £259,207 deposit, around £95,000 more than N7, for a postcode that earns less per pound through the rent and takes far longer to sell. The deposit gap buys a central Bloomsbury address rather than a stronger investment return.

What the Islington Data Tells Buy-to-Let Investors
In Islington the cheapest postcodes are also the highest-yielding. N7 (Holloway) and N19 (Archway) carry the top yield at 5.3%. They are also the two cheapest ways in, at £545,168 and £546,223 for an investment property in Islington, and the most affordable against local earnings at 10.8 times income. A 30% deposit in N7 is £163,550, the lowest in the borough, for a home renting at £2,420 a month.
The flat-dominated stock is the defining feature. Flats make up between 73.3% and 95.7% of homes across the nine postcodes, and the borough's all-property sold average of £679,463 sits close to the flat figure of £564,501 rather than the far higher house prices. For most investors here the decision is which flat, in which postcode, rather than which property type.
The rental and sales markets pull in opposite directions. Every postcode is a landlord's market on the letting side, with homes let in 30 to 60 days, while the sales side is slow and, in the central postcodes, a clear buyer's market, with EC1, NW1 and WC1 carrying more than 30 months of unsold stock. That combination favours buyers who want to negotiate on the way in and hold for income, and it is harder on anyone needing a quick exit. For buyers looking to come in below asking, below market value and off-market property channels tend to carry the keenest prices in a slow market like this.
Set against the rest of inner London, Islington reads as a prime, low-yield, high-deposit borough that has eased back from its 2024 high. The yields are lower than the higher-yielding outer boroughs, but the tenant demand underneath them is among the deepest and most tested in the country.
How Islington Compares
Islington's mean asking price of £699,752 places it mid-table among its inner-North-London neighbours, dearer than Hackney and Haringey but well below Camden, while its top yield of 5.3% is the second-lowest of the five. The comparison below sets Islington alongside four nearby boroughs, each with a different balance of price and income return. Mean asking price and mean monthly rent are simple averages across all postcodes with data, and top gross yield is the single highest postcode yield in each borough.
| Location | Mean Asking Price | Mean Monthly Rent | Mean Gross Yield | Top Yield (postcode) |
|---|---|---|---|---|
| Newham | £437,735 | £2,189 | 6.0% | 6.8% (IG11) |
| Haringey | £608,827 | £2,145 | 4.2% | 6.1% (N17) |
| Hackney | £653,333 | £2,617 | 4.8% | 5.7% (E1) |
| Islington | £699,752 | £2,753 | 4.7% | 5.3% (EC1, N19) |
| Camden | £1,020,119 | £3,414 | 4.0% | 5.2% (EC1) |
Islington is the second most expensive borough in this group at £699,752, behind only Camden, and its 5.3% top yield sits just above Camden's 5.2% at the lower end of the table. Both Islington and Camden represent the prime inner-London trade-off: high prices, deep tenant demand and yields that the purchase price holds down.
For investors prioritising income, Newham at 6.8% and Haringey at 6.1% deliver materially higher top-line yields at lower asking prices. Hackney at 5.7% sits between the two, slightly cheaper than Islington with a marginally higher yield. For investors who want a prime, central north-London address with the tenant depth that comes with it, Islington and Camden compete for the same capital. For a data-driven comparison across the whole country, see our best buy-to-let areas guide.
Frequently Asked Questions
Is Islington a good place to invest in buy-to-let?
It comes down to what you want from the money. Islington gives you some of the deepest, most tested tenant demand in the country: every postcode lets fast, the private rented sector runs to over 40% of homes in places, and resident earnings are well above the London average. What it does not give you is a high yield. Gross yields top out at 5.3%, and prices have eased back from their 2024 high, so this is an income-and-hold borough rather than a quick-growth one.
It also suits a particular kind of investor: one with the deposit for a £550,000-plus flat and the patience to hold through a slow sales market. If you need a fast exit or a yield north of 6%, the higher-yielding outer boroughs are a closer fit.
What are the best areas in Islington for property investment?
It depends on the goal, and the borough splits fairly cleanly. For yield, N7 (Holloway) and N19 (Archway) lead at 5.3%, with the two lowest asking prices at around £545,000 and the cheapest deposits at about £163,550. For a more established, liquid market, N1 around Angel and Barnsbury is the busiest in the borough at 48 sales a month, though the yield drops to 5.0%.
At the top end, EC1 (Clerkenwell) and WC1 (Bloomsbury) are the dearest per square foot and the slowest to sell, central small-flat postcodes that suit investors prioritising location over income or exit speed. So income points north to Holloway and Archway; central convenience points south to Clerkenwell.
What are average house prices in Islington?
The average sold price across Islington is £679,463 on the Land Registry index, about 134.3% above the England average of £289,946 as of March 2026. Asking prices by postcode run from £545,168 in N7 (Holloway) up to £864,025 in WC1 (Bloomsbury, Holborn), with a borough-wide mean of £699,752. By type, the index puts flats at £564,501, terraced houses at £1,156,081, semi-detached at £1,421,353 and detached at £1,687,234, though houses of any kind are scarce here.
Through a buy-to-let lens, N7 and N19 are the cheapest entry and the highest-yielding at 5.3%, while WC1 is the dearest and among the lowest-yielding.
What type of property is most common in Islington?
Flats, by a wide margin, and in every postcode. They run from 73.3% of the stock in N16 (Stoke Newington) up to 95.7% in EC1 (Clerkenwell). Houses are a small minority everywhere: terraced homes are most common in N16 and N5 at around one in five, while detached houses are almost non-existent across the borough at well under 2% of stock. For a buy-to-let investor, Islington is a flat market first and foremost.
Why have Islington house prices fallen recently?
Islington reached an all-time high of £751,356 in May 2024 and has since eased to £679,463 by March 2026, around 9.6% below that peak. The pull-back is sharpest in the central small-flat postcodes: WC1 is down 31.9% over five years and EC1 down 20.1%, both heavily exposed to investor and overseas demand that thinned after interest rates rose. Other postcodes have held up better, with N19 still up 9.1% over five years.
The longer view matters too. The borough is broadly flat over ten years and up 633.9% over thirty, so the recent dip follows a decade of little movement rather than a sharp reversal of strong growth.
Is there demand for student and shared accommodation in Islington?
Yes, and it is one of the borough's stronger rental currents. City, University of London sits in Clerkenwell in EC1, London Metropolitan University runs its main campus on Holloway Road in N7, and central London's other institutions are a short commute away, which keeps a steady flow of students and graduate sharers moving through the market. That demand sits behind the consistently fast letting times across the borough.
On the shared-house side, a sample of current room adverts puts a double room with a shared bathroom at roughly £212 to £282 a week depending on the postcode, with the higher figures in the central EC1 and N1 areas. For how the numbers work on a shared house, see our complete guide to investing in HMOs, and for the purpose-built end of the market, our guide to student accommodation for sale.
How does Islington compare to Hackney for buy-to-let?
They are close neighbours with a similar profile, and Hackney comes in slightly cheaper and slightly higher-yielding. Hackney's mean asking price is £653,333 against Islington's £699,752, and its top yield is 5.7% against Islington's 5.3%. Both are flat-dominated inner-London boroughs with deep rental demand and a long record of capital growth.
Islington edges it on central convenience and the prime addresses around Angel and Canonbury, while Hackney offers a little more yield and a marginally lower asking price. The choice between them tends to come down to which areas and price points fit the budget rather than a clear gap in the numbers.
What are the Local Housing Allowance rates in Islington?
Islington crosses two Broad Rental Market Areas, so the rate depends on the postcode. Most of the borough falls in Inner North London, where the June 2026 rates run from £163.00 a week for a shared room to £704.22 for a four-bed, with a two-bed at £412.86. N4 and N16 sit in the slightly lower Inner East London area, where the two-bed rate is £402.74 a week. Those figures are the most a tenant on housing support can claim, so for that part of the market they set a rent floor, and they sit well below Islington's open-market rents in every postcode.
How do I buy an investment property in Islington?
Start by deciding whether you are buying for income or for a central address, because the two point to different postcodes. For yield, N7 (Holloway) and N19 (Archway) are the cheapest entry at around £545,000 and the highest-yielding at 5.3%. For prime location, the southern postcodes around Clerkenwell and Bloomsbury cost more and yield less. Budget for a 30% deposit, which runs from £163,550 in N7 to £259,207 in WC1.
Because the sales market is slow here, especially in the central postcodes, there is often room to negotiate. Plenty of experienced investors buy below asking through off market properties and BMV property. To see what is available now, browse investment properties or buy-to-let homes for sale.
Ready to buy property?
Access off-market investment properties with an average 8%+ annual gross yield (beating the UK's typical 3-5%).
Get property alerts