
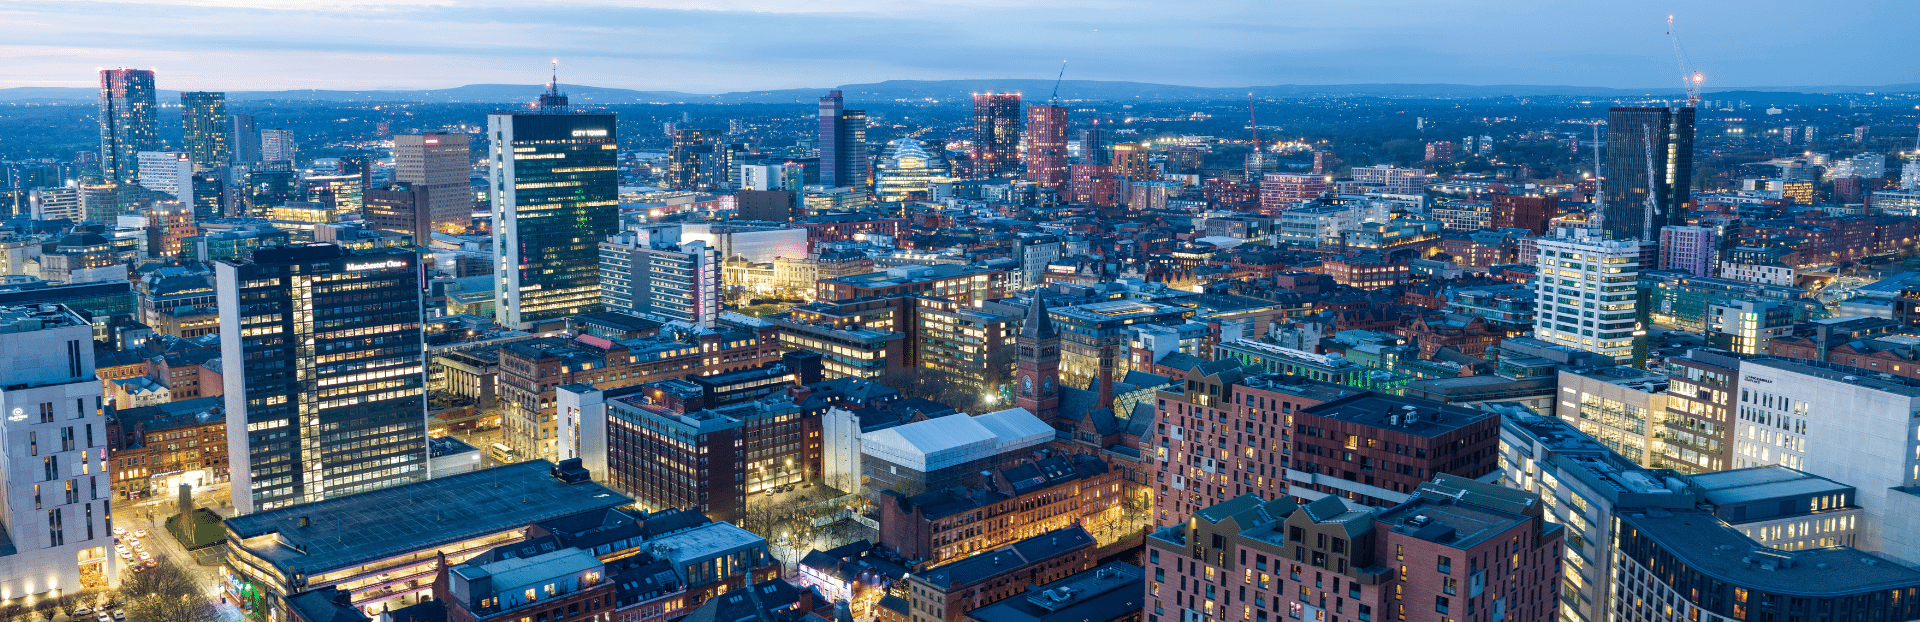
Manchester is a city and metropolitan borough in Greater Manchester, in north-west England. Homes across the Manchester council area sold for an average of £254,604 on the HM Land Registry House Price Index, 15.5% above the North West's £220,477 and 13.1% below England's £292,998. Inside that average are very different markets. In the city centre, where nearly every home sold was a flat, M1, M4 and M15 had lower prices than five years earlier, though M3, which is mostly in Salford, rose. The cheaper house postcodes of the north and east had the biggest rises.
Average asking prices across the 22 postcodes in this guide ran from £209,698 in M11 (Openshaw, Clayton) to £401,785 in M21 (Chorlton). The 11.1% top yield is M14 (Fallowfield, Rusholme), a student area. It sets the postcode's average advertised rent against the average asking price of every kind of home there, and that rent likely includes whole shared houses, where one rent covers every room. So it does not show what letting one ordinary home there would return. The next-highest postcode is M4 (Ancoats, Northern Quarter), at 7.3%.
The sold-price, earnings, jobs and population figures are for the Manchester City Council area. The postcode tables cover 22 postcode districts, and those do not follow the council boundary. M5, M6 and M50 are in Salford. M3 is shared, with about 27% of its households in Manchester and the rest in Salford. M16 is split almost evenly between Manchester and Trafford, and M15 reaches a little way into Trafford. The other districts are inside the city, or very nearly so.
Article updated: November 2026
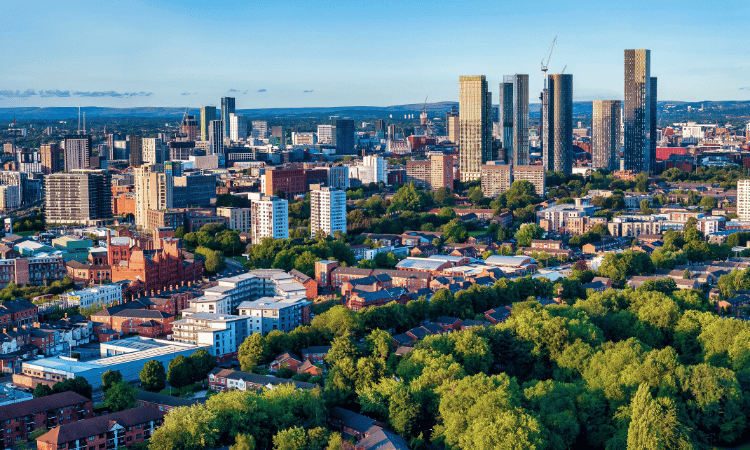
Why Invest in Manchester?
Manchester's population grew 9.7% between the 2011 and 2021 censuses, from 503,127 to 551,938. England's grew 6.6% over the same ten years, according to the ONS census figures. The University of Manchester and Manchester Metropolitan University each report more than 44,000 students. Purpose-built student blocks are a separate market from the houses and flats in this guide's tables, and our guide to student property investment covers them.
The biggest sectors for jobs in 2024 were professional, scientific and technical work, with 13.2% of employee jobs, and health and social work, with 11.7%. Administrative and support services (11.5%) and wholesale and retail (10.8%) came next, according to the Nomis labour market profile. Between July 2025 and June 2026, 75.7% of residents aged 16 to 64 were in work. That was a little above the North West's 74.3% and close to Great Britain's 75.6%. Unemployment was 4.1%, against 4.3% across the region.
Pay was lower. The median full-time salary for Manchester residents in 2025 was £36,278, against £37,445 across the North West and £39,126 for Great Britain.
Manchester Economic Summary
- Population: 551,938 (2021 Census). Growth of 9.7% from 2011.
- Median annual salary: £36,278 (local), £37,445 (North West), £39,126 (Great Britain)
- Employment rate: 75.7% (local), 74.3% (North West), 75.6% (Great Britain)
- Unemployment rate: 4.1% (local), 4.3% (North West), 4.5% (Great Britain)
- Key employment sectors: Professional, scientific and technical; human health and social work; administrative and support services; wholesale and retail
Source: ONS Census 2021, Nomis Labour Market Profile (ASHE 2025, Employment Jul 2025-Jun 2026)
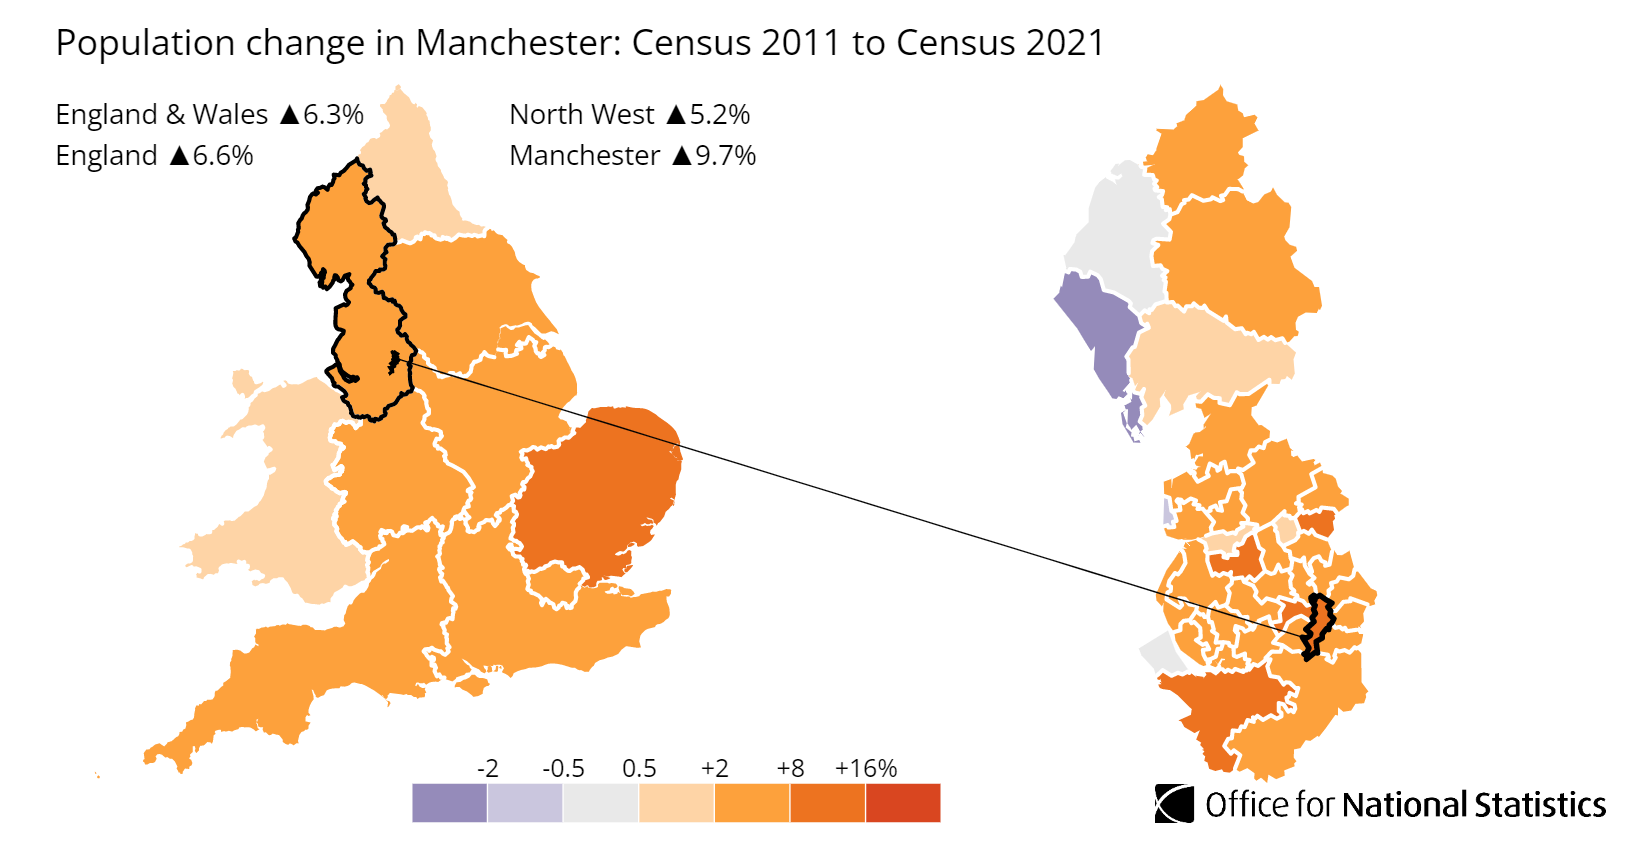
Source: Office for National Statistics - Population for Manchester
Regeneration and Investment in Manchester
The biggest scheme in the city is Victoria North, with 15,000 homes planned north-east of the city centre over the next two decades. Two other large projects sit just outside Manchester or run into it. One is the Old Trafford regeneration in Trafford, and the other a planned rail line from Liverpool.
- Victoria North (a joint venture between Manchester City Council and Far East Consortium): The council calls it the biggest regeneration project in Manchester's history, with 15,000 homes in seven new neighbourhoods, mostly on brownfield land. The first areas are Red Bank and Collyhurst. In March 2026 the Greater Manchester Combined Authority announced £60m for a Metrolink stop at Sandhills. The same month the government named Victoria North among seven proposed new towns, with final locations due after a consultation. Updates at Manchester City Council.
- Old Trafford Regeneration (development corporation set up in January 2026): A 370-acre area in Trafford, next to the city, around a new 100,000-seat stadium for Manchester United. It is planned to bring 15,000 homes and 48,000 jobs locally. It is expected to add over £7 billion a year to the UK economy. Updates at Trafford Council.
- Northern Powerhouse Rail (£45 billion funding cap set in January 2026): The government has capped the programme at £45 billion, with £1.1 billion for its first stage over the current Spending Review. A Liverpool to Manchester line, via Warrington and Manchester Airport, is planned as the programme's second phase. That phase includes three new stations, at Manchester Airport, Manchester Piccadilly and Warrington Bank Quay Low Level, with delivery starting in the 2030s. Updates at GOV.UK.
Manchester Property Market Analysis
The average price of a home in Manchester rose from £33,806 in January 1995 to £254,604 in September 2026, an increase of 653.1%. Over the last five years the postcodes split apart. Prices rose most in the house postcodes of the north and east, led by M18 (Gorton, Abbey Hey) at 45.4%, and fell most in M15 (Hulme, Castlefield), a flat postcode, down 32.2%.
When Was the Last House Price Crash in Manchester?
Manchester's last house price crash ran from August 2007 to March 2009. Over those 19 months the average price fell 20.5%, from £134,540 to £106,994. These are HM Land Registry's monthly figures for the Manchester council area, from January 1995 to September 2026.
The 1995 to 2007 boom: The average started at £33,806 in January 1995 and reached £73,720 by December 2003. It peaked at £134,540 in August 2007, close to four times where it began.
2008 to 2009, the financial crisis: Manchester's 20.5% fall from peak to low was deeper than England's 18.2% and the UK's 18.7%, both measured from September 2007 to March 2009. The North West fell 18.3%, but over a longer slide, from December 2007 to January 2013. Manchester's worst year-on-year reading was -18.1%, in February 2009. Terraced houses lost 21.6% between August 2007 and March 2009, and detached houses 19.0%.
The 2010 to 2013 flat years: Prices barely moved for four years, staying between £110,621 (December 2011) and £119,793 (November 2013).
Recovery, 2014 to 2016: From £128,746 in December 2014, the average passed the 2007 peak in August 2015, at £135,437. That was eight years after the peak. By December 2016 it was £149,725.
2017 to 2019: The average rose from £165,474 in December 2017 to £177,994 in December 2019.
2020 to 2022: The rise then sped up, from £175,233 in January 2020 to £234,545 in June 2022, up 33.8%.
2023: The average dipped to £222,199 in May 2023, 4.5% lower than a year earlier, and was back to £243,626 by September 2023.
2024 to 2026: The average reached £255,632 in July 2024 and an all-time high of £267,045 in January 2026. By September 2026 it was £254,604, 4.7% below that high and 1.4% up on a year earlier.
Long-term growth summary:
- 5 years (September 2021 to September 2026): 23.4% growth (£206,360 to £254,604)
- 10 years (September 2016 to September 2026): 70.9% growth (£148,982 to £254,604)
- 15 years (September 2011 to September 2026): 115.3% growth (£118,237 to £254,604)
- 20 years (September 2006 to September 2026): 107.9% growth (£122,485 to £254,604)
- 31 years (January 1995 to September 2026): 653.1% growth (£33,806 to £254,604)
The 20-year figure is lower than the 15-year one because September 2006 was near the top of the boom, while September 2011 was in the flat years after the crash. In September 2026 the average was 89.2% above the August 2007 peak. Source: HM Land Registry House Price Index for Manchester.
- All property types
- Detached
- Semi-detached
- Terraced
- Flats
Source: HM Land Registry House Price Index
| Year | All property types | Detached | Semi-detached | Terraced | Flats |
|---|---|---|---|---|---|
| 1995-01 | £33,806 | £63,223 | £40,075 | £30,748 | £31,418 |
| 1995-02 | £33,434 | £62,027 | £39,774 | £30,358 | £31,075 |
| 1995-03 | £33,329 | £61,569 | £39,616 | £30,295 | £30,964 |
| 1995-04 | £33,057 | £60,753 | £39,306 | £30,039 | £30,785 |
| 1995-05 | £33,101 | £60,767 | £39,291 | £30,107 | £30,865 |
| 1995-06 | £33,301 | £61,216 | £39,569 | £30,224 | £31,250 |
| 1995-07 | £33,483 | £61,798 | £39,824 | £30,388 | £31,283 |
| 1995-08 | £33,524 | £62,266 | £39,913 | £30,411 | £31,206 |
| 1995-09 | £32,768 | £61,020 | £38,993 | £29,777 | £30,270 |
| 1995-10 | £31,522 | £58,845 | £37,598 | £28,559 | £29,292 |
| 1995-11 | £30,774 | £57,389 | £36,758 | £27,806 | £28,843 |
| 1995-12 | £30,948 | £57,679 | £37,055 | £27,882 | £29,184 |
| 1996-01 | £31,487 | £58,750 | £37,681 | £28,382 | £29,654 |
| 1996-02 | £31,320 | £58,398 | £37,496 | £28,227 | £29,476 |
| 1996-03 | £30,834 | £57,712 | £36,970 | £27,741 | £29,043 |
| 1996-04 | £30,681 | £57,173 | £36,727 | £27,621 | £28,992 |
| 1996-05 | £31,471 | £58,550 | £37,587 | £28,429 | £29,561 |
| 1996-06 | £32,449 | £60,157 | £38,640 | £29,367 | £30,531 |
| 1996-07 | £33,398 | £62,111 | £39,841 | £30,235 | £31,218 |
| 1996-08 | £33,524 | £62,693 | £40,070 | £30,316 | £31,251 |
| 1996-09 | £33,330 | £62,680 | £39,872 | £30,172 | £30,823 |
| 1996-10 | £32,801 | £61,878 | £39,283 | £29,678 | £30,273 |
| 1996-11 | £32,207 | £60,623 | £38,562 | £29,119 | £29,841 |
| 1996-12 | £32,566 | £61,111 | £39,060 | £29,431 | £30,123 |
| 1997-01 | £32,671 | £61,213 | £39,196 | £29,546 | £30,137 |
| 1997-02 | £33,153 | £62,386 | £39,782 | £29,963 | £30,619 |
| 1997-03 | £32,868 | £62,037 | £39,378 | £29,725 | £30,387 |
| 1997-04 | £32,792 | £61,763 | £39,250 | £29,673 | £30,350 |
| 1997-05 | £33,163 | £62,202 | £39,758 | £30,065 | £30,357 |
| 1997-06 | £33,399 | £62,711 | £40,110 | £30,314 | £30,271 |
| 1997-07 | £34,272 | £64,434 | £41,183 | £31,138 | £30,858 |
| 1997-08 | £34,433 | £65,010 | £41,407 | £31,266 | £30,969 |
| 1997-09 | £34,962 | £65,921 | £42,073 | £31,728 | £31,466 |
| 1997-10 | £34,744 | £65,703 | £41,884 | £31,477 | £31,300 |
| 1997-11 | £34,533 | £65,407 | £41,671 | £31,260 | £31,113 |
| 1997-12 | £33,600 | £63,818 | £40,602 | £30,355 | £30,368 |
| 1998-01 | £34,145 | £65,042 | £41,206 | £30,861 | £30,890 |
| 1998-02 | £34,418 | £65,386 | £41,475 | £31,072 | £31,378 |
| 1998-03 | £35,023 | £66,386 | £42,153 | £31,623 | £32,022 |
| 1998-04 | £35,729 | £67,412 | £43,066 | £32,234 | £32,703 |
| 1998-05 | £36,734 | £69,187 | £44,248 | £33,227 | £33,434 |
| 1998-06 | £37,762 | £71,221 | £45,453 | £34,153 | £34,421 |
| 1998-07 | £38,579 | £72,924 | £46,442 | £34,914 | £35,059 |
| 1998-08 | £39,472 | £75,005 | £47,533 | £35,694 | £35,856 |
| 1998-09 | £39,401 | £75,037 | £47,514 | £35,652 | £35,578 |
| 1998-10 | £38,911 | £74,232 | £46,897 | £35,153 | £35,318 |
| 1998-11 | £37,654 | £71,985 | £45,473 | £33,875 | £34,423 |
| 1998-12 | £38,541 | £73,465 | £46,542 | £34,589 | £35,533 |
| 1999-01 | £38,014 | £72,373 | £45,929 | £34,092 | £35,098 |
| 1999-02 | £37,446 | £71,116 | £45,216 | £33,610 | £34,543 |
| 1999-03 | £36,046 | £68,541 | £43,500 | £32,335 | £33,299 |
| 1999-04 | £36,382 | £68,825 | £43,850 | £32,715 | £33,565 |
| 1999-05 | £37,160 | £70,058 | £44,710 | £33,457 | £34,335 |
| 1999-06 | £37,700 | £71,049 | £45,346 | £34,009 | £34,702 |
| 1999-07 | £38,551 | £73,016 | £46,361 | £34,791 | £35,416 |
| 1999-08 | £39,545 | £75,036 | £47,558 | £35,753 | £36,154 |
| 1999-09 | £40,645 | £77,309 | £48,807 | £36,754 | £37,222 |
| 1999-10 | £39,722 | £75,671 | £47,752 | £35,767 | £36,631 |
| 1999-11 | £38,680 | £73,682 | £46,517 | £34,777 | £35,767 |
| 1999-12 | £38,081 | £72,266 | £45,789 | £34,181 | £35,400 |
| 2000-01 | £38,076 | £72,363 | £45,803 | £34,209 | £35,274 |
| 2000-02 | £38,701 | £73,785 | £46,552 | £34,726 | £35,913 |
| 2000-03 | £38,431 | £73,515 | £46,333 | £34,477 | £35,465 |
| 2000-04 | £39,179 | £74,600 | £47,122 | £35,151 | £36,336 |
| 2000-05 | £39,879 | £75,614 | £47,977 | £35,760 | £37,051 |
| 2000-06 | £41,071 | £77,685 | £49,406 | £36,783 | £38,296 |
| 2000-07 | £41,754 | £79,510 | £50,385 | £37,332 | £38,806 |
| 2000-08 | £42,407 | £81,121 | £51,250 | £37,747 | £39,657 |
| 2000-09 | £42,979 | £82,814 | £51,900 | £38,185 | £40,342 |
| 2000-10 | £42,797 | £82,539 | £51,761 | £37,898 | £40,344 |
| 2000-11 | £42,010 | £81,298 | £50,753 | £37,169 | £39,716 |
| 2000-12 | £42,347 | £81,751 | £51,172 | £37,329 | £40,371 |
| 2001-01 | £41,915 | £80,770 | £50,470 | £36,968 | £40,163 |
| 2001-02 | £42,933 | £82,305 | £51,662 | £37,905 | £41,136 |
| 2001-03 | £42,227 | £80,910 | £50,830 | £37,344 | £40,288 |
| 2001-04 | £43,461 | £83,145 | £52,206 | £38,476 | £41,520 |
| 2001-05 | £44,145 | £84,242 | £52,977 | £39,118 | £42,177 |
| 2001-06 | £44,877 | £85,316 | £53,756 | £39,775 | £43,012 |
| 2001-07 | £46,051 | £87,654 | £55,295 | £40,822 | £43,951 |
| 2001-08 | £47,096 | £89,940 | £56,489 | £41,729 | £45,035 |
| 2001-09 | £48,567 | £93,083 | £58,132 | £43,028 | £46,574 |
| 2001-10 | £48,405 | £92,824 | £57,907 | £42,807 | £46,635 |
| 2001-11 | £47,723 | £91,622 | £57,201 | £42,093 | £46,084 |
| 2001-12 | £47,106 | £90,079 | £56,538 | £41,402 | £45,775 |
| 2002-01 | £46,796 | £89,430 | £56,115 | £41,063 | £45,697 |
| 2002-02 | £46,883 | £89,484 | £56,073 | £41,160 | £45,934 |
| 2002-03 | £47,354 | £90,324 | £56,643 | £41,630 | £46,256 |
| 2002-04 | £49,344 | £93,681 | £58,910 | £43,393 | £48,358 |
| 2002-05 | £50,714 | £95,841 | £60,602 | £44,589 | £49,692 |
| 2002-06 | £52,664 | £99,361 | £62,778 | £46,350 | £51,709 |
| 2002-07 | £53,809 | £101,731 | £64,197 | £47,462 | £52,503 |
| 2002-08 | £56,061 | £106,053 | £66,864 | £49,464 | £54,679 |
| 2002-09 | £56,058 | £106,422 | £67,057 | £49,471 | £54,359 |
| 2002-10 | £56,434 | £107,193 | £67,696 | £49,677 | £54,772 |
| 2002-11 | £56,972 | £108,661 | £68,335 | £50,164 | £55,226 |
| 2002-12 | £57,654 | £109,503 | £69,189 | £50,685 | £56,079 |
| 2003-01 | £57,735 | £109,465 | £69,074 | £50,898 | £56,113 |
| 2003-02 | £56,858 | £107,093 | £68,034 | £50,111 | £55,354 |
| 2003-03 | £57,140 | £107,759 | £68,271 | £50,474 | £55,474 |
| 2003-04 | £56,905 | £106,996 | £68,187 | £50,175 | £55,236 |
| 2003-05 | £59,133 | £111,410 | £71,055 | £52,210 | £56,962 |
| 2003-06 | £61,372 | £115,077 | £73,653 | £54,115 | £59,462 |
| 2003-07 | £65,936 | £123,097 | £79,098 | £58,226 | £63,779 |
| 2003-08 | £67,638 | £125,584 | £81,037 | £59,826 | £65,398 |
| 2003-09 | £69,558 | £129,212 | £83,544 | £61,747 | £66,465 |
| 2003-10 | £69,789 | £129,583 | £83,726 | £62,043 | £66,602 |
| 2003-11 | £70,984 | £131,770 | £85,160 | £63,103 | £67,750 |
| 2003-12 | £73,720 | £135,495 | £88,172 | £65,617 | £70,656 |
| 2004-01 | £75,410 | £138,561 | £90,175 | £67,241 | £72,031 |
| 2004-02 | £74,446 | £136,160 | £88,866 | £66,477 | £71,031 |
| 2004-03 | £73,876 | £135,357 | £87,973 | £65,987 | £70,383 |
| 2004-04 | £75,362 | £136,202 | £89,589 | £67,587 | £71,617 |
| 2004-05 | £79,103 | £141,259 | £93,639 | £71,300 | £75,008 |
| 2004-06 | £82,790 | £146,461 | £97,900 | £74,786 | £78,420 |
| 2004-07 | £87,024 | £153,695 | £103,202 | £78,873 | £81,897 |
| 2004-08 | £89,888 | £159,037 | £106,815 | £81,597 | £84,259 |
| 2004-09 | £92,203 | £163,633 | £109,815 | £84,004 | £85,803 |
| 2004-10 | £91,369 | £162,171 | £108,387 | £83,103 | £85,492 |
| 2004-11 | £91,369 | £161,706 | £108,152 | £83,108 | £85,657 |
| 2004-12 | £90,960 | £159,923 | £107,329 | £82,689 | £85,620 |
| 2005-01 | £89,174 | £156,493 | £104,853 | £81,043 | £84,220 |
| 2005-02 | £89,248 | £156,464 | £104,996 | £81,002 | £84,438 |
| 2005-03 | £90,030 | £158,047 | £105,968 | £81,665 | £85,218 |
| 2005-04 | £92,925 | £162,530 | £109,576 | £84,479 | £87,673 |
| 2005-05 | £96,630 | £169,124 | £113,814 | £88,071 | £90,985 |
| 2005-06 | £100,426 | £174,279 | £118,000 | £91,946 | £94,324 |
| 2005-07 | £104,679 | £181,605 | £123,256 | £96,083 | £97,922 |
| 2005-08 | £107,078 | £185,808 | £126,090 | £98,600 | £99,819 |
| 2005-09 | £107,109 | £186,700 | £126,447 | £98,841 | £99,414 |
| 2005-10 | £107,810 | £187,818 | £126,890 | £99,596 | £100,150 |
| 2005-11 | £107,868 | £187,534 | £127,017 | £99,725 | £100,110 |
| 2005-12 | £109,443 | £189,084 | £128,309 | £101,142 | £101,962 |
| 2006-01 | £110,187 | £190,378 | £129,043 | £101,966 | £102,579 |
| 2006-02 | £111,733 | £192,234 | £130,379 | £103,328 | £104,345 |
| 2006-03 | £111,677 | £193,461 | £130,780 | £103,442 | £103,830 |
| 2006-04 | £112,873 | £194,973 | £132,210 | £104,679 | £104,834 |
| 2006-05 | £114,025 | £197,057 | £133,830 | £105,896 | £105,628 |
| 2006-06 | £116,518 | £200,195 | £136,735 | £108,424 | £107,806 |
| 2006-07 | £118,269 | £203,067 | £138,936 | £110,444 | £109,009 |
| 2006-08 | £119,444 | £205,150 | £140,560 | £111,973 | £109,581 |
| 2006-09 | £122,485 | £211,066 | £144,257 | £114,833 | £112,275 |
| 2006-10 | £123,399 | £212,984 | £145,358 | £115,573 | £113,191 |
| 2006-11 | £125,094 | £216,105 | £147,482 | £117,197 | £114,645 |
| 2006-12 | £124,477 | £214,228 | £146,584 | £116,899 | £113,945 |
| 2007-01 | £124,329 | £213,868 | £146,484 | £116,938 | £113,618 |
| 2007-02 | £126,470 | £217,195 | £148,757 | £118,728 | £115,928 |
| 2007-03 | £124,224 | £213,773 | £146,283 | £116,773 | £113,624 |
| 2007-04 | £126,085 | £216,254 | £148,285 | £118,780 | £115,208 |
| 2007-05 | £125,439 | £214,212 | £147,232 | £118,477 | £114,507 |
| 2007-06 | £130,182 | £221,953 | £152,644 | £123,094 | £118,799 |
| 2007-07 | £132,825 | £226,782 | £155,733 | £125,548 | £121,244 |
| 2007-08 | £134,540 | £230,988 | £158,234 | £127,589 | £122,130 |
| 2007-09 | £134,037 | £230,713 | £157,884 | £127,121 | £121,525 |
| 2007-10 | £131,310 | £226,599 | £154,522 | £124,477 | £119,152 |
| 2007-11 | £130,522 | £225,714 | £153,664 | £123,444 | £118,650 |
| 2007-12 | £132,223 | £228,652 | £155,449 | £124,921 | £120,418 |
| 2008-01 | £133,301 | £230,848 | £156,742 | £125,961 | £121,355 |
| 2008-02 | £132,634 | £230,030 | £155,777 | £125,262 | £120,882 |
| 2008-03 | £128,644 | £224,365 | £151,428 | £121,467 | £117,035 |
| 2008-04 | £127,631 | £223,363 | £150,375 | £120,677 | £115,833 |
| 2008-05 | £126,959 | £221,381 | £149,627 | £120,092 | £115,183 |
| 2008-06 | £128,039 | £221,847 | £150,717 | £121,196 | £116,231 |
| 2008-07 | £127,600 | £220,054 | £150,589 | £120,542 | £115,929 |
| 2008-08 | £126,234 | £217,493 | £149,108 | £119,375 | £114,499 |
| 2008-09 | £122,968 | £213,471 | £145,197 | £116,113 | £111,676 |
| 2008-10 | £120,255 | £209,198 | £141,793 | £113,363 | £109,497 |
| 2008-11 | £118,261 | £206,268 | £139,519 | £111,217 | £107,896 |
| 2008-12 | £115,522 | £200,893 | £136,629 | £108,902 | £104,978 |
| 2009-01 | £111,660 | £195,148 | £132,081 | £105,206 | £101,475 |
| 2009-02 | £108,673 | £190,058 | £128,393 | £102,111 | £99,155 |
| 2009-03 | £106,994 | £187,049 | £126,010 | £100,000 | £98,434 |
| 2009-04 | £107,687 | £186,989 | £126,858 | £100,510 | £99,284 |
| 2009-05 | £108,648 | £188,332 | £128,050 | £101,618 | £99,927 |
| 2009-06 | £111,592 | £193,585 | £131,796 | £104,716 | £102,084 |
| 2009-07 | £113,796 | £197,956 | £134,838 | £107,318 | £103,221 |
| 2009-08 | £114,528 | £199,884 | £136,153 | £108,392 | £103,160 |
| 2009-09 | £115,294 | £201,442 | £137,389 | £109,199 | £103,543 |
| 2009-10 | £114,135 | £199,878 | £136,306 | £108,068 | £102,321 |
| 2009-11 | £114,084 | £200,544 | £136,183 | £108,248 | £102,033 |
| 2009-12 | £115,523 | £202,672 | £138,122 | £110,122 | £102,690 |
| 2010-01 | £114,769 | £202,178 | £137,605 | £109,732 | £101,401 |
| 2010-02 | £114,366 | £201,696 | £137,738 | £109,334 | £100,660 |
| 2010-03 | £111,554 | £197,739 | £134,346 | £106,043 | £98,695 |
| 2010-04 | £114,554 | £202,340 | £137,790 | £108,684 | £101,687 |
| 2010-05 | £115,850 | £204,655 | £139,075 | £109,753 | £103,150 |
| 2010-06 | £117,228 | £206,964 | £140,951 | £111,464 | £103,862 |
| 2010-07 | £115,394 | £204,982 | £138,885 | £109,947 | £101,871 |
| 2010-08 | £116,672 | £207,788 | £140,969 | £111,214 | £102,604 |
| 2010-09 | £116,293 | £208,161 | £140,614 | £110,751 | £102,248 |
| 2010-10 | £118,081 | £211,323 | £142,766 | £112,214 | £104,056 |
| 2010-11 | £115,249 | £206,901 | £139,132 | £109,301 | £101,859 |
| 2010-12 | £114,642 | £205,629 | £138,495 | £108,505 | £101,488 |
| 2011-01 | £111,856 | £200,878 | £135,040 | £105,684 | £99,238 |
| 2011-02 | £113,635 | £204,130 | £136,978 | £107,284 | £101,024 |
| 2011-03 | £111,448 | £201,409 | £134,240 | £105,102 | £99,189 |
| 2011-04 | £112,030 | £202,293 | £134,802 | £105,628 | £99,840 |
| 2011-05 | £112,098 | £201,590 | £134,582 | £105,497 | £100,371 |
| 2011-06 | £115,225 | £205,676 | £138,344 | £108,542 | £103,167 |
| 2011-07 | £117,629 | £209,288 | £141,183 | £110,785 | £105,421 |
| 2011-08 | £117,797 | £210,230 | £142,090 | £111,333 | £104,641 |
| 2011-09 | £118,237 | £212,033 | £142,782 | £111,957 | £104,638 |
| 2011-10 | £114,583 | £206,700 | £138,900 | £108,546 | £100,909 |
| 2011-11 | £112,278 | £202,543 | £135,998 | £106,057 | £99,266 |
| 2011-12 | £110,621 | £199,453 | £134,037 | £104,271 | £98,003 |
| 2012-01 | £112,136 | £201,920 | £136,037 | £105,869 | £99,082 |
| 2012-02 | £113,201 | £204,113 | £137,542 | £107,311 | £99,400 |
| 2012-03 | £114,394 | £205,594 | £139,063 | £108,752 | £100,132 |
| 2012-04 | £115,442 | £207,416 | £140,084 | £109,607 | £101,414 |
| 2012-05 | £114,128 | £204,409 | £138,273 | £108,226 | £100,638 |
| 2012-06 | £115,414 | £206,371 | £139,597 | £109,669 | £101,706 |
| 2012-07 | £115,273 | £205,492 | £139,378 | £109,814 | £101,334 |
| 2012-08 | £118,671 | £211,460 | £143,523 | £113,359 | £103,932 |
| 2012-09 | £117,661 | £210,275 | £142,493 | £112,310 | £102,953 |
| 2012-10 | £116,948 | £209,425 | £141,668 | £111,545 | £102,366 |
| 2012-11 | £114,441 | £205,480 | £138,675 | £109,014 | £100,260 |
| 2012-12 | £112,700 | £203,235 | £136,665 | £107,242 | £98,723 |
| 2013-01 | £112,330 | £202,808 | £136,774 | £106,874 | £97,987 |
| 2013-02 | £111,858 | £202,055 | £136,370 | £106,446 | £97,394 |
| 2013-03 | £111,509 | £201,574 | £135,958 | £105,888 | £97,283 |
| 2013-04 | £111,676 | £201,926 | £135,577 | £106,036 | £97,808 |
| 2013-05 | £113,664 | £205,153 | £137,887 | £107,810 | £99,768 |
| 2013-06 | £114,919 | £206,298 | £139,459 | £109,330 | £100,562 |
| 2013-07 | £116,725 | £208,737 | £141,611 | £111,248 | £102,011 |
| 2013-08 | £117,063 | £209,200 | £142,075 | £111,752 | £102,084 |
| 2013-09 | £118,866 | £213,643 | £144,360 | £113,330 | £103,659 |
| 2013-10 | £119,712 | £216,616 | £145,697 | £113,820 | £104,433 |
| 2013-11 | £119,793 | £217,468 | £145,874 | £113,715 | £104,598 |
| 2013-12 | £119,673 | £216,821 | £145,780 | £113,631 | £104,463 |
| 2014-01 | £119,298 | £216,269 | £145,436 | £113,493 | £103,814 |
| 2014-02 | £120,822 | £220,132 | £147,629 | £115,146 | £104,676 |
| 2014-03 | £120,103 | £219,064 | £146,826 | £114,386 | £104,054 |
| 2014-04 | £120,254 | £218,971 | £146,975 | £114,651 | £104,122 |
| 2014-05 | £120,798 | £218,937 | £147,392 | £115,169 | £104,790 |
| 2014-06 | £123,628 | £223,996 | £150,894 | £118,083 | £107,040 |
| 2014-07 | £126,766 | £229,480 | £154,799 | £121,280 | £109,560 |
| 2014-08 | £128,275 | £232,595 | £156,937 | £122,958 | £110,488 |
| 2014-09 | £129,978 | £235,838 | £159,153 | £124,771 | £111,725 |
| 2014-10 | £130,036 | £236,755 | £159,431 | £124,637 | £111,775 |
| 2014-11 | £129,931 | £237,043 | £159,379 | £124,305 | £111,810 |
| 2014-12 | £128,746 | £235,431 | £157,906 | £122,896 | £110,998 |
| 2015-01 | £128,873 | £235,525 | £157,987 | £122,889 | £111,262 |
| 2015-02 | £128,736 | £234,898 | £157,454 | £122,661 | £111,428 |
| 2015-03 | £128,771 | £235,140 | £157,549 | £122,351 | £111,717 |
| 2015-04 | £128,869 | £236,089 | £157,812 | £122,620 | £111,547 |
| 2015-05 | £131,114 | £240,430 | £160,959 | £124,754 | £113,295 |
| 2015-06 | £131,653 | £241,311 | £161,925 | £125,849 | £113,126 |
| 2015-07 | £133,245 | £243,453 | £164,000 | £127,333 | £114,511 |
| 2015-08 | £135,437 | £247,722 | £166,752 | £129,706 | £116,118 |
| 2015-09 | £138,912 | £255,119 | £170,982 | £132,829 | £119,243 |
| 2015-10 | £140,232 | £258,747 | £172,964 | £134,212 | £120,052 |
| 2015-11 | £138,641 | £256,330 | £171,222 | £132,535 | £118,694 |
| 2015-12 | £139,009 | £257,490 | £171,927 | £132,927 | £118,838 |
| 2016-01 | £140,698 | £260,271 | £174,193 | £134,491 | £120,261 |
| 2016-02 | £141,684 | £262,294 | £175,647 | £135,543 | £120,895 |
| 2016-03 | £141,537 | £261,119 | £175,325 | £135,363 | £120,912 |
| 2016-04 | £142,743 | £264,183 | £176,514 | £136,482 | £122,069 |
| 2016-05 | £143,260 | £264,399 | £176,405 | £136,855 | £122,993 |
| 2016-06 | £144,935 | £268,269 | £178,372 | £138,430 | £124,457 |
| 2016-07 | £144,978 | £267,174 | £178,098 | £138,501 | £124,677 |
| 2016-08 | £147,328 | £271,843 | £181,113 | £140,634 | £126,716 |
| 2016-09 | £148,982 | £274,657 | £183,277 | £142,081 | £128,205 |
| 2016-10 | £148,735 | £275,147 | £183,196 | £141,262 | £128,345 |
| 2016-11 | £148,988 | £276,871 | £183,631 | £141,039 | £128,846 |
| 2016-12 | £149,725 | £278,882 | £184,282 | £141,470 | £129,801 |
| 2017-01 | £151,638 | £282,922 | £186,396 | £143,269 | £131,554 |
| 2017-02 | £152,968 | £284,859 | £187,623 | £144,566 | £132,893 |
| 2017-03 | £153,371 | £285,547 | £187,984 | £144,642 | £133,572 |
| 2017-04 | £153,298 | £284,816 | £187,583 | £144,478 | £133,765 |
| 2017-05 | £152,324 | £282,097 | £186,620 | £143,343 | £133,036 |
| 2017-06 | £154,699 | £284,832 | £189,145 | £145,697 | £135,270 |
| 2017-07 | £156,712 | £287,635 | £191,768 | £147,729 | £136,879 |
| 2017-08 | £161,660 | £296,296 | £197,674 | £152,796 | £140,947 |
| 2017-09 | £162,771 | £299,278 | £199,476 | £154,019 | £141,509 |
| 2017-10 | £164,283 | £303,106 | £201,789 | £155,364 | £142,630 |
| 2017-11 | £164,921 | £305,311 | £203,096 | £155,782 | £143,045 |
| 2017-12 | £165,474 | £306,557 | £204,288 | £156,515 | £143,096 |
| 2018-01 | £163,757 | £303,320 | £202,297 | £154,841 | £141,595 |
| 2018-02 | £162,430 | £302,681 | £201,021 | £153,944 | £139,891 |
| 2018-03 | £161,480 | £301,356 | £199,975 | £153,196 | £138,888 |
| 2018-04 | £165,220 | £309,156 | £205,048 | £157,439 | £141,290 |
| 2018-05 | £166,140 | £309,986 | £206,339 | £158,531 | £141,889 |
| 2018-06 | £169,859 | £317,089 | £211,385 | £161,970 | £144,928 |
| 2018-07 | £169,818 | £317,228 | £211,301 | £161,807 | £144,990 |
| 2018-08 | £172,287 | £321,766 | £214,384 | £164,157 | £147,099 |
| 2018-09 | £169,878 | £317,353 | £211,125 | £161,935 | £145,111 |
| 2018-10 | £170,226 | £318,143 | £211,674 | £162,258 | £145,348 |
| 2018-11 | £170,110 | £319,034 | £211,979 | £162,148 | £144,961 |
| 2018-12 | £171,882 | £322,911 | £214,746 | £163,933 | £146,085 |
| 2019-01 | £172,299 | £324,399 | £215,471 | £163,999 | £146,555 |
| 2019-02 | £170,583 | £321,455 | £213,356 | £162,380 | £145,020 |
| 2019-03 | £170,641 | £322,220 | £213,650 | £162,384 | £144,918 |
| 2019-04 | £171,533 | £323,408 | £214,740 | £163,731 | £145,295 |
| 2019-05 | £171,782 | £323,063 | £215,060 | £164,150 | £145,394 |
| 2019-06 | £170,807 | £320,116 | £213,595 | £163,332 | £144,668 |
| 2019-07 | £171,181 | £320,071 | £213,930 | £163,766 | £145,032 |
| 2019-08 | £174,341 | £326,166 | £217,916 | £167,131 | £147,396 |
| 2019-09 | £175,963 | £329,238 | £219,515 | £168,963 | £148,770 |
| 2019-10 | £177,549 | £332,700 | £222,506 | £170,454 | £149,557 |
| 2019-11 | £178,488 | £334,908 | £224,119 | £170,969 | £150,408 |
| 2019-12 | £177,994 | £334,910 | £224,407 | £170,624 | £149,336 |
| 2020-01 | £175,233 | £330,453 | £221,021 | £168,074 | £146,850 |
| 2020-02 | £171,338 | £323,877 | £216,374 | £164,905 | £142,926 |
| 2020-03 | £174,004 | £329,404 | £219,891 | £167,506 | £145,010 |
| 2020-04 | £169,425 | £322,078 | £214,283 | £163,624 | £140,585 |
| 2020-05 | £166,771 | £317,631 | £211,168 | £160,670 | £138,547 |
| 2020-06 | £166,010 | £315,203 | £210,325 | £160,143 | £137,731 |
| 2020-07 | £175,019 | £330,289 | £221,386 | £168,615 | £145,688 |
| 2020-08 | £184,754 | £348,272 | £234,136 | £178,314 | £153,314 |
| 2020-09 | £186,042 | £351,635 | £235,918 | £179,609 | £154,205 |
| 2020-10 | £187,069 | £354,828 | £237,353 | £180,867 | £154,694 |
| 2020-11 | £188,973 | £358,060 | £239,157 | £183,019 | £156,359 |
| 2020-12 | £193,243 | £366,162 | £244,497 | £187,650 | £159,519 |
| 2021-01 | £199,296 | £374,107 | £251,339 | £193,285 | £165,362 |
| 2021-02 | £201,691 | £375,708 | £253,457 | £195,748 | £167,885 |
| 2021-03 | £209,849 | £386,631 | £262,287 | £203,298 | £176,007 |
| 2021-04 | £210,199 | £387,775 | £262,330 | £204,033 | £176,168 |
| 2021-05 | £210,236 | £388,427 | £262,435 | £204,078 | £176,126 |
| 2021-06 | £211,418 | £389,827 | £263,698 | £206,457 | £176,242 |
| 2021-07 | £208,722 | £385,391 | £260,485 | £203,368 | £174,272 |
| 2021-08 | £209,079 | £388,080 | £262,067 | £204,028 | £173,554 |
| 2021-09 | £206,360 | £385,305 | £259,738 | £201,240 | £170,667 |
| 2021-10 | £211,691 | £399,740 | £268,004 | £206,930 | £173,536 |
| 2021-11 | £217,269 | £411,091 | £275,270 | £212,200 | £178,106 |
| 2021-12 | £220,027 | £419,509 | £279,613 | £214,953 | £179,676 |
| 2022-01 | £229,527 | £435,577 | £292,094 | £224,930 | £186,733 |
| 2022-02 | £230,066 | £435,685 | £292,671 | £225,718 | £187,155 |
| 2022-03 | £230,158 | £436,369 | £293,646 | £225,413 | £187,036 |
| 2022-04 | £229,818 | £435,471 | £292,905 | £225,351 | £186,729 |
| 2022-05 | £232,717 | £441,274 | £297,333 | £228,671 | £188,151 |
| 2022-06 | £234,545 | £443,679 | £299,348 | £230,997 | £189,421 |
| 2022-07 | £231,065 | £435,870 | £295,162 | £227,974 | £186,158 |
| 2022-08 | £230,341 | £434,111 | £294,180 | £227,867 | £185,092 |
| 2022-09 | £232,660 | £438,732 | £297,412 | £230,628 | £186,349 |
| 2022-10 | £231,541 | £438,337 | £296,365 | £229,676 | £184,961 |
| 2022-11 | £234,049 | £444,264 | £299,963 | £232,127 | £186,679 |
| 2022-12 | £233,605 | £443,842 | £299,522 | £231,628 | £186,271 |
| 2023-01 | £231,174 | £439,485 | £296,759 | £228,676 | £184,573 |
| 2023-02 | £226,523 | £431,002 | £290,263 | £223,216 | £181,706 |
| 2023-03 | £223,965 | £427,555 | £287,073 | £219,386 | £180,438 |
| 2023-04 | £223,559 | £427,179 | £286,084 | £218,407 | £180,661 |
| 2023-05 | £222,199 | £423,421 | £283,992 | £216,744 | £179,975 |
| 2023-06 | £224,700 | £426,781 | £286,562 | £219,992 | £181,817 |
| 2023-07 | £229,283 | £433,803 | £292,500 | £224,979 | £185,239 |
| 2023-08 | £237,753 | £449,691 | £303,797 | £234,331 | £191,217 |
| 2023-09 | £243,626 | £460,887 | £311,624 | £240,565 | £195,520 |
| 2023-10 | £248,175 | £468,447 | £316,895 | £244,996 | £199,489 |
| 2023-11 | £245,089 | £463,585 | £313,237 | £241,205 | £197,315 |
| 2023-12 | £239,704 | £452,821 | £306,390 | £235,469 | £193,260 |
| 2024-01 | £233,879 | £442,625 | £299,029 | £229,791 | £188,466 |
| 2024-02 | £229,955 | £433,597 | £293,702 | £226,327 | £185,182 |
| 2024-03 | £229,310 | £431,475 | £292,113 | £225,198 | £185,546 |
| 2024-04 | £231,082 | £433,402 | £294,148 | £226,889 | £187,248 |
| 2024-05 | £248,644 | £464,664 | £315,670 | £243,808 | £202,408 |
| 2024-06 | £252,916 | £471,919 | £321,026 | £248,664 | £205,327 |
| 2024-07 | £255,632 | £476,918 | £324,766 | £252,117 | £206,609 |
| 2024-08 | £246,332 | £460,170 | £313,231 | £243,822 | £198,040 |
| 2024-09 | £244,986 | £459,337 | £312,243 | £242,629 | £196,277 |
| 2024-10 | £244,536 | £459,721 | £311,453 | £241,900 | £196,246 |
| 2024-11 | £242,717 | £457,699 | £309,777 | £239,887 | £194,512 |
| 2024-12 | £243,658 | £460,855 | £310,993 | £240,966 | £195,034 |
| 2025-01 | £242,975 | £460,439 | £310,884 | £240,574 | £193,705 |
| 2025-02 | £242,034 | £458,600 | £309,721 | £240,067 | £192,496 |
| 2025-03 | £244,674 | £457,387 | £312,034 | £242,943 | £194,945 |
| 2025-04 | £244,096 | £458,248 | £311,952 | £241,875 | £194,444 |
| 2025-05 | £246,330 | £463,963 | £315,303 | £243,997 | £196,039 |
| 2025-06 | £244,141 | £464,208 | £314,160 | £242,244 | £193,320 |
| 2025-07 | £249,208 | £471,001 | £320,106 | £248,205 | £197,142 |
| 2025-08 | £251,442 | £473,580 | £323,349 | £251,176 | £198,439 |
| 2025-09 | £251,092 | £473,488 | £323,272 | £251,226 | £197,802 |
| 2025-10 | £250,135 | £472,516 | £322,835 | £250,525 | £196,599 |
| 2025-11 | £256,261 | £484,665 | £330,431 | £256,559 | £201,560 |
| 2025-12 | £264,077 | £499,406 | £340,732 | £264,537 | £207,550 |
| 2026-01 | £267,045 | £504,734 | £344,515 | £267,998 | £209,658 |
| 2026-02 | £259,889 | £492,824 | £336,308 | £260,990 | £203,497 |
| 2026-03 | £252,125 | £479,631 | £327,249 | £253,197 | £196,899 |
| 2026-04 | £247,782 | £472,607 | £322,261 | £248,491 | £193,363 |
| 2026-05 | £247,458 | £472,583 | £322,480 | £248,520 | £192,563 |
| 2026-06 | £248,674 | £474,679 | £324,071 | £250,143 | £193,265 |
| 2026-07 | £250,653 | £477,758 | £327,116 | £253,156 | £193,979 |
| 2026-08 | £255,013 | £484,379 | £332,685 | £257,788 | £197,344 |
| 2026-09 | £254,604 | £483,455 | £332,271 | £257,482 | £196,912 |
- All property types
- Detached
- Semi-detached
- Terraced
- Flats
Source: HM Land Registry House Price Index
| Year | All property types | Detached | Semi-detached | Terraced | Flats |
|---|---|---|---|---|---|
| 1996-01 | -6.9% | -7.1% | -6.0% | -7.7% | -5.6% |
| 1996-02 | -6.3% | -5.9% | -5.7% | -7.0% | -5.1% |
| 1996-03 | -7.5% | -6.3% | -6.7% | -8.4% | -6.2% |
| 1996-04 | -7.2% | -5.9% | -6.6% | -8.1% | -5.8% |
| 1996-05 | -4.9% | -3.6% | -4.3% | -5.6% | -4.2% |
| 1996-06 | -2.6% | -1.7% | -2.3% | -2.8% | -2.3% |
| 1996-07 | -0.3% | +0.5% | 0.0% | -0.5% | -0.2% |
| 1996-08 | 0.0% | +0.7% | +0.4% | -0.3% | +0.1% |
| 1996-09 | +1.7% | +2.7% | +2.3% | +1.3% | +1.8% |
| 1996-10 | +4.1% | +5.2% | +4.5% | +3.9% | +3.3% |
| 1996-11 | +4.7% | +5.6% | +4.9% | +4.7% | +3.5% |
| 1996-12 | +5.2% | +5.9% | +5.4% | +5.6% | +3.2% |
| 1997-01 | +3.8% | +4.2% | +4.0% | +4.1% | +1.6% |
| 1997-02 | +5.9% | +6.8% | +6.1% | +6.1% | +3.9% |
| 1997-03 | +6.6% | +7.5% | +6.5% | +7.2% | +4.6% |
| 1997-04 | +6.9% | +8.0% | +6.9% | +7.4% | +4.7% |
| 1997-05 | +5.4% | +6.2% | +5.8% | +5.8% | +2.7% |
| 1997-06 | +2.9% | +4.2% | +3.8% | +3.2% | -0.9% |
| 1997-07 | +2.6% | +3.7% | +3.4% | +3.0% | -1.2% |
| 1997-08 | +2.7% | +3.7% | +3.3% | +3.1% | -0.9% |
| 1997-09 | +4.9% | +5.2% | +5.5% | +5.2% | +2.1% |
| 1997-10 | +5.9% | +6.2% | +6.6% | +6.1% | +3.4% |
| 1997-11 | +7.2% | +7.9% | +8.1% | +7.4% | +4.3% |
| 1997-12 | +3.2% | +4.4% | +3.9% | +3.1% | +0.8% |
| 1998-01 | +4.5% | +6.3% | +5.1% | +4.4% | +2.5% |
| 1998-02 | +3.8% | +4.8% | +4.3% | +3.7% | +2.5% |
| 1998-03 | +6.6% | +7.0% | +7.0% | +6.4% | +5.4% |
| 1998-04 | +9.0% | +9.1% | +9.7% | +8.6% | +7.8% |
| 1998-05 | +10.8% | +11.2% | +11.3% | +10.5% | +10.1% |
| 1998-06 | +13.1% | +13.6% | +13.3% | +12.7% | +13.7% |
| 1998-07 | +12.6% | +13.2% | +12.8% | +12.1% | +13.6% |
| 1998-08 | +14.6% | +15.4% | +14.8% | +14.2% | +15.8% |
| 1998-09 | +12.7% | +13.8% | +12.9% | +12.4% | +13.1% |
| 1998-10 | +12.0% | +13.0% | +12.0% | +11.7% | +12.8% |
| 1998-11 | +9.0% | +10.1% | +9.1% | +8.4% | +10.6% |
| 1998-12 | +14.7% | +15.1% | +14.6% | +13.9% | +17.0% |
| 1999-01 | +11.3% | +11.3% | +11.5% | +10.5% | +13.6% |
| 1999-02 | +8.8% | +8.8% | +9.0% | +8.2% | +10.1% |
| 1999-03 | +2.9% | +3.2% | +3.2% | +2.3% | +4.0% |
| 1999-04 | +1.8% | +2.1% | +1.8% | +1.5% | +2.6% |
| 1999-05 | +1.2% | +1.3% | +1.0% | +0.7% | +2.7% |
| 1999-06 | -0.2% | -0.2% | -0.2% | -0.4% | +0.8% |
| 1999-07 | -0.1% | +0.1% | -0.2% | -0.4% | +1.0% |
| 1999-08 | +0.2% | 0.0% | +0.1% | +0.2% | +0.8% |
| 1999-09 | +3.2% | +3.0% | +2.7% | +3.1% | +4.6% |
| 1999-10 | +2.1% | +1.9% | +1.8% | +1.7% | +3.7% |
| 1999-11 | +2.7% | +2.4% | +2.3% | +2.7% | +3.9% |
| 1999-12 | -1.2% | -1.6% | -1.6% | -1.2% | -0.4% |
| 2000-01 | +0.2% | 0.0% | -0.3% | +0.3% | +0.5% |
| 2000-02 | +3.4% | +3.8% | +3.0% | +3.3% | +4.0% |
| 2000-03 | +6.6% | +7.3% | +6.5% | +6.6% | +6.5% |
| 2000-04 | +7.7% | +8.4% | +7.5% | +7.4% | +8.3% |
| 2000-05 | +7.3% | +7.9% | +7.3% | +6.9% | +7.9% |
| 2000-06 | +8.9% | +9.3% | +9.0% | +8.2% | +10.4% |
| 2000-07 | +8.3% | +8.9% | +8.7% | +7.3% | +9.6% |
| 2000-08 | +7.2% | +8.1% | +7.8% | +5.6% | +9.7% |
| 2000-09 | +5.7% | +7.1% | +6.3% | +3.9% | +8.4% |
| 2000-10 | +7.7% | +9.1% | +8.4% | +6.0% | +10.1% |
| 2000-11 | +8.6% | +10.3% | +9.1% | +6.9% | +11.0% |
| 2000-12 | +11.2% | +13.1% | +11.8% | +9.2% | +14.0% |
| 2001-01 | +10.1% | +11.6% | +10.2% | +8.1% | +13.9% |
| 2001-02 | +10.9% | +11.5% | +11.0% | +9.2% | +14.5% |
| 2001-03 | +9.9% | +10.1% | +9.7% | +8.3% | +13.6% |
| 2001-04 | +10.9% | +11.5% | +10.8% | +9.5% | +14.3% |
| 2001-05 | +10.7% | +11.4% | +10.4% | +9.4% | +13.8% |
| 2001-06 | +9.3% | +9.8% | +8.8% | +8.1% | +12.3% |
| 2001-07 | +10.3% | +10.2% | +9.7% | +9.3% | +13.3% |
| 2001-08 | +11.1% | +10.9% | +10.2% | +10.5% | +13.6% |
| 2001-09 | +13.0% | +12.4% | +12.0% | +12.7% | +15.5% |
| 2001-10 | +13.1% | +12.5% | +11.9% | +13.0% | +15.6% |
| 2001-11 | +13.6% | +12.7% | +12.7% | +13.2% | +16.0% |
| 2001-12 | +11.2% | +10.2% | +10.5% | +10.9% | +13.4% |
| 2002-01 | +11.6% | +10.7% | +11.2% | +11.1% | +13.8% |
| 2002-02 | +9.2% | +8.7% | +8.5% | +8.6% | +11.7% |
| 2002-03 | +12.1% | +11.6% | +11.4% | +11.5% | +14.8% |
| 2002-04 | +13.5% | +12.7% | +12.8% | +12.8% | +16.5% |
| 2002-05 | +14.9% | +13.8% | +14.4% | +14.0% | +17.8% |
| 2002-06 | +17.4% | +16.5% | +16.8% | +16.5% | +20.2% |
| 2002-07 | +16.8% | +16.1% | +16.1% | +16.3% | +19.5% |
| 2002-08 | +19.0% | +17.9% | +18.4% | +18.5% | +21.4% |
| 2002-09 | +15.4% | +14.3% | +15.4% | +15.0% | +16.7% |
| 2002-10 | +16.6% | +15.5% | +16.9% | +16.0% | +17.4% |
| 2002-11 | +19.4% | +18.6% | +19.5% | +19.2% | +19.8% |
| 2002-12 | +22.4% | +21.6% | +22.4% | +22.4% | +22.5% |
| 2003-01 | +23.4% | +22.4% | +23.1% | +24.0% | +22.8% |
| 2003-02 | +21.3% | +19.7% | +21.3% | +21.7% | +20.5% |
| 2003-03 | +20.7% | +19.3% | +20.5% | +21.2% | +19.9% |
| 2003-04 | +15.3% | +14.2% | +15.7% | +15.6% | +14.2% |
| 2003-05 | +16.6% | +16.2% | +17.2% | +17.1% | +14.6% |
| 2003-06 | +16.5% | +15.8% | +17.3% | +16.8% | +15.0% |
| 2003-07 | +22.5% | +21.0% | +23.2% | +22.7% | +21.5% |
| 2003-08 | +20.7% | +18.4% | +21.2% | +20.9% | +19.6% |
| 2003-09 | +24.1% | +21.4% | +24.6% | +24.8% | +22.3% |
| 2003-10 | +23.7% | +20.9% | +23.7% | +24.9% | +21.6% |
| 2003-11 | +24.6% | +21.3% | +24.6% | +25.8% | +22.7% |
| 2003-12 | +27.9% | +23.7% | +27.4% | +29.5% | +26.0% |
| 2004-01 | +30.6% | +26.6% | +30.5% | +32.1% | +28.4% |
| 2004-02 | +30.9% | +27.1% | +30.6% | +32.7% | +28.3% |
| 2004-03 | +29.3% | +25.6% | +28.9% | +30.7% | +26.9% |
| 2004-04 | +32.4% | +27.3% | +31.4% | +34.7% | +29.7% |
| 2004-05 | +33.8% | +26.8% | +31.8% | +36.6% | +31.7% |
| 2004-06 | +34.9% | +27.3% | +32.9% | +38.2% | +31.9% |
| 2004-07 | +32.0% | +24.9% | +30.5% | +35.5% | +28.4% |
| 2004-08 | +32.9% | +26.6% | +31.8% | +36.4% | +28.8% |
| 2004-09 | +32.6% | +26.6% | +31.4% | +36.0% | +29.1% |
| 2004-10 | +30.9% | +25.1% | +29.5% | +33.9% | +28.4% |
| 2004-11 | +28.7% | +22.7% | +27.0% | +31.7% | +26.4% |
| 2004-12 | +23.4% | +18.0% | +21.7% | +26.0% | +21.2% |
| 2005-01 | +18.3% | +12.9% | +16.3% | +20.5% | +16.9% |
| 2005-02 | +19.9% | +14.9% | +18.2% | +21.8% | +18.9% |
| 2005-03 | +21.9% | +16.8% | +20.5% | +23.8% | +21.1% |
| 2005-04 | +23.3% | +19.3% | +22.3% | +25.0% | +22.4% |
| 2005-05 | +22.2% | +19.7% | +21.5% | +23.5% | +21.3% |
| 2005-06 | +21.3% | +19.0% | +20.5% | +22.9% | +20.3% |
| 2005-07 | +20.3% | +18.2% | +19.4% | +21.8% | +19.6% |
| 2005-08 | +19.1% | +16.8% | +18.0% | +20.8% | +18.5% |
| 2005-09 | +16.2% | +14.1% | +15.1% | +17.7% | +15.9% |
| 2005-10 | +18.0% | +15.8% | +17.1% | +19.8% | +17.1% |
| 2005-11 | +18.1% | +16.0% | +17.4% | +20.0% | +16.9% |
| 2005-12 | +20.3% | +18.2% | +19.5% | +22.3% | +19.1% |
| 2006-01 | +23.6% | +21.7% | +23.1% | +25.8% | +21.8% |
| 2006-02 | +25.2% | +22.9% | +24.2% | +27.6% | +23.6% |
| 2006-03 | +24.0% | +22.4% | +23.4% | +26.7% | +21.8% |
| 2006-04 | +21.5% | +20.0% | +20.7% | +23.9% | +19.6% |
| 2006-05 | +18.0% | +16.5% | +17.6% | +20.2% | +16.1% |
| 2006-06 | +16.0% | +14.9% | +15.9% | +17.9% | +14.3% |
| 2006-07 | +13.0% | +11.8% | +12.7% | +14.9% | +11.3% |
| 2006-08 | +11.5% | +10.4% | +11.5% | +13.6% | +9.8% |
| 2006-09 | +14.4% | +13.1% | +14.1% | +16.2% | +12.9% |
| 2006-10 | +14.5% | +13.4% | +14.6% | +16.0% | +13.0% |
| 2006-11 | +16.0% | +15.2% | +16.1% | +17.5% | +14.5% |
| 2006-12 | +13.7% | +13.3% | +14.2% | +15.6% | +11.8% |
| 2007-01 | +12.8% | +12.3% | +13.5% | +14.7% | +10.8% |
| 2007-02 | +13.2% | +13.0% | +14.1% | +14.9% | +11.1% |
| 2007-03 | +11.2% | +10.5% | +11.9% | +12.9% | +9.4% |
| 2007-04 | +11.7% | +10.9% | +12.2% | +13.5% | +9.9% |
| 2007-05 | +10.0% | +8.7% | +10.0% | +11.9% | +8.4% |
| 2007-06 | +11.7% | +10.9% | +11.6% | +13.5% | +10.2% |
| 2007-07 | +12.3% | +11.7% | +12.1% | +13.7% | +11.2% |
| 2007-08 | +12.6% | +12.6% | +12.6% | +13.9% | +11.5% |
| 2007-09 | +9.4% | +9.3% | +9.4% | +10.7% | +8.2% |
| 2007-10 | +6.4% | +6.4% | +6.3% | +7.7% | +5.3% |
| 2007-11 | +4.3% | +4.4% | +4.2% | +5.3% | +3.5% |
| 2007-12 | +6.2% | +6.7% | +6.0% | +6.9% | +5.7% |
| 2008-01 | +7.2% | +7.9% | +7.0% | +7.7% | +6.8% |
| 2008-02 | +4.9% | +5.9% | +4.7% | +5.5% | +4.3% |
| 2008-03 | +3.6% | +5.0% | +3.5% | +4.0% | +3.0% |
| 2008-04 | +1.2% | +3.3% | +1.4% | +1.6% | +0.5% |
| 2008-05 | +1.2% | +3.3% | +1.6% | +1.4% | +0.6% |
| 2008-06 | -1.6% | 0.0% | -1.3% | -1.5% | -2.2% |
| 2008-07 | -3.9% | -3.0% | -3.3% | -4.0% | -4.4% |
| 2008-08 | -6.2% | -5.8% | -5.8% | -6.4% | -6.2% |
| 2008-09 | -8.3% | -7.5% | -8.0% | -8.7% | -8.1% |
| 2008-10 | -8.4% | -7.7% | -8.2% | -8.9% | -8.1% |
| 2008-11 | -9.4% | -8.6% | -9.2% | -9.9% | -9.1% |
| 2008-12 | -12.6% | -12.1% | -12.1% | -12.8% | -12.8% |
| 2009-01 | -16.2% | -15.5% | -15.7% | -16.5% | -16.4% |
| 2009-02 | -18.1% | -17.4% | -17.6% | -18.5% | -18.0% |
| 2009-03 | -16.8% | -16.6% | -16.8% | -17.7% | -15.9% |
| 2009-04 | -15.6% | -16.3% | -15.6% | -16.7% | -14.3% |
| 2009-05 | -14.4% | -14.9% | -14.4% | -15.4% | -13.2% |
| 2009-06 | -12.8% | -12.7% | -12.6% | -13.6% | -12.2% |
| 2009-07 | -10.8% | -10.0% | -10.5% | -11.0% | -11.0% |
| 2009-08 | -9.3% | -8.1% | -8.7% | -9.2% | -9.9% |
| 2009-09 | -6.2% | -5.6% | -5.4% | -6.0% | -7.3% |
| 2009-10 | -5.1% | -4.5% | -3.9% | -4.7% | -6.6% |
| 2009-11 | -3.5% | -2.8% | -2.4% | -2.7% | -5.4% |
| 2009-12 | 0.0% | +0.9% | +1.1% | +1.1% | -2.2% |
| 2010-01 | +2.8% | +3.6% | +4.2% | +4.3% | -0.1% |
| 2010-02 | +5.2% | +6.1% | +7.3% | +7.1% | +1.5% |
| 2010-03 | +4.3% | +5.7% | +6.6% | +6.0% | +0.3% |
| 2010-04 | +6.4% | +8.2% | +8.6% | +8.1% | +2.4% |
| 2010-05 | +6.6% | +8.7% | +8.6% | +8.0% | +3.2% |
| 2010-06 | +5.1% | +6.9% | +6.9% | +6.4% | +1.7% |
| 2010-07 | +1.4% | +3.5% | +3.0% | +2.4% | -1.3% |
| 2010-08 | +1.9% | +4.0% | +3.5% | +2.6% | -0.5% |
| 2010-09 | +0.9% | +3.3% | +2.3% | +1.4% | -1.3% |
| 2010-10 | +3.5% | +5.7% | +4.7% | +3.8% | +1.7% |
| 2010-11 | +1.0% | +3.2% | +2.2% | +1.0% | -0.2% |
| 2010-12 | -0.8% | +1.5% | +0.3% | -1.5% | -1.2% |
| 2011-01 | -2.5% | -0.6% | -1.9% | -3.7% | -2.1% |
| 2011-02 | -0.6% | +1.2% | -0.6% | -1.9% | +0.4% |
| 2011-03 | -0.1% | +1.9% | -0.1% | -0.9% | +0.5% |
| 2011-04 | -2.2% | 0.0% | -2.2% | -2.8% | -1.8% |
| 2011-05 | -3.2% | -1.5% | -3.2% | -3.9% | -2.7% |
| 2011-06 | -1.7% | -0.6% | -1.8% | -2.6% | -0.7% |
| 2011-07 | +1.9% | +2.1% | +1.7% | +0.8% | +3.5% |
| 2011-08 | +1.0% | +1.2% | +0.8% | +0.1% | +2.0% |
| 2011-09 | +1.7% | +1.9% | +1.5% | +1.1% | +2.3% |
| 2011-10 | -3.0% | -2.2% | -2.7% | -3.3% | -3.0% |
| 2011-11 | -2.6% | -2.1% | -2.3% | -3.0% | -2.5% |
| 2011-12 | -3.5% | -3.0% | -3.2% | -3.9% | -3.4% |
| 2012-01 | +0.3% | +0.5% | +0.7% | +0.2% | -0.2% |
| 2012-02 | -0.4% | 0.0% | +0.4% | 0.0% | -1.6% |
| 2012-03 | +2.6% | +2.1% | +3.6% | +3.5% | +1.0% |
| 2012-04 | +3.0% | +2.5% | +3.9% | +3.8% | +1.6% |
| 2012-05 | +1.8% | +1.4% | +2.7% | +2.6% | +0.3% |
| 2012-06 | +0.2% | +0.3% | +0.9% | +1.0% | -1.4% |
| 2012-07 | -2.0% | -1.8% | -1.3% | -0.9% | -3.9% |
| 2012-08 | +0.7% | +0.6% | +1.0% | +1.8% | -0.7% |
| 2012-09 | -0.5% | -0.8% | -0.2% | +0.3% | -1.6% |
| 2012-10 | +2.1% | +1.3% | +2.0% | +2.8% | +1.4% |
| 2012-11 | +1.9% | +1.5% | +2.0% | +2.8% | +1.0% |
| 2012-12 | +1.9% | +1.9% | +2.0% | +2.8% | +0.7% |
| 2013-01 | +0.2% | +0.4% | +0.5% | +0.9% | -1.1% |
| 2013-02 | -1.2% | -1.0% | -0.9% | -0.8% | -2.0% |
| 2013-03 | -2.5% | -2.0% | -2.2% | -2.6% | -2.8% |
| 2013-04 | -3.3% | -2.6% | -3.2% | -3.3% | -3.6% |
| 2013-05 | -0.4% | +0.4% | -0.3% | -0.4% | -0.9% |
| 2013-06 | -0.4% | 0.0% | -0.1% | -0.3% | -1.1% |
| 2013-07 | +1.3% | +1.6% | +1.6% | +1.3% | +0.7% |
| 2013-08 | -1.4% | -1.1% | -1.0% | -1.4% | -1.8% |
| 2013-09 | +1.0% | +1.6% | +1.3% | +0.9% | +0.7% |
| 2013-10 | +2.4% | +3.4% | +2.8% | +2.0% | +2.0% |
| 2013-11 | +4.7% | +5.8% | +5.2% | +4.3% | +4.3% |
| 2013-12 | +6.2% | +6.7% | +6.7% | +6.0% | +5.8% |
| 2014-01 | +6.2% | +6.6% | +6.3% | +6.2% | +5.9% |
| 2014-02 | +8.0% | +8.9% | +8.3% | +8.2% | +7.5% |
| 2014-03 | +7.7% | +8.7% | +8.0% | +8.0% | +7.0% |
| 2014-04 | +7.7% | +8.4% | +8.4% | +8.1% | +6.5% |
| 2014-05 | +6.3% | +6.7% | +6.9% | +6.8% | +5.0% |
| 2014-06 | +7.6% | +8.6% | +8.2% | +8.0% | +6.4% |
| 2014-07 | +8.6% | +9.9% | +9.3% | +9.0% | +7.4% |
| 2014-08 | +9.6% | +11.2% | +10.5% | +10.0% | +8.2% |
| 2014-09 | +9.3% | +10.4% | +10.2% | +10.1% | +7.8% |
| 2014-10 | +8.6% | +9.3% | +9.4% | +9.5% | +7.0% |
| 2014-11 | +8.5% | +9.0% | +9.3% | +9.3% | +6.9% |
| 2014-12 | +7.6% | +8.6% | +8.3% | +8.2% | +6.3% |
| 2015-01 | +8.0% | +8.9% | +8.6% | +8.3% | +7.2% |
| 2015-02 | +6.6% | +6.7% | +6.7% | +6.5% | +6.4% |
| 2015-03 | +7.2% | +7.3% | +7.3% | +7.0% | +7.4% |
| 2015-04 | +7.2% | +7.8% | +7.4% | +7.0% | +7.1% |
| 2015-05 | +8.5% | +9.8% | +9.2% | +8.3% | +8.1% |
| 2015-06 | +6.5% | +7.7% | +7.3% | +6.6% | +5.7% |
| 2015-07 | +5.1% | +6.1% | +5.9% | +5.0% | +4.5% |
| 2015-08 | +5.6% | +6.5% | +6.3% | +5.5% | +5.1% |
| 2015-09 | +6.9% | +8.2% | +7.4% | +6.5% | +6.7% |
| 2015-10 | +7.8% | +9.3% | +8.5% | +7.7% | +7.4% |
| 2015-11 | +6.7% | +8.1% | +7.4% | +6.6% | +6.2% |
| 2015-12 | +8.0% | +9.4% | +8.9% | +8.2% | +7.1% |
| 2016-01 | +9.2% | +10.5% | +10.3% | +9.4% | +8.1% |
| 2016-02 | +10.1% | +11.7% | +11.6% | +10.5% | +8.5% |
| 2016-03 | +9.9% | +11.0% | +11.3% | +10.6% | +8.2% |
| 2016-04 | +10.8% | +11.9% | +11.9% | +11.3% | +9.4% |
| 2016-05 | +9.3% | +10.0% | +9.6% | +9.7% | +8.6% |
| 2016-06 | +10.1% | +11.2% | +10.2% | +10.0% | +10.0% |
| 2016-07 | +8.8% | +9.7% | +8.6% | +8.8% | +8.9% |
| 2016-08 | +8.8% | +9.7% | +8.6% | +8.4% | +9.1% |
| 2016-09 | +7.2% | +7.7% | +7.2% | +7.0% | +7.5% |
| 2016-10 | +6.1% | +6.3% | +5.9% | +5.3% | +6.9% |
| 2016-11 | +7.5% | +8.0% | +7.2% | +6.4% | +8.6% |
| 2016-12 | +7.7% | +8.3% | +7.2% | +6.4% | +9.2% |
| 2017-01 | +7.8% | +8.7% | +7.0% | +6.5% | +9.4% |
| 2017-02 | +8.0% | +8.6% | +6.8% | +6.7% | +9.9% |
| 2017-03 | +8.4% | +9.4% | +7.2% | +6.9% | +10.5% |
| 2017-04 | +7.4% | +7.8% | +6.3% | +5.9% | +9.6% |
| 2017-05 | +6.3% | +6.7% | +5.8% | +4.7% | +8.2% |
| 2017-06 | +6.7% | +6.2% | +6.0% | +5.3% | +8.7% |
| 2017-07 | +8.1% | +7.7% | +7.7% | +6.7% | +9.8% |
| 2017-08 | +9.7% | +9.0% | +9.1% | +8.6% | +11.2% |
| 2017-09 | +9.3% | +9.0% | +8.8% | +8.4% | +10.4% |
| 2017-10 | +10.5% | +10.2% | +10.1% | +10.0% | +11.1% |
| 2017-11 | +10.7% | +10.3% | +10.6% | +10.5% | +11.0% |
| 2017-12 | +10.5% | +9.9% | +10.9% | +10.6% | +10.2% |
| 2018-01 | +8.0% | +7.2% | +8.5% | +8.1% | +7.6% |
| 2018-02 | +6.2% | +6.3% | +7.1% | +6.5% | +5.3% |
| 2018-03 | +5.3% | +5.5% | +6.4% | +5.9% | +4.0% |
| 2018-04 | +7.8% | +8.5% | +9.3% | +9.0% | +5.6% |
| 2018-05 | +9.1% | +9.9% | +10.6% | +10.6% | +6.7% |
| 2018-06 | +9.8% | +11.3% | +11.8% | +11.2% | +7.1% |
| 2018-07 | +8.4% | +10.3% | +10.2% | +9.5% | +5.9% |
| 2018-08 | +6.6% | +8.6% | +8.5% | +7.4% | +4.4% |
| 2018-09 | +4.4% | +6.0% | +5.8% | +5.1% | +2.5% |
| 2018-10 | +3.6% | +5.0% | +4.9% | +4.4% | +1.9% |
| 2018-11 | +3.1% | +4.5% | +4.4% | +4.1% | +1.3% |
| 2018-12 | +3.9% | +5.3% | +5.1% | +4.7% | +2.1% |
| 2019-01 | +5.2% | +6.9% | +6.5% | +5.9% | +3.5% |
| 2019-02 | +5.0% | +6.2% | +6.1% | +5.5% | +3.7% |
| 2019-03 | +5.7% | +6.9% | +6.8% | +6.0% | +4.3% |
| 2019-04 | +3.8% | +4.6% | +4.7% | +4.0% | +2.8% |
| 2019-05 | +3.4% | +4.2% | +4.2% | +3.5% | +2.5% |
| 2019-06 | +0.6% | +1.0% | +1.0% | +0.8% | -0.2% |
| 2019-07 | +0.8% | +0.9% | +1.2% | +1.2% | 0.0% |
| 2019-08 | +1.2% | +1.4% | +1.6% | +1.8% | +0.2% |
| 2019-09 | +3.6% | +3.7% | +4.0% | +4.3% | +2.5% |
| 2019-10 | +4.3% | +4.6% | +5.1% | +5.1% | +2.9% |
| 2019-11 | +4.9% | +5.0% | +5.7% | +5.4% | +3.8% |
| 2019-12 | +3.6% | +3.7% | +4.5% | +4.1% | +2.2% |
| 2020-01 | +1.7% | +1.9% | +2.6% | +2.5% | +0.2% |
| 2020-02 | +0.4% | +0.8% | +1.4% | +1.6% | -1.4% |
| 2020-03 | +2.0% | +2.2% | +2.9% | +3.2% | +0.1% |
| 2020-04 | -1.2% | -0.4% | -0.2% | -0.1% | -3.2% |
| 2020-05 | -2.9% | -1.7% | -1.8% | -2.1% | -4.7% |
| 2020-06 | -2.8% | -1.5% | -1.5% | -2.0% | -4.8% |
| 2020-07 | +2.2% | +3.2% | +3.5% | +3.0% | +0.5% |
| 2020-08 | +6.0% | +6.8% | +7.4% | +6.7% | +4.0% |
| 2020-09 | +5.7% | +6.8% | +7.5% | +6.3% | +3.7% |
| 2020-10 | +5.4% | +6.7% | +6.7% | +6.1% | +3.4% |
| 2020-11 | +5.9% | +6.9% | +6.7% | +7.0% | +4.0% |
| 2020-12 | +8.6% | +9.3% | +9.0% | +10.0% | +6.8% |
| 2021-01 | +13.7% | +13.2% | +13.7% | +15.0% | +12.6% |
| 2021-02 | +17.7% | +16.0% | +17.1% | +18.7% | +17.5% |
| 2021-03 | +20.6% | +17.4% | +19.3% | +21.4% | +21.4% |
| 2021-04 | +24.1% | +20.4% | +22.4% | +24.7% | +25.3% |
| 2021-05 | +26.1% | +22.3% | +24.3% | +27.0% | +27.1% |
| 2021-06 | +27.4% | +23.7% | +25.4% | +28.9% | +28.0% |
| 2021-07 | +19.3% | +16.7% | +17.7% | +20.6% | +19.6% |
| 2021-08 | +13.2% | +11.4% | +11.9% | +14.4% | +13.2% |
| 2021-09 | +10.9% | +9.6% | +10.1% | +12.0% | +10.7% |
| 2021-10 | +13.2% | +12.7% | +12.9% | +14.4% | +12.2% |
| 2021-11 | +15.0% | +14.8% | +15.1% | +15.9% | +13.9% |
| 2021-12 | +13.9% | +14.6% | +14.4% | +14.5% | +12.6% |
| 2022-01 | +15.2% | +16.4% | +16.2% | +16.4% | +12.9% |
| 2022-02 | +14.1% | +16.0% | +15.5% | +15.3% | +11.5% |
| 2022-03 | +9.7% | +12.9% | +12.0% | +10.9% | +6.3% |
| 2022-04 | +9.3% | +12.3% | +11.7% | +10.4% | +6.0% |
| 2022-05 | +10.7% | +13.6% | +13.3% | +12.1% | +6.8% |
| 2022-06 | +10.9% | +13.8% | +13.5% | +11.9% | +7.5% |
| 2022-07 | +10.7% | +13.1% | +13.3% | +12.1% | +6.8% |
| 2022-08 | +10.2% | +11.9% | +12.3% | +11.7% | +6.6% |
| 2022-09 | +12.7% | +13.9% | +14.5% | +14.6% | +9.2% |
| 2022-10 | +9.4% | +9.7% | +10.6% | +11.0% | +6.6% |
| 2022-11 | +7.7% | +8.1% | +9.0% | +9.4% | +4.8% |
| 2022-12 | +6.2% | +5.8% | +7.1% | +7.8% | +3.7% |
| 2023-01 | +0.7% | +0.9% | +1.6% | +1.7% | -1.2% |
| 2023-02 | -1.5% | -1.1% | -0.8% | -1.1% | -2.9% |
| 2023-03 | -2.7% | -2.0% | -2.2% | -2.7% | -3.5% |
| 2023-04 | -2.7% | -1.9% | -2.3% | -3.1% | -3.2% |
| 2023-05 | -4.5% | -4.0% | -4.5% | -5.2% | -4.3% |
| 2023-06 | -4.2% | -3.8% | -4.3% | -4.8% | -4.0% |
| 2023-07 | -0.8% | -0.5% | -0.9% | -1.3% | -0.5% |
| 2023-08 | +3.2% | +3.6% | +3.3% | +2.8% | +3.3% |
| 2023-09 | +4.7% | +5.0% | +4.8% | +4.3% | +4.9% |
| 2023-10 | +7.2% | +6.9% | +6.9% | +6.7% | +7.9% |
| 2023-11 | +4.7% | +4.3% | +4.4% | +3.9% | +5.7% |
| 2023-12 | +2.6% | +2.0% | +2.3% | +1.7% | +3.8% |
| 2024-01 | +1.2% | +0.7% | +0.8% | +0.5% | +2.1% |
| 2024-02 | +1.5% | +0.6% | +1.2% | +1.4% | +1.9% |
| 2024-03 | +2.4% | +0.9% | +1.8% | +2.6% | +2.8% |
| 2024-04 | +3.4% | +1.5% | +2.8% | +3.9% | +3.6% |
| 2024-05 | +11.9% | +9.7% | +11.2% | +12.5% | +12.5% |
| 2024-06 | +12.6% | +10.6% | +12.0% | +13.0% | +12.9% |
| 2024-07 | +11.5% | +9.9% | +11.0% | +12.1% | +11.5% |
| 2024-08 | +3.6% | +2.3% | +3.1% | +4.1% | +3.6% |
| 2024-09 | +0.6% | -0.3% | +0.2% | +0.9% | +0.4% |
| 2024-10 | -1.5% | -1.9% | -1.7% | -1.3% | -1.6% |
| 2024-11 | -1.0% | -1.3% | -1.1% | -0.5% | -1.4% |
| 2024-12 | +1.6% | +1.8% | +1.5% | +2.3% | +0.9% |
| 2025-01 | +3.9% | +4.0% | +4.0% | +4.7% | +2.8% |
| 2025-02 | +5.3% | +5.8% | +5.5% | +6.1% | +3.9% |
| 2025-03 | +6.7% | +6.0% | +6.8% | +7.9% | +5.1% |
| 2025-04 | +5.6% | +5.7% | +6.1% | +6.6% | +3.8% |
| 2025-05 | -0.9% | -0.1% | -0.1% | +0.1% | -3.1% |
| 2025-06 | -3.5% | -1.6% | -2.1% | -2.6% | -5.8% |
| 2025-07 | -2.5% | -1.2% | -1.4% | -1.5% | -4.6% |
| 2025-08 | +2.1% | +2.9% | +3.2% | +3.0% | +0.2% |
| 2025-09 | +2.5% | +3.1% | +3.5% | +3.5% | +0.8% |
| 2025-10 | +2.3% | +2.8% | +3.7% | +3.6% | +0.2% |
| 2025-11 | +5.6% | +5.9% | +6.7% | +6.9% | +3.6% |
| 2025-12 | +8.4% | +8.4% | +9.6% | +9.8% | +6.4% |
| 2026-01 | +9.9% | +9.6% | +10.8% | +11.4% | +8.2% |
| 2026-02 | +7.4% | +7.5% | +8.6% | +8.7% | +5.7% |
| 2026-03 | +3.0% | +4.9% | +4.9% | +4.2% | +1.0% |
| 2026-04 | +1.5% | +3.1% | +3.3% | +2.7% | -0.6% |
| 2026-05 | +0.5% | +1.9% | +2.3% | +1.9% | -1.8% |
| 2026-06 | +1.9% | +2.3% | +3.2% | +3.3% | 0.0% |
| 2026-07 | +0.6% | +1.4% | +2.2% | +2.0% | -1.6% |
| 2026-08 | +1.4% | +2.3% | +2.9% | +2.6% | -0.6% |
| 2026-09 | +1.4% | +2.1% | +2.8% | +2.5% | -0.4% |
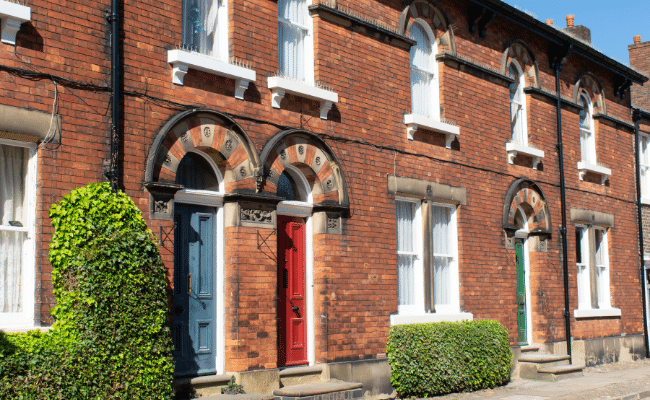
Sold House Prices in Manchester
The average sold price across all property types in Manchester was £254,604 in September 2026, 13.1% below the England average of £292,998. Detached, semi-detached and terraced homes each sold for more than their England averages that month. Flats were the one type below England's average, and they were most of what sold in the city-centre postcodes.
| Property Type | Manchester Average | England Average | Difference |
|---|---|---|---|
| Detached houses | £483,455 | £476,710 | +1.4% |
| Semi-detached houses | £332,271 | £291,507 | +14.0% |
| Terraced houses | £257,482 | £246,180 | +4.6% |
| Flats and maisonettes | £196,912 | £215,760 | -8.7% |
| All property types | £254,604 | £292,998 | -13.1% |
Detached houses sold for £483,455, 1.4% above England's £476,710, and rose 2.1% over the year to September 2026. They were a small share of sales everywhere in the city, at most 13.4% of homes sold, in M23 (Wythenshawe).
Semi-detached houses had the biggest lead over England, selling for £332,271 against £291,507, a gap of 14.0%. They rose 2.8% over the year. Semis were close to half of all sales in M40 (Moston, Collyhurst) and M9 (Blackley, Harpurhey).
Terraced houses sold for £257,482, 4.6% above England's £246,180, and rose 2.5% over the year. They were more than half of the homes sold in four postcodes of the inner east and south: M13, M14, M18 and M12.
Flats and maisonettes sold for £196,912, 8.7% below England's £215,760, and were the only type to fall over the year, by 0.4%. Between July 2025 and June 2026, flats were more than nine in ten of the homes sold in five postcodes: M1, M4 and M15 in the city, and M3 and M50, which are mostly or wholly in Salford.
Price Per Square Foot in Manchester
Sold prices per square foot ranged from £234 in M8 (Crumpsall, Cheetham Hill) to £428 in M21 (Chorlton). Measuring by the square foot takes the size of the home out of the comparison. M2 has too few sales for a figure.
| Rank | Area | Price Per Sq Ft |
|---|---|---|
| 1 | M8 (Crumpsall, Cheetham Hill) | £234 |
| 2 | M18 (Gorton, Abbey Hey) | £236 |
| 3 | M9 (Blackley, Harpurhey) | £240 |
| 4 | M11 (Openshaw, Clayton) | £243 |
| 5 | M40 (Moston, Collyhurst) | £255 |
| 6 | M12 (Ardwick, Openshaw) | £259 |
| 7 | M6 (Irlams o' th' Height, Pendleton) | £262 |
| 8 | M13 (Longsight, Ardwick) | £268 |
| 9 | M5 (Salford, Ordsall) | £273 |
| 10 | M14 (Fallowfield, Rusholme) | £292 |
| 11 | M22 (Wythenshawe, Northenden) | £297 |
| 12 | M50 (Salford Quays) | £308 |
| 13 | M19 (Levenshulme, Burnage) | £312 |
| 14 | M23 (Wythenshawe) | £315 |
| 15 | M16 (Old Trafford, Stretford) | £316 |
| 16 | M15 (Hulme, Castlefield) | £327 |
| 17 | M4 (Ancoats, Northern Quarter) | £331 |
| 18 | M1 (City Centre) | £336 |
| 19 | M3 (Deansgate, Blackfriars) | £393 |
| 20 | M20 (Didsbury) | £401 |
| 21 | M21 (Chorlton) | £428 |
| - | M2 (Deansgate, St Ann's Square) | Not enough data |
Space was cheapest in the north and east, where terraced houses and semis are most of what sells. The city-centre flat postcodes M1, M4 and M15 sat in the dearer part of the table, at £327 to £336, well above M11 (Openshaw, Clayton) in the east at £243. The southern suburbs cost most, with M21 and M20 (Didsbury) both over £400.
For Sale Asking Prices in Manchester
The mean asking price across the 22 postcodes was £265,643, and £192,087 separated the cheapest, M11 at £209,698, from the dearest, M21 at £401,785. Thirteen of the 22 postcodes had asking prices below that £265,643 mean.
| Rank | Area | Asking Price |
|---|---|---|
| 1 | M11 (Openshaw, Clayton) | £209,698 |
| 2 | M9 (Blackley, Harpurhey) | £212,353 |
| 3 | M50 (Salford Quays) | £217,930 |
| 4 | M5 (Salford, Ordsall) | £221,502 |
| 5 | M18 (Gorton, Abbey Hey) | £228,287 |
| 6 | M4 (Ancoats, Northern Quarter) | £234,301 |
| 7 | M8 (Crumpsall, Cheetham Hill) | £238,256 |
| 8 | M6 (Irlams o' th' Height, Pendleton) | £239,734 |
| 9 | M14 (Fallowfield, Rusholme) | £241,504 |
| 10 | M12 (Ardwick, Openshaw) | £243,800 |
| 11 | M40 (Moston, Collyhurst) | £246,187 |
| 12 | M3 (Deansgate, Blackfriars) | £260,494 |
| 13 | M16 (Old Trafford, Stretford) | £264,505 |
| 14 | M22 (Wythenshawe, Northenden) | £268,540 |
| 15 | M13 (Longsight, Ardwick) | £272,583 |
| 16 | M15 (Hulme, Castlefield) | £272,753 |
| 17 | M23 (Wythenshawe) | £283,246 |
| 18 | M1 (City Centre) | £286,900 |
| 19 | M19 (Levenshulme, Burnage) | £296,875 |
| 20 | M2 (Deansgate, St Ann's Square) | £343,015 |
| 21 | M20 (Didsbury) | £359,895 |
| 22 | M21 (Chorlton) | £401,785 |
The cheaper half of the table is mostly the north and east of the city, plus the Salford postcodes M50, M5 and M6. Only three postcodes averaged over £300,000: M2 (Deansgate, St Ann's Square) and the southern suburbs M20 (Didsbury) and M21. Prices at the very top of the market, street by street, are in our guide to the most expensive street in Manchester.
House Price Growth in Manchester
M18 (Gorton, Abbey Hey) had the strongest five-year growth, 45.4%, and M15 (Hulme, Castlefield) the weakest, a fall of 32.2%. Seventeen of the 21 postcodes with a five-year figure grew, and four fell: M1, M4 and M15, and M50 in Salford. M2 has too few sales for any growth figure.
| Area | 1 Year | 3 Years | 5 Years |
|---|---|---|---|
| M18 (Gorton, Abbey Hey) | 8.1% | 1.0% | 45.4% |
| M9 (Blackley, Harpurhey) | 6.1% | 21.3% | 40.2% |
| M12 (Ardwick, Openshaw) | 11.6% | 20.1% | 36.1% |
| M14 (Fallowfield, Rusholme) | 6.1% | 21.3% | 32.7% |
| M40 (Moston, Collyhurst) | 8.5% | 12.8% | 32.6% |
| M23 (Wythenshawe) | -6.8% | 8.4% | 30.0% |
| M16 (Old Trafford, Stretford) | -0.8% | 33.8% | 28.2% |
| M22 (Wythenshawe, Northenden) | 2.4% | 14.7% | 27.6% |
| M6 (Irlams o' th' Height, Pendleton) | 35.8% | 1.5% | 26.9% |
| M21 (Chorlton) | 1.5% | 10.1% | 26.6% |
| M11 (Openshaw, Clayton) | 17.0% | 21.9% | 23.9% |
| M19 (Levenshulme, Burnage) | -3.3% | 9.7% | 21.3% |
| M3 (Deansgate, Blackfriars) | 5.1% | 17.3% | 16.6% |
| M8 (Crumpsall, Cheetham Hill) | -0.9% | 6.7% | 15.8% |
| M20 (Didsbury) | 3.4% | 9.2% | 13.1% |
| M5 (Salford, Ordsall) | 2.9% | 9.0% | 3.2% |
| M13 (Longsight, Ardwick) | 11.2% | -18.0% | 1.2% |
| M1 (City Centre) | -5.7% | -16.1% | -6.2% |
| M4 (Ancoats, Northern Quarter) | -10.9% | -23.0% | -12.9% |
| M50 (Salford Quays) | -11.2% | -7.2% | -15.8% |
| M15 (Hulme, Castlefield) | -6.7% | -29.1% | -32.2% |
| M2 (Deansgate, St Ann's Square) | Not enough data | Not enough data | Not enough data |
The biggest rises were in the cheaper house postcodes, with M9 (Blackley, Harpurhey) up 40.2% and M12 (Ardwick, Openshaw) up 36.1% behind M18. The four that fell were all postcodes where flats were almost every home sold. M3 (Deansgate, Blackfriars), a flat postcode that is mostly in Salford, went the other way and rose 16.6%.
Over one and three years the order changes a lot. M13 (Longsight, Ardwick) rose 11.2% in the last year but was 18.0% down on three years earlier. M23 (Wythenshawe) fell 6.8% in the year despite 30.0% growth over five. M16 (Old Trafford, Stretford) had the biggest three-year rise, 33.8%.
Monthly Property Sales in Manchester
M20 (Didsbury) had the most sales, an average of 58 a month between July 2025 and June 2026. M13 (Longsight, Ardwick) had 4 a month, and M2 fewer than one.
| Area | Sales Per Month | Asking Price |
|---|---|---|
| M20 (Didsbury) | 58 | £359,895 |
| M3 (Deansgate, Blackfriars) | 33 | £260,494 |
| M4 (Ancoats, Northern Quarter) | 33 | £234,301 |
| M21 (Chorlton) | 32 | £401,785 |
| M6 (Irlams o' th' Height, Pendleton) | 30 | £239,734 |
| M22 (Wythenshawe, Northenden) | 28 | £268,540 |
| M19 (Levenshulme, Burnage) | 27 | £296,875 |
| M40 (Moston, Collyhurst) | 25 | £246,187 |
| M23 (Wythenshawe) | 24 | £283,246 |
| M16 (Old Trafford, Stretford) | 24 | £264,505 |
| M5 (Salford, Ordsall) | 22 | £221,502 |
| M15 (Hulme, Castlefield) | 20 | £272,753 |
| M9 (Blackley, Harpurhey) | 20 | £212,353 |
| M14 (Fallowfield, Rusholme) | 16 | £241,504 |
| M1 (City Centre) | 14 | £286,900 |
| M8 (Crumpsall, Cheetham Hill) | 11 | £238,256 |
| M18 (Gorton, Abbey Hey) | 11 | £228,287 |
| M11 (Openshaw, Clayton) | 10 | £209,698 |
| M50 (Salford Quays) | 10 | £217,930 |
| M12 (Ardwick, Openshaw) | 6 | £243,800 |
| M13 (Longsight, Ardwick) | 4 | £272,583 |
| M2 (Deansgate, St Ann's Square) | Under 1 | £343,015 |
Source: HM Land Registry Price Paid Data, residential sales July 2025 to June 2026. Contains HM Land Registry data © Crown copyright and database right 2021. This data is licensed under the Open Government Licence v3.0.
The busiest postcodes were not the cheapest. After M20's 58, the next busiest were M4 in the centre and M3, which is mostly in Salford, with 33 sales a month each. M11 (Openshaw, Clayton), the cheapest on asking price, had 10.
How Quickly Properties Sell in Manchester
On November 2026's pace of sales, M19 (Levenshulme, Burnage) had 4.2 months of homes for sale, the fewest in the table, and M1 (City Centre) had 50. Months of unsold stock measures how much is on the market, counted in months of sales at the current pace. It is not a time to sell.
| Area | Turnover | Months of Unsold Stock | Market |
|---|---|---|---|
| M19 (Levenshulme, Burnage) | 24% | 4.2 | Seller's market |
| M21 (Chorlton) | 22% | 4.5 | Seller's market |
| M23 (Wythenshawe) | 19% | 5.3 | Seller's market |
| M18 (Gorton, Abbey Hey) | 17% | 5.9 | Seller's market |
| M20 (Didsbury) | 17% | 5.9 | Seller's market |
| M22 (Wythenshawe, Northenden) | 17% | 5.9 | Seller's market |
| M6 (Irlams o' th' Height, Pendleton) | 16% | 6.3 | Balanced market |
| M8 (Crumpsall, Cheetham Hill) | 15% | 6.7 | Balanced market |
| M12 (Ardwick, Openshaw) | 13% | 7.7 | Balanced market |
| M40 (Moston, Collyhurst) | 13% | 7.7 | Balanced market |
| M13 (Longsight, Ardwick) | 12% | 8.3 | Balanced market |
| M9 (Blackley, Harpurhey) | 12% | 8.3 | Balanced market |
| M11 (Openshaw, Clayton) | 11% | 9.1 | Balanced market |
| M14 (Fallowfield, Rusholme) | 11% | 9.1 | Balanced market |
| M50 (Salford Quays) | 7% | 14.3 | Buyer's market |
| M16 (Old Trafford, Stretford) | 6% | 16.7 | Buyer's market |
| M4 (Ancoats, Northern Quarter) | 5% | 20.0 | Buyer's market |
| M15 (Hulme, Castlefield) | 3% | 33.3 | Buyer's market |
| M3 (Deansgate, Blackfriars) | 3% | 33.3 | Buyer's market |
| M5 (Salford, Ordsall) | 3% | 33.3 | Buyer's market |
| M1 (City Centre) | 2% | 50.0 | Buyer's market |
| M2 (Deansgate, St Ann's Square) | Not enough data | Not enough data | Not enough data |
Turnover is the average number of homes sold a month, over the last three months with final figures, as a share of the homes listed for sale in the postcode. On the figures collected in November 2026, M19's 24% means homes there were selling at a pace of about one in four of those listed each month, and M1's 2% means about one in fifty. It is measured against the homes listed, not against every home in the postcode, so it does not show how many homes sold, or how fast any one home would sell.
The Market column follows turnover. A seller's market is turnover of 17% or more, balanced is 9% to 16%, and a buyer's market is 8% or less. The six seller's markets, M19, M21, M23, M18, M20 and M22, were all outside the centre. The seven buyer's markets were the flat-heavy city postcodes M1, M4 and M15, the Salford or mostly Salford postcodes M3, M5 and M50, and M16 (Old Trafford, Stretford).
What Type of Property Can You Buy in Manchester?
Flats were 99.4% of the homes sold in M1 (City Centre) between July 2025 and June 2026, while in M40 (Moston, Collyhurst) semi-detached houses were the biggest group, at 47.8%. Each figure is that type's share of the homes sold in the postcode over the year, beside the number sold.
| Area | Detached | Semi-detached | Terraced | Flats | Homes Sold |
|---|---|---|---|---|---|
| M1 (City Centre) | 0.0% | 0.0% | 0.6% | 99.4% | 171 |
| M11 (Openshaw, Clayton) | 2.4% | 24.8% | 43.2% | 29.6% | 125 |
| M12 (Ardwick, Openshaw) | 7.9% | 30.3% | 53.9% | 7.9% | 76 |
| M13 (Longsight, Ardwick) | 0.0% | 21.2% | 57.7% | 21.2% | 52 |
| M14 (Fallowfield, Rusholme) | 1.0% | 26.2% | 56.0% | 16.8% | 191 |
| M15 (Hulme, Castlefield) | 0.8% | 1.2% | 5.8% | 92.2% | 243 |
| M16 (Old Trafford, Stretford) | 3.2% | 30.6% | 36.6% | 29.6% | 284 |
| M18 (Gorton, Abbey Hey) | 5.5% | 34.6% | 54.3% | 5.5% | 127 |
| M19 (Levenshulme, Burnage) | 2.1% | 41.6% | 48.3% | 7.9% | 329 |
| M2 (Deansgate, St Ann's Square) | Too few sales | Too few sales | Too few sales | Too few sales | 2 |
| M20 (Didsbury) | 5.7% | 35.0% | 22.2% | 37.1% | 698 |
| M21 (Chorlton) | 3.7% | 40.4% | 34.0% | 21.9% | 379 |
| M22 (Wythenshawe, Northenden) | 4.4% | 41.9% | 34.0% | 19.6% | 341 |
| M23 (Wythenshawe) | 13.4% | 37.3% | 33.2% | 16.1% | 292 |
| M3 (Deansgate, Blackfriars) | 0.0% | 0.8% | 4.3% | 95.0% | 400 |
| M4 (Ancoats, Northern Quarter) | 0.0% | 1.0% | 3.5% | 95.5% | 397 |
| M40 (Moston, Collyhurst) | 7.0% | 47.8% | 37.9% | 7.3% | 301 |
| M5 (Salford, Ordsall) | 0.0% | 7.1% | 16.7% | 76.2% | 269 |
| M50 (Salford Quays) | 0.0% | 0.0% | 1.6% | 98.4% | 125 |
| M6 (Irlams o' th' Height, Pendleton) | 5.6% | 37.3% | 41.5% | 15.6% | 359 |
| M8 (Crumpsall, Cheetham Hill) | 4.6% | 34.6% | 39.2% | 21.5% | 130 |
| M9 (Blackley, Harpurhey) | 8.8% | 45.0% | 35.4% | 10.8% | 240 |
Source: HM Land Registry Price Paid Data, residential sales July 2025 to June 2026. Contains HM Land Registry data © Crown copyright and database right 2021. This data is licensed under the Open Government Licence v3.0.
The table splits the city into three kinds of place. In the centre and on the Salford waterside, almost everything sold was a flat. In the inner east and south, terraced houses led. Further out, semis led, in M40, M9, M21, M22 and M23. M20 (Didsbury) had the most sales, 698, split mainly between flats and semis. M2 had two sales, too few to split by type.
Manchester Rental Market Analysis
Average advertised rents ran from £1,103 a month in M9 (Blackley, Harpurhey) to £2,236 in M14 (Fallowfield, Rusholme). Outside M14, the highest yields were around 7%, with M4 at 7.3% and M19 at 7.0%.
Average Rent & Gross Rental Yields in Manchester
Gross yields on buy-to-let in Manchester ran from 3.6% in M21 (Chorlton) to 11.1% in M14 (Fallowfield, Rusholme), with a mean of 6.2% across the 21 postcodes that have both a rent and an asking price. M2 has no rent figure.
| Area | Average Monthly Rent | Asking Price | Gross Yield |
|---|---|---|---|
| M14 (Fallowfield, Rusholme) | £2,236 | £241,504 | 11.1% |
| M4 (Ancoats, Northern Quarter) | £1,429 | £234,301 | 7.3% |
| M19 (Levenshulme, Burnage) | £1,733 | £296,875 | 7.0% |
| M5 (Salford, Ordsall) | £1,268 | £221,502 | 6.9% |
| M50 (Salford Quays) | £1,259 | £217,930 | 6.9% |
| M12 (Ardwick, Openshaw) | £1,366 | £243,800 | 6.7% |
| M15 (Hulme, Castlefield) | £1,513 | £272,753 | 6.7% |
| M11 (Openshaw, Clayton) | £1,154 | £209,698 | 6.6% |
| M18 (Gorton, Abbey Hey) | £1,198 | £228,287 | 6.3% |
| M3 (Deansgate, Blackfriars) | £1,368 | £260,494 | 6.3% |
| M9 (Blackley, Harpurhey) | £1,103 | £212,353 | 6.2% |
| M1 (City Centre) | £1,465 | £286,900 | 6.1% |
| M20 (Didsbury) | £1,835 | £359,895 | 6.1% |
| M40 (Moston, Collyhurst) | £1,200 | £246,187 | 5.9% |
| M8 (Crumpsall, Cheetham Hill) | £1,163 | £238,256 | 5.9% |
| M13 (Longsight, Ardwick) | £1,327 | £272,583 | 5.8% |
| M6 (Irlams o' th' Height, Pendleton) | £1,148 | £239,734 | 5.7% |
| M16 (Old Trafford, Stretford) | £1,205 | £264,505 | 5.5% |
| M22 (Wythenshawe, Northenden) | £1,193 | £268,540 | 5.3% |
| M23 (Wythenshawe) | £1,260 | £283,246 | 5.3% |
| M21 (Chorlton) | £1,189 | £401,785 | 3.6% |
| M2 (Deansgate, St Ann's Square) | Not enough data | £343,015 | Not enough data |
M14's yield was 7.2% in September 2026 and 11.1% in November 2026. Over those two months its average advertised rent rose from £1,526 to £2,236 a month, while its average asking price fell from £254,362 to £241,504. Homes advertised to let in M14 went from 573 in June 2026 to 1,286 in November 2026. Single rooms in shared houses were advertised at £146 a week for a double with a shared bathroom and £170 for an en-suite.
The timing fits the student year. Fallowfield is one of the University of Manchester's three residential campuses. Manchester Student Homes says the busiest house-hunting months are normally October to January, and July to August, and in October 2026 its accommodation fairs were already showing homes for the 2027/2028 academic year. When a shared house is let whole, one rent covers every room, so the likely reading is that more of those houses being advertised pushed the average rent up. The 11.1% yield sets those rents against the average asking price of every kind of home in M14.
Outside M14, the higher yields came about in two ways. In M4 (Ancoats, Northern Quarter), M11 and the Salford postcode M50 they came mainly from a low asking price: M4 had 7.3% on £234,301. In M19 (Levenshulme, Burnage) and M15 (Hulme, Castlefield) they came with higher rents, £1,733 and £1,513 a month, on asking prices above the £265,643 mean.
M21 (Chorlton) had the lowest yield, 3.6%. Its rent of £1,189 a month was among the lower rents in the table, while its £401,785 asking price was the highest.
Is Manchester Rent High?
Rents in Manchester took between 36.5% (M9) and 74.0% (M14) of the local median monthly salary. The median full-time salary for Manchester residents was £36,278 a year in 2025, about £3,023 a month. Data from the Nomis Labour Market Profile (ASHE 2025).
| Rank | Area | Rent as % of Income |
|---|---|---|
| 1 | M14 (Fallowfield, Rusholme) | 74.0% |
| 2 | M20 (Didsbury) | 60.7% |
| 3 | M19 (Levenshulme, Burnage) | 57.3% |
| 4 | M15 (Hulme, Castlefield) | 50.0% |
| 5 | M1 (City Centre) | 48.5% |
| 6 | M4 (Ancoats, Northern Quarter) | 47.3% |
| 7 | M3 (Deansgate, Blackfriars) | 45.3% |
| 8 | M12 (Ardwick, Openshaw) | 45.2% |
| 9 | M13 (Longsight, Ardwick) | 43.9% |
| 10 | M5 (Salford, Ordsall) | 42.0% |
| 11 | M23 (Wythenshawe) | 41.7% |
| 12 | M50 (Salford Quays) | 41.6% |
| 13 | M16 (Old Trafford, Stretford) | 39.9% |
| 14 | M40 (Moston, Collyhurst) | 39.7% |
| 15 | M18 (Gorton, Abbey Hey) | 39.6% |
| 16 | M22 (Wythenshawe, Northenden) | 39.4% |
| 17 | M21 (Chorlton) | 39.3% |
| 18 | M8 (Crumpsall, Cheetham Hill) | 38.5% |
| 19 | M11 (Openshaw, Clayton) | 38.2% |
| 20 | M6 (Irlams o' th' Height, Pendleton) | 38.0% |
| 21 | M9 (Blackley, Harpurhey) | 36.5% |
| - | M2 (Deansgate, St Ann's Square) | Not enough data |
Every postcode is measured against the same salary, so the share rises with the rent. After M14, the highest were M20 (Didsbury) at 60.7% and M19 at 57.3%, two of the dearest postcodes to rent in. M14's 74.0% sets the postcode's average advertised rent against one salary. That rent likely includes whole shared houses, so it does not describe what one tenant pays. The figures for M5, M6 and M50 use Manchester's salary, although those postcodes are in Salford.
How Big Is Manchester's Private Rented Sector?
At the 2021 Census, private renting inside Manchester was most common in the city centre, at 69.7% of households in M2 and 69.0% in M1, and least common in M23 (Wythenshawe), at 14.3%. M2 is tiny, with 133 households. M4 followed at 66.5%, and M3, which is mostly in Salford, at 64.7%.
| Area | Owned Outright | Owned with Mortgage | Private Rented | Social Rented |
|---|---|---|---|---|
| M50 (Salford Quays) | 6.0% | 10.2% | 78.4% | 5.3% |
| M2 (Deansgate, St Ann's Square) | 11.4% | 12.1% | 69.7% | 5.3% |
| M1 (City Centre) | 7.2% | 12.9% | 69.0% | 10.4% |
| M4 (Ancoats, Northern Quarter) | 5.0% | 16.5% | 66.5% | 11.3% |
| M3 (Deansgate, Blackfriars) | 7.2% | 12.8% | 64.7% | 14.9% |
| M15 (Hulme, Castlefield) | 6.6% | 12.3% | 48.3% | 32.2% |
| M14 (Fallowfield, Rusholme) | 12.1% | 12.7% | 46.3% | 28.0% |
| M5 (Salford, Ordsall) | 9.1% | 13.9% | 46.2% | 30.1% |
| M8 (Crumpsall, Cheetham Hill) | 19.5% | 19.4% | 35.8% | 24.1% |
| M13 (Longsight, Ardwick) | 12.6% | 17.3% | 35.2% | 34.3% |
| M20 (Didsbury) | 21.4% | 27.6% | 35.1% | 15.3% |
| M16 (Old Trafford, Stretford) | 20.0% | 20.9% | 32.1% | 26.2% |
| M18 (Gorton, Abbey Hey) | 15.3% | 18.4% | 30.2% | 34.3% |
| M12 (Ardwick, Openshaw) | 10.7% | 16.1% | 28.3% | 44.2% |
| M11 (Openshaw, Clayton) | 12.8% | 16.6% | 27.7% | 41.4% |
| M19 (Levenshulme, Burnage) | 22.2% | 29.2% | 26.4% | 20.9% |
| M6 (Irlams o' th' Height, Pendleton) | 20.6% | 22.1% | 25.7% | 30.4% |
| M21 (Chorlton) | 25.7% | 31.1% | 25.1% | 17.5% |
| M9 (Blackley, Harpurhey) | 17.7% | 20.6% | 23.2% | 37.2% |
| M40 (Moston, Collyhurst) | 19.7% | 21.0% | 19.6% | 38.8% |
| M22 (Wythenshawe, Northenden) | 17.6% | 21.1% | 16.2% | 43.8% |
| M23 (Wythenshawe) | 19.0% | 25.0% | 14.3% | 40.4% |
Household tenure at Census 2021. Source: Office for National Statistics licensed under the Open Government Licence v.3.0. Contains OS data © Crown copyright and database right 2026. Contains Royal Mail data © Royal Mail copyright and database right 2026. Shared-ownership and rent-free households are not shown.
The highest share in the table is in Salford, where 78.4% of households in M50 (Salford Quays) rented privately. In Wythenshawe (M22 and M23) and the inner east (M11 and M12), more than 40% of households rented from a council or housing association. In M11, M12 and M22 that was more than the share who owned their home.
Local Housing Allowance Rates in Manchester
The two-bedroom Local Housing Allowance rate for 2026-27 was £201.37 a week, about £873 a month, in the Central Greater Manchester area, which takes in 20 of this guide's 22 postcodes. In M22 and M23, in the Southern Greater Manchester area, it was £172.60, about £748. Rates are set area by area, and the table names each area and the postcodes in it.
| BRMA | Postcodes | Shared | 1 bed | 2 bed | 3 bed | 4 bed |
|---|---|---|---|---|---|---|
| Central Greater Manchester BRMA | M1, M2, M3, M4, M5, M6, M8, M9, M11, M12, M13, M14, M15, M16, M18, M19, M20, M21, M40, M50 | £94.72/wk (£410/mo) | £178.36/wk (£773/mo) | £201.37/wk (£873/mo) | £218.63/wk (£947/mo) | £310.68/wk (£1,346/mo) |
| Southern Greater Manchester BRMA | M22, M23 | £94.72/wk (£410/mo) | £143.84/wk (£623/mo) | £172.60/wk (£748/mo) | £207.12/wk (£898/mo) | £322.19/wk (£1,396/mo) |
The government uses these rates to work out Housing Benefit for people renting from private landlords, as its Local Housing Allowance guidance explains. Under Universal Credit, the housing amount will not always cover the rent, and the rest comes from the tenant's Universal Credit payment or other income, according to GOV.UK.
The Valuation Office Agency's Local Housing Allowance lookup gives the rate for any postcode. The rents elsewhere in this guide cover homes of every size, so they cannot be set against a rate for one size of home.
Buy-to-Let Considerations
Are House Prices High in Manchester? Price-to-Earnings Ratios
Buying in Manchester took between 5.8 and 11.1 times the median annual salary, using each postcode's average asking price. The salary is Manchester's median full-time salary, £36,278, from the Nomis Labour Market Profile for Manchester.
For comparison, England's average sold price of £292,998 divided by Great Britain's median salary of £39,126 gives 7.5x. Fourteen of the 22 postcodes had a price-to-earnings ratio below that 7.5x benchmark, and two more, M13 and M15, matched it.
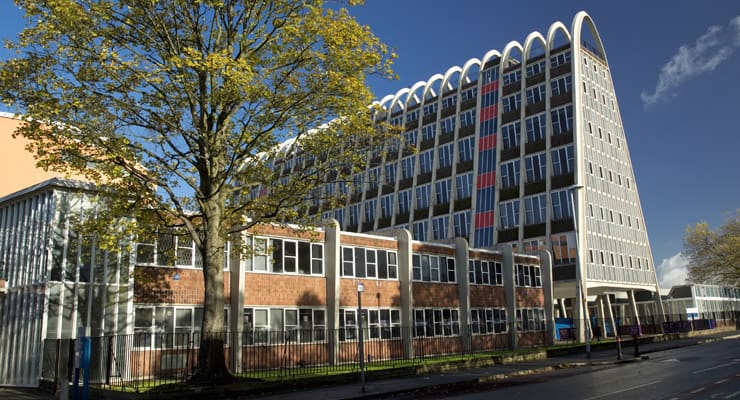
| Rank | Area | Price-to-Earnings Ratio |
|---|---|---|
| 1 | M11 (Openshaw, Clayton) | 5.8x |
| 2 | M9 (Blackley, Harpurhey) | 5.9x |
| 3 | M50 (Salford Quays) | 6.0x |
| 4 | M5 (Salford, Ordsall) | 6.1x |
| 5 | M18 (Gorton, Abbey Hey) | 6.3x |
| 6 | M4 (Ancoats, Northern Quarter) | 6.5x |
| 7 | M8 (Crumpsall, Cheetham Hill) | 6.6x |
| 8 | M6 (Irlams o' th' Height, Pendleton) | 6.6x |
| 9 | M14 (Fallowfield, Rusholme) | 6.7x |
| 10 | M12 (Ardwick, Openshaw) | 6.7x |
| 11 | M40 (Moston, Collyhurst) | 6.8x |
| 12 | M3 (Deansgate, Blackfriars) | 7.2x |
| 13 | M16 (Old Trafford, Stretford) | 7.3x |
| 14 | M22 (Wythenshawe, Northenden) | 7.4x |
| 15 | M13 (Longsight, Ardwick) | 7.5x |
| 16 | M15 (Hulme, Castlefield) | 7.5x |
| 17 | M23 (Wythenshawe) | 7.8x |
| 18 | M1 (City Centre) | 7.9x |
| 19 | M19 (Levenshulme, Burnage) | 8.2x |
| 20 | M2 (Deansgate, St Ann's Square) | 9.5x |
| 21 | M20 (Didsbury) | 9.9x |
| 22 | M21 (Chorlton) | 11.1x |
The lowest ratios were in the north and east, with M11 at 5.8x and M9 at 5.9x. The highest were in the southern suburbs, with M21 (Chorlton) at 11.1 times the salary and M20 (Didsbury) at 9.9x. The ratios for M5, M6 and M50 use Manchester's salary, although those postcodes are in Salford.
Deposit Requirements in Manchester
A 30% deposit on a buy-to-let home in Manchester ran from £62,909 in M11 (Openshaw, Clayton) to £120,535 in M21 (Chorlton), using each postcode's average asking price. Stamp duty and the other costs of buy-to-let come on top, and our stamp duty calculator works out the tax. For a first purchase that is meant to grow into several, our guide on how to start a property portfolio covers the money needed.
| Rank | Area | 30% Deposit Required |
|---|---|---|
| 1 | M11 (Openshaw, Clayton) | £62,909 |
| 2 | M9 (Blackley, Harpurhey) | £63,706 |
| 3 | M50 (Salford Quays) | £65,379 |
| 4 | M5 (Salford, Ordsall) | £66,450 |
| 5 | M18 (Gorton, Abbey Hey) | £68,486 |
| 6 | M4 (Ancoats, Northern Quarter) | £70,290 |
| 7 | M8 (Crumpsall, Cheetham Hill) | £71,477 |
| 8 | M6 (Irlams o' th' Height, Pendleton) | £71,920 |
| 9 | M14 (Fallowfield, Rusholme) | £72,451 |
| 10 | M12 (Ardwick, Openshaw) | £73,140 |
| 11 | M40 (Moston, Collyhurst) | £73,856 |
| 12 | M3 (Deansgate, Blackfriars) | £78,148 |
| 13 | M16 (Old Trafford, Stretford) | £79,351 |
| 14 | M22 (Wythenshawe, Northenden) | £80,562 |
| 15 | M13 (Longsight, Ardwick) | £81,775 |
| 16 | M15 (Hulme, Castlefield) | £81,826 |
| 17 | M23 (Wythenshawe) | £84,974 |
| 18 | M1 (City Centre) | £86,070 |
| 19 | M19 (Levenshulme, Burnage) | £89,063 |
| 20 | M2 (Deansgate, St Ann's Square) | £102,905 |
| 21 | M20 (Didsbury) | £107,969 |
| 22 | M21 (Chorlton) | £120,535 |
Eleven postcodes had a 30% deposit below £75,000. Three of those, M50, M5 and M6, are in Salford, and the other eight are in the city, from M4 in the centre to M9 and M40 in the north. The three dearest, M2, M20 and M21, each needed more than £100,000.
What the Manchester Data Tells Buy-to-Let Investors
Put the tables side by side and Manchester splits into three markets, starting with a flat-led centre where yields ran from 6.1% to 7.3%. In M1, M4 and M15, and M3, which is mostly in Salford, flats were nearly every home sold, the homes for sale would take 20 to 50 months to clear at November's pace, and around half or more of households rented privately in 2021. Prices there fell over five years, except in M3, which rose.
The second market is the cheaper house postcodes of the north and east, such as M8, M18, M9, M11, M12 and M40. They had the six lowest prices per square foot, on yields of 5.9% to 6.7%, and M18, M9 and M12 had the three biggest five-year rises.
The third is the southern suburbs, M20 to M23. All four were seller's markets in November 2026, and they had three of the lowest yields in the city: M21 at 3.6%, and M22 and M23 at 5.3%. M14 sits apart from all three, its 11.1% recorded in the student house-hunting months.
Manchester has an Article 4 Direction. Under it, turning a family home into a shared house for three to six unrelated people needs planning permission. The council says it is unlikely to allow one where there are a lot of shared houses nearby. Selective licensing applies in named small areas in ten parts of the city, among them Cheetham, Crumpsall, Harpurhey, Longsight and Moss Side. Privately rented homes in those areas need a licence unless the tenancy is one of the council's exempt types. Each area's designation lasts five years, according to the council's selective licensing background. Our guides to HMO licensing and investing in HMOs explain how shared houses are licensed and run.
How Manchester Compares
Manchester's mean asking price was £265,643 across the 22 postcodes, with a mean rent of £1,363 a month and a mean gross yield of 6.2%. The mean yield uses the 21 postcodes with both a rent and an asking price, as M2 has no rent figure. The four neighbours below are Greater Manchester boroughs with their own guides, and the table is sorted by mean asking price, from low to high.
| Location | Mean Asking Price | Mean Monthly Rent | Mean Gross Yield | Top Yield (postcode) |
|---|---|---|---|---|
| Salford | £248,569 | £1,186 | 5.7% | 6.9% (M17, M5, M50) |
| Bolton | £254,164 | £978 | 4.6% | 6.3% (M38) |
| Manchester | £265,643 | £1,363 | 6.2% (21 of 22 postcodes) | 11.1% (M14) |
| Bury | £280,695 | £1,034 | 4.4% | 5.3% (M24) |
| Stockport | £379,299 | £1,339 | 4.2% | 7.0% (M19) |
Salford and Bolton had lower average asking prices, at £248,569 and £254,164. Bury, at £280,695, and Stockport, at £379,299, were dearer.
Manchester's lead on rent rests on M14. Manchester's mean rent of £1,363 a month was the highest of the five, but the other 20 postcodes with a rent average £1,319, below Stockport's £1,339. Manchester still leads on yield without M14, at about 6.0% on those 20 postcodes' average rent and average asking price, against Salford's 5.7%. Bolton's yields averaged 4.6%, on the lowest mean rent in the table, £978.
On top yield the comparison is closer than 11.1% suggests. Manchester's second-highest postcode, M4 at 7.3%, was still above every neighbour's top figure. Stockport's top yield, 7.0% in M19, comes from a postcode it shares with Manchester, which appears in this guide's tables at the same figure. Two of Salford's top postcodes, M5 and M50, are in this guide's tables too. For places further away, our ranking of the best places to invest in property in the UK sets out the same figures.
Frequently Asked Questions
Is Manchester a Good Place to Invest in Property?
More people lived in Manchester at the last census than ten years before, up 9.7% to 551,938, against 6.6% growth for England. In the year to June 2026, 75.7% of residents aged 16 to 64 were in work, close to the Great Britain rate.
Property investment in Manchester covers quite different markets within a few miles, from flats in the centre to family houses in the suburbs, so the postcode figures say more than the city average. None of them shows what one property earns after its mortgage, letting fees, repairs and empty months.
What are the best areas for buy-to-let in Manchester?
If income is the priority, the highest yield outside M14 was M4 (Ancoats, Northern Quarter), at 7.3%, then M19 (Levenshulme, Burnage) at 7.0%. M14's 11.1% was recorded in November 2026, in the student house-hunting months.
If five-year growth is the priority, M18 (Gorton, Abbey Hey) led at 45.4%, ahead of M9 (Blackley, Harpurhey) at 40.2%. No postcode led on both.
What is a good rental yield in Manchester?
Across the postcodes with a rent figure, the mean gross yield was 6.2% in November 2026. It is a year's advertised rent divided by the postcode's average asking price, so it is a before-costs figure for an average home, not for any one property.
How do houses and flats differ for buy-to-let in Manchester?
Flats and houses moved in opposite directions over five years. Of the five postcodes where flats were more than nine in ten sales, four had lower prices than five years earlier, while M3, which is mostly in Salford, rose 16.6%. The house postcodes of the north and east all grew.
On yield the gap is small. The flat postcodes ran from 6.1% in M1 to 7.3% in M4, and the house postcodes of the north and east from 5.9% to 6.7%.
How do I buy a buy-to-let property in Manchester?
A 30% deposit runs from £62,909 in M11 (Openshaw, Clayton) to £120,535 in M21 (Chorlton). Income and growth point to different postcodes here: M14 has the highest yield, 11.1% in November 2026, with M4 next at 7.3%, while M18 has grown fastest, at 45.4% over five years.
Some homes sell before they are advertised publicly. Our guide to off-market property explains how that works, and our below market value listings show the homes currently on offer. Current homes for sale are listed on our investment property and buy-to-let property for sale pages.
What are the up-and-coming areas in Manchester?
The postcodes with the biggest five-year rises to November 2026 were M18 (Gorton, Abbey Hey) at 45.4%, M9 (Blackley, Harpurhey) at 40.2% and M12 (Ardwick, Openshaw) at 36.1%, all in the north and east of the city.
The biggest scheme on the way is Victoria North, planned to bring 15,000 homes north-east of the city centre. What it will do to prices is not something past figures can show.
Are Manchester house prices high compared to the national average?
Manchester's average sold price was £254,604 in September 2026, 13.1% below England's £292,998. Against local pay, fourteen of the 22 postcodes had a price-to-earnings ratio below 7.5x, the figure for England's average price against Great Britain's median salary, and two more matched it. The highest was M21 (Chorlton), at 11.1 times the local salary.
By type, semi-detached houses in Manchester sold for 14.0% more than England's semis in September 2026, while flats sold for 8.7% less.
Is Manchester buy-to-let still profitable?
On gross yield, the postcodes in this guide ranged from 3.6% in M21 to 11.1% in M14 in November 2026. Whether a buy-to-let purchase in Manchester makes money depends on that home's own rent, price and costs, which no postcode average measures.
Our guide on whether buy-to-let is worth it sets out those costs.
What is buy-to-let like in Manchester city centre?
Manchester city centre is a flat market. In M1 (City Centre) and M4 (Ancoats, Northern Quarter), flats were more than nine in ten of the homes sold between July 2025 and June 2026, and about two-thirds of households rented privately in 2021.
Yields ranged from 6.1% in M1 to 7.3% in M4 in November 2026. Prices fell over five years, by 6.2% in M1 and 12.9% in M4, while M3 (Deansgate, Blackfriars), most of which is in Salford, rose 16.6%. M2 has no growth or yield figure.
Ready to buy property?
Browse investment properties with prices and gross yields shown for each opportunity.
See the latest deals