Top 20 Cheapest Places To Buy A House In England (2025 Edition)
Our latest analysis reveals Sunderland (SR1) as England's most affordable property location in 2025, with average asking prices of £58,259 - making it 80% below the current UK sold average of £292,924. Using the latest HM Land Registry sold house prices and looking at asking prices from estate agents and property portals.
We've identified England's 20 most affordable locations where buyers can find exceptional value, with eight areas showing average property prices under £100,000.
While England remains the UK's most expensive country for property in the UK, with an average house price of £306,494, significant opportunities exist in specific postcodes. The North East emerges as the primary region for affordable housing, with Sunderland, Bradford, and Shildon leading our rankings.
Our research combines current property asking prices, historical price trends since 2019, and local household incomes to provide a comprehensive view of England's most affordable property markets. This analysis reveals not just the cheapest locations, but importantly, identifies areas with growing (or declining) house price values.
Through detailed examination of property prices, market activity, and affordability metrics across England, we've identified and analysed the 20 most affordable places to buy a home in 2025.
For those interested in cheap areas in the major cities, here is our guides on the cheapest places to live in Manchester, the most affordable postcodes in Birmingham, the lowest house prices in London and even Wales.
Data last updated: February 2025
England's Most Affordable Property Markets 2025
The cheapest places to buy a house in England show average asking prices from £58,259 to £125,500. Leading locations include Sunderland (SR1) at £58,259, Bradford (BD1) at £69,903, and Shildon (DL4) at £77,028. Eight areas offer average prices under £100,000, with household incomes ranging from £26,300 to £30,300. The North East emerges as England's most affordable region, with average sold property prices at £168,791, 44.92% below the national average of £306,494.
Contents
- Top 20 table of cheapest priced towns & cities in England
- Understanding house price to income ratios
- Cheapest priced areas in England under £70,000
- Low price areas in England £70,000 - £95,000
- Low price areas in England £95,000 - £115,000
- Low price areas in England £115,000 - £125,000
- Affordable areas in England £125,000+
- Conclusion

-
by Robert Jones, Founder of Property Investments UK
With two decades in UK property, Rob has been investing in buy-to-let since 2005, and uses property data to develop tools for property market analysis.
Property Data Sources
Our location guide relies on diverse, authoritative datasets including:
- HM Land Registry UK House Price Index
- Ministry of Housing, Communities and Local Government
- Ordnance Survey Data Hub
- Propertydata.co.uk
We update our property data quarterly to ensure accuracy. Last update: February 2025. Next update: July 2025. All data is presented as provided by our sources without adjustments or amendments.
Cheapest Priced Areas Under £70,000
| Rank | Area | Average Asking Price | Price Trend |
|---|---|---|---|
| 1 | SR1 (Sunderland) | £58,259 | ↓ Declining |
| 2 | BD1 (Bradford) | £69,903 | ↑ Rising |
Low Price Areas £70,000 - £95,000
| Rank | Area | Average Asking Price | Price Trend |
|---|---|---|---|
| 3 | DL4 (Shildon) | £77,028 | → Stable |
| 4 | DN31 (Grimsby) | £80,096 | ↑ Rising |
| 5 | TS1 (Middlesbrough) | £90,777 | ↑ Rising |
| 6 | TS3 (Middlesbrough) | £94,822 | ↑ Rising |
| 7 | HU2 (Hull) | £95,217 | → Stable |
Low Price Areas At £95,000 - £115,000
| Rank | Area | Average Asking Price | Price Trend |
|---|---|---|---|
| 8 | SR8 (Peterlee) | £101,394 | ↑ Rising |
| 9 | DN32 (Grimsby) | £112,579 | → Stable |
| 10 | SR5 (Sunderland) | £113,545 | ↓ Declining |
Low Price Areas At £115,000 - £125,000
| Rank | Area | Average Asking Price | Price Trend |
|---|---|---|---|
| 11 | FY1 (Blackpool) | £114,923 | ↑ Rising |
| 12 | S4 (Sheffield) | £116,250 | ↑ Rising |
| 13 | L20 (Liverpool) | £121,365 | → Stable |
| 14 | NE33 (South Shields) | £121,987 | ↓ Sharp Drop |
| 15 | HU3 (Hull) | £122,838 | → Stable |
Affordable Areas £125,000+
| Rank | Area | Average Asking Price | Price Trend |
|---|---|---|---|
| 16 | DN1 (Doncaster) | £123,858 | ↑ Rising |
| 17 | S3 (Sheffield) | £124,009 | ↓ Declining |
| 18 | TS24 (Hartlepool) | £124,500 | ↑ Sharp Rise |
| 19 | BD3 (Bradford) | £125,000 | ↑ Rising |
| 20 | L4 (Liverpool) | £125,500 | ↑ Steady Rise |
Understanding House Price to Income Ratios
The house price to earnings ratio (also called the affordability ratio) shows how many years of income it would take to buy a property outright.
For example, if a house costs £60,000 and the average household income is £30,000, the affordability ratio would be 2.0 - meaning it would take 2 years of total income to buy the property.
This ratio is equally important for homeowners as it is for landlords purchasing investment property that have local tenant demand and affordable rents, it is a key part of a landlords property investment checklist.
So if you are new to property and researching an area or starting your property training, consider affordability ratios as a key part of your research.
A lower ratio indicates better affordability:
- Ratio under 3.0: Considered very affordable
- Ratio 3.0-4.0: Moderately affordable
- Ratio over 4.0: Less affordable
- UK Average: 7.1 (2025)
Our analysis shows dramatic variations across England, from highly affordable ratios of 1.92 in Sunderland (SR1) to the national average of 7.1. This means buying a property in Sunderland could take 5 fewer years of income compared to the average English location.
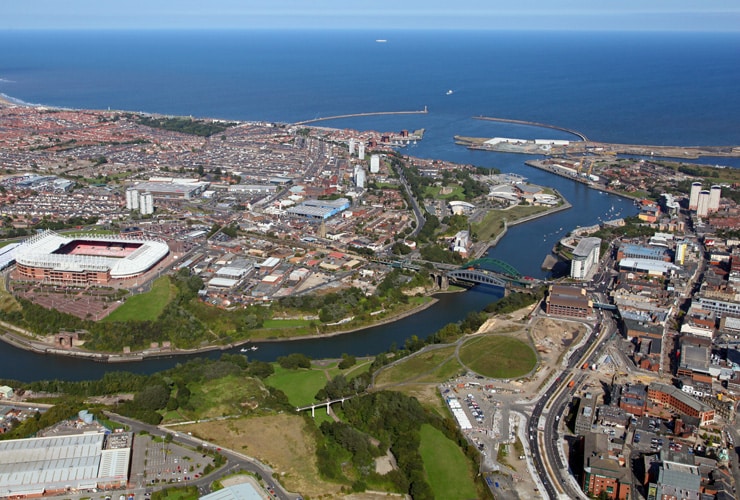
Cheapest Priced Areas in England Under £70,000
1. SR1 - Sunderland City Centre
Sunderland city centre ranks as England's cheapest priced area in 2025, with average asking prices of £58,259. This represents exceptional value at 81% below England's average house price of £306,494. Historical price analysis shows a significant decline from mid-2023 peaks of £85,000, presenting potential opportunities in the current market.
Property Price Metrics in SR1
- Average Asking Price: £58,259
- Average Household Income: £30,300
- Affordability Ratio: 1.92
- Price Trend: Declining from 2023 peak
2. BD1 - Bradford City Centre
Bradford city centre emerges as England's second cheapest location for property buyers, with current asking prices at £69,903. Price analysis shows consistent growth from early 2021 levels of £50,000, though properties remain highly affordable at 77% below the England average.
Property Price Metrics in BD1
- Average Asking Price: £69,903
- Average Household Income: £26,300
- Affordability Ratio: 2.66
- Price Trend: Steady growth since 2021
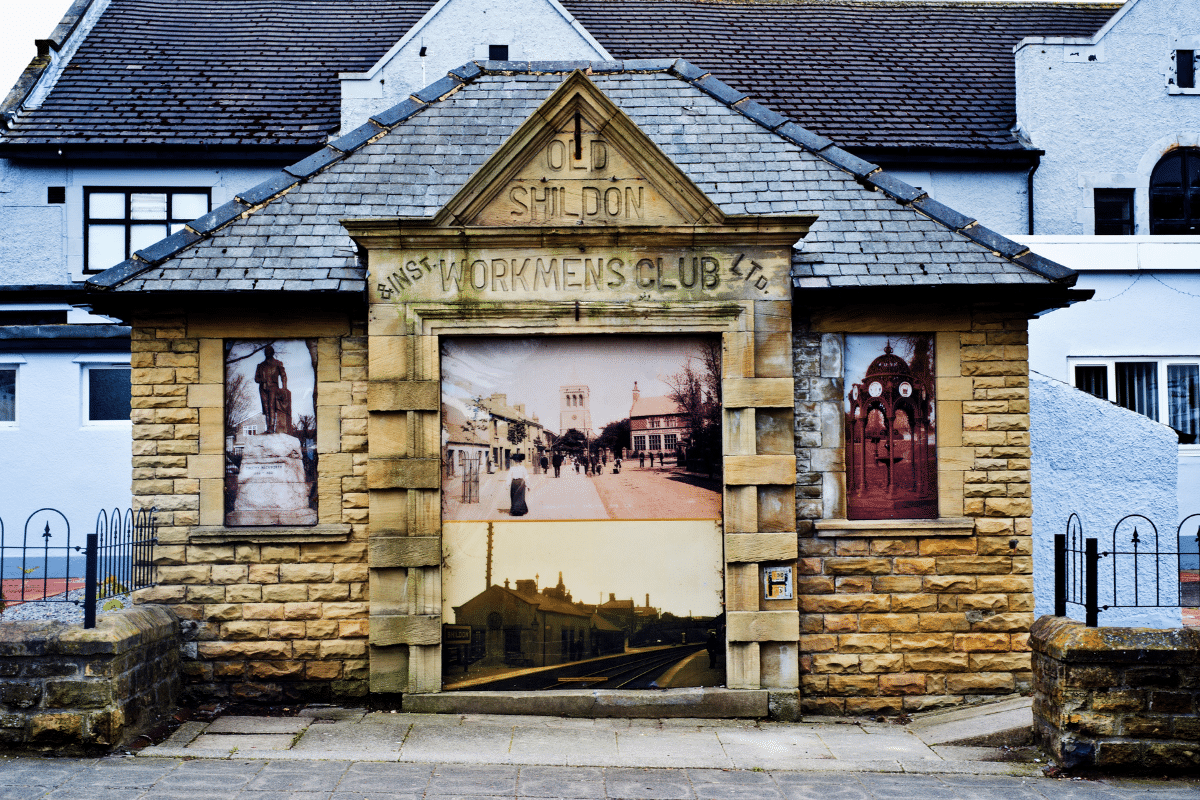
Low Price Areas in England £70,000 - £95,000
3. DL4 - Shildon
Shildon shows remarkable price stability with average asking prices of £77,028, sitting 75% below England's average. Historical pricing data reveals consistent values between £70,000-£80,000 since 2019, with occasional peaks to £90,000, indicating a stable market for buyers.
Property Price Metrics in DL4
- Average Asking Price: £77,028
- Average Household Income: £30,200
- Affordability Ratio: 2.55
- Price Trend: Stable since 2019
4. DN31 - Grimsby
Grimsby's DN31 postcode demonstrates steady growth with current asking prices at £80,096. Analysis shows a gradual upward trend from £65,000 in 2019, suggesting sustainable market appreciation while maintaining affordability at 74% below England's average.
Property Price Metrics in DN31
- Average Asking Price: £80,096
- Average Household Income: £26,700
- Affordability Ratio: 3.00
- Price Trend: Rising steadily
5. TS1 - Middlesbrough
Central Middlesbrough prices have shown significant appreciation, reaching £90,777. The area has seen consistent growth from £55,000 in 2020, nearly doubling in value while still remaining 70% below the national average.
Property Price Metrics in TS1
- Average Asking Price: £90,777
- Average Household Income: £27,100
- Affordability Ratio: 3.35
- Price Trend: Strong upward trend
6. TS3 - Middlesbrough
Middlesbrough's TS3 postcode shows consistent growth with average asking prices reaching £94,822. The area has seen steady appreciation since 2019, with prices rising from around £70,000 to current levels while remaining 69% below England's average house price.
Property Price Metrics in TS3
- Average Asking Price: £94,822
- Average Household Income: £28,600
- Affordability Ratio: 3.31
- Price Trend: Steady upward trend
7. HU2 - Hull
Hull's HU2 postcode demonstrates price stability at £95,217. Despite some volatility in early 2020, prices have stabilized around the £95,000 mark since 2021, making it an area with predictable values for buyers while remaining 69% below national averages.
Property Price Metrics in HU2
- Average Asking Price: £95,217
- Average Household Income: £29,100
- Affordability Ratio: 3.27
- Price Trend: Stable since 2021
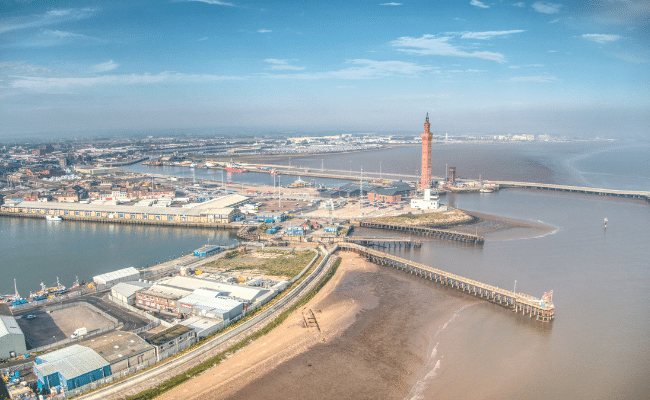
Low Price Areas in England £95,000 - £115,000
8. SR8 - Peterlee
Peterlee's market has shown strong growth momentum, with average asking prices now at £101,394. Analysis reveals a clear upward trajectory since 2019, with prices rising from around £70,000 to current levels. Despite this growth, properties remain 67% below England's average house price.
Property Price Metrics in SR8
- Average Asking Price: £101,394
- Average Household Income: £32,100
- Affordability Ratio: 3.16
- Price Trend: Strong upward trend
9. DN32 - Grimsby
Grimsby's DN32 postcode maintains steady pricing at £112,579. The area has shown resilience with prices stabilizing after volatility in 2019-2020, making it an area of consistent value while remaining 63% below national averages.
Property Price Metrics in DN32
- Average Asking Price: £112,579
- Average Household Income: £29,400
- Affordability Ratio: 3.83
- Price Trend: Stable with moderate fluctuations
10. SR5 - Sunderland
Sunderland's SR5 area has seen recent price adjustments, with current asking prices at £113,545. The area shows a clear upward trend since 2019 from £80,000, though recent months indicate a price correction from 2024 peaks of £125,000.
Property Price Metrics in SR5
- Average Asking Price: £113,545
- Average Household Income: £29,600
- Affordability Ratio: 3.84
- Price Trend: Recent decline from peaks

Low Price Areas in England £115,000 - £125,000
11. FY1 - Blackpool
Blackpool's FY1 postcode demonstrates consistent asking house price appreciation, with average asking prices reaching £114,923. The area shows steady growth from £85,000 in 2019, with particularly strong performance since 2022, while still remaining 62% below England's average house price.
Property Price Metrics in FY1
- Average Asking Price: £114,923
- Average Household Income: £29,200
- Affordability Ratio: 3.93
- Price Trend: Steady upward growth
12. S4 - Sheffield
Sheffield's S4 postcode district has shown resilient price growth, reaching £116,250. Despite some volatility in 2020, the area has maintained an upward trajectory from £80,000 in 2019, suggesting sustained market confidence while remaining 62% below national averages.
Property Price Metrics in S4
- Average Asking Price: £116,250
- Average Household Income: £30,500
- Affordability Ratio: 3.81
- Price Trend: Upward with periodic fluctuations
13. L20 - Liverpool
Liverpool's L20 area shows strong market performance at £121,365. Price trends reveal substantial growth from £80,000 in 2019, with particularly strong appreciation through 2022-2024, while maintaining 60% below England's average prices.
Property Price Metrics in L20
- Average Asking Price: £121,365
- Average Household Income: £31,700
- Affordability Ratio: 3.83
- Price Trend: Strong sustained growth
14. NE33 - South Shields
South Shields (near Newcastle) shows recent market adjustments with current prices at £121,987. While showing overall growth since 2019, recent months indicate a sharp decline from late 2024 peaks of £140,000, potentially presenting new opportunities for buyers.
Property Price Metrics in NE33
- Average Asking Price: £121,987
- Average Household Income: £32,400
- Affordability Ratio: 3.77
- Price Trend: Recent sharp decline
15. HU3 - Hull
Hull's HU3 postcode demonstrates stable pricing at £122,838. The area has seen gradual appreciation from £70,000 in 2019, with prices stabilising around current levels through 2024, while remaining 60% below national averages.
Property Price Metrics in HU3
- Average Asking Price: £122,838
- Average Household Income: £30,900
- Affordability Ratio: 3.98
- Price Trend: Stable at current levels
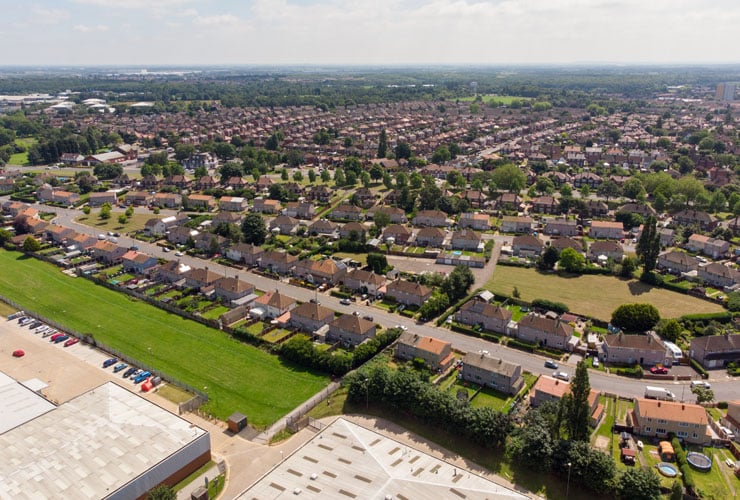
Affordable Areas in England £125,000+
16. DN1 - Doncaster
Doncaster's city centre demonstrates market volatility with current prices at £123,858. The area has experienced significant price fluctuations since 2019, ranging from £100,000 to peaks of £155,000, before settling at current levels which remain 60% below England's average house price.
Property Price Metrics in DN1
- Average Asking Price: £123,858
- Average Household Income: £31,500
- Affordability Ratio: 3.93
- Price Trend: Volatile with recent stabilization
17. S3 - Sheffield
Sheffield's S3 postcode shows cyclical pricing patterns at £124,009. While maintaining an overall upward trend since 2019's £110,000 level, the area experiences regular price adjustments, suggesting opportunities for timing purchases while staying 60% below national averages.
Property Price Metrics in S3
- Average Asking Price: £124,009
- Average Household Income: £36,400
- Affordability Ratio: 3.41
- Price Trend: Cyclical with recent decline
18. TS24 - Hartlepool
Hartlepool's market shows strong recent growth with prices reaching £124,500. The area has seen substantial appreciation from 2019's £80,000 level, with particularly sharp gains in late 2024, indicating increasing market confidence.
Property Price Metrics in TS24
- Average Asking Price: £124,500
- Average Household Income: £31,200
- Affordability Ratio: 3.99
- Price Trend: Sharp recent gains
19. BD3 - Bradford
Bradford's BD3 area demonstrates sustained growth reaching £125,000. Price trends show consistent appreciation from £80,000 in 2019, with recent volatility suggesting a maturing market while maintaining 59% below England's average prices.
Property Price Metrics in BD3
- Average Asking Price: £125,000
- Average Household Income: £28,200
- Affordability Ratio: 4.43
- Price Trend: Sustained growth with recent volatility
20. L4 - Liverpool
Liverpool's L4 district shows consistent appreciation with prices at £125,500. The area displays one of the most stable growth patterns, rising steadily from £80,000 in 2019 to current levels, suggesting reliable market fundamentals.
Property Price Metrics in L4
- Average Asking Price: £125,500
- Average Household Income: £31,400
- Affordability Ratio: 4.00
- Price Trend: Steady consistent growth
Conclusion
Our analysis of England's most affordable property locations in 2025 reveals several key insights:
The North East emerges as England's primary region for affordable housing, with locations such as Sunderland (SR1) leading at £58,259, followed by Bradford (BD1) at £69,903. These prices represent exceptional value at 81% and 77% below England's average house price of £306,494 respectively.
Key findings from our research show:
- Eight areas offer average asking prices under £100,000
- Affordability ratios range from 1.92 to 4.43 across the top 20 locations
- Most affordable areas maintain prices 60-80% below national averages
For those seeking affordable property in England, these locations offer genuine opportunities for both homebuyers and investors, with prices significantly below national averages while maintaining reasonable affordability ratios against local incomes.
