Where to Buy Property Investments in Cardiff: Yields of 7.3%
Cardiff is a city in South Wales and the capital of Wales. Gross rental yields range from 3.1% to 7.3% across all 8 postcodes, with CF10 and CF24 both delivering the highest returns. Average sold prices sit 7.1% below the England average, and the city's population grew 4.7% to 362,308 between the 2011 and 2021 censuses.
Cardiff's average sold price of £271,273 places the Welsh capital roughly level with the UK average (£270,259) while sitting 26.2% above the Wales average of £214,883. That positioning matters. Investors based in England are buying into a capital city market at a 7.1% discount to the English average. Investors comparing within Wales are paying the capital premium. Asking prices start from £187,680 in CF10, and rental data is available for all 8 of the city's postcodes.
This guide covers all 8 Cardiff postcodes under the Cardiff unitary authority (ONS code W06000015). Cardiff sits on the Severn Estuary coast of South Wales and is the country's political, economic, and cultural capital. Investors comparing options in the region may also consider Swansea, Newport, or Bristol across the border. Browse all our Wales location guides.
Article updated: April 2026
Cardiff Buy-to-Let Market Overview 2026
Cardiff offers two postcodes at 7.3% gross yield with entry prices from £187,680, backed by a capital city economy, three universities, and a £250m arena-led regeneration programme in Cardiff Bay.
- Average sold price: £271,273 (7.1% below England's £291,865)
- Asking price range: £187,680 (CF10) to £421,036 (CF15)
- Rental yields: 3.1% (CF15) to 7.3% (CF10 and CF24) across all 8 postcodes
- Rental income: Monthly rents from £1,104 (CF15) to £1,498 (CF24)
- Price per sq ft: Sold prices from £252/sq ft (CF10) to £339/sq ft (CF14)
- Market activity: Sales ranging from 19 per month (CF10, CF15) to 65 per month (CF14)
- Deposit requirements: 30% deposits range from £56,304 (CF10) to £126,311 (CF15)
- Affordability ratios: Property prices from 5.1 to 11.4 times Cardiff's median annual salary of £36,946
Contents

-
by Robert Jones, Founder of Property Investments UK
With two decades in UK property, Rob has been investing in buy-to-let since 2005, and uses property data to develop tools for property market analysis.

Property Data Sources
Our location guide relies on diverse, authoritative datasets including:
- HM Land Registry UK House Price Index
- Ministry of Housing, Communities and Local Government
- Ordnance Survey Data Hub
- Propertydata.co.uk
We update our property data quarterly to ensure accuracy. Last update: April 2026. All data is presented as provided by our sources without adjustments or amendments.
Why Invest in Cardiff?
Cardiff is the capital of Wales, its largest city, and the base for three universities with a combined student population of around 50,000. That status brings the Welsh Government, the Senedd, and the BBC's Welsh headquarters, all of which create public sector employment that does not disappear in a downturn. The city is also the commercial centre of the Cardiff Capital Region, a £1.2 billion City Deal covering ten local authorities across South East Wales.
Three universities generate consistent rental demand across the city. Cardiff University has around 33,000 students, Cardiff Metropolitan University around 11,000, and the University of South Wales operates a Cardiff campus. That combined student population creates a deep tenant pool in postcodes like CF24 (Cathays, the traditional student quarter) and CF10 (city centre). CF24 already commands Cardiff's highest average rent at £1,498 per month.
Between the 2011 and 2021 censuses, Cardiff's population grew from 346,090 to 362,308, a rise of 4.7%. That is above the Wales average and reflects the city's pull as the country's primary employment centre. The NHS in Wales employs heavily in Cardiff through the University Hospital of Wales and other health board facilities, adding another layer of public sector demand.
Earnings in Cardiff sit above the Welsh regional average but below the Great Britain figure. The median annual salary is £36,946, compared to £36,354 across Wales and £39,125 for Great Britain. Higher local wages than the Welsh average, combined with a sold price 26.2% above the Wales average, reflect the capital city premium that Cardiff commands within its own country.
Cardiff Economic Summary
- Population: 362,308 (2021 Census). Growth of 4.7% from 2011.
- Median annual salary: £36,946 (Cardiff), £36,354 (Wales), £39,125 (Great Britain)
- Employment rate: 74.5% (Cardiff), 72.7% (Wales), 75.6% (Great Britain)
- Unemployment rate: 6.2% (Cardiff), 4.3% (Wales), 4.3% (Great Britain)
- Key employment sectors: Public administration, healthcare, higher education, financial services, media and creative
Source: ONS Census 2021, Nomis Labour Market Profile (ASHE 2025, Employment Oct 2024-Sep 2025)
Cardiff's unemployment rate of 6.2% is higher than both the Welsh (4.3%) and national (4.3%) averages. The employment rate of 74.5% sits between Wales (72.7%) and Great Britain (75.6%). That gap partly reflects the student population. Students are economically inactive, not unemployed, but the young graduate job-seeking population is larger. For buy-to-let investors, the key metric is tenant demand, and Cardiff's three universities, public sector employers, and growing population all point to sustained demand across the city's rental stock.
Source: Office for National Statistics - Population for Cardiff
Regeneration and Investment in Cardiff
Three major projects totalling over £400m are reshaping Cardiff's Bay waterfront, city centre, and transport infrastructure. The investment is concentrated in the southern quarter and the main rail gateway.
- Atlantic Wharf Indoor Arena (under construction, ~£250m): A 15,000-capacity arena in Cardiff Bay developed by Cardiff Council and Live Nation, with doors expected to open in late 2026. The wider Atlantic Wharf masterplan covers 30 acres and includes new homes, office space, hotels, and leisure facilities across four phases over seven years. Updates at Cardiff Newsroom.
- Cardiff Central Station Redevelopment (approved, £138.8m): A major overhaul of Cardiff's main railway station, funded by the UK Government (£77m), Cardiff Capital Region City Deal (£40m), and the Welsh Government (£21m). Construction begins spring 2026 with completion expected by 2029. The station serves 35,000 passengers daily. Updates at Global Railway Review.
- Canal Quarter (Phase 1 underway): A mixed-use regeneration of the city centre east, reopening the historic canal on Churchill Way with new public space, rain gardens, and an outdoor performance area. Future phases extend southward to connect with the Bay once the new arena opens. Updates at Business News Wales.

Cardiff Property Market Analysis
When Was the Last House Price Crash in Cardiff?
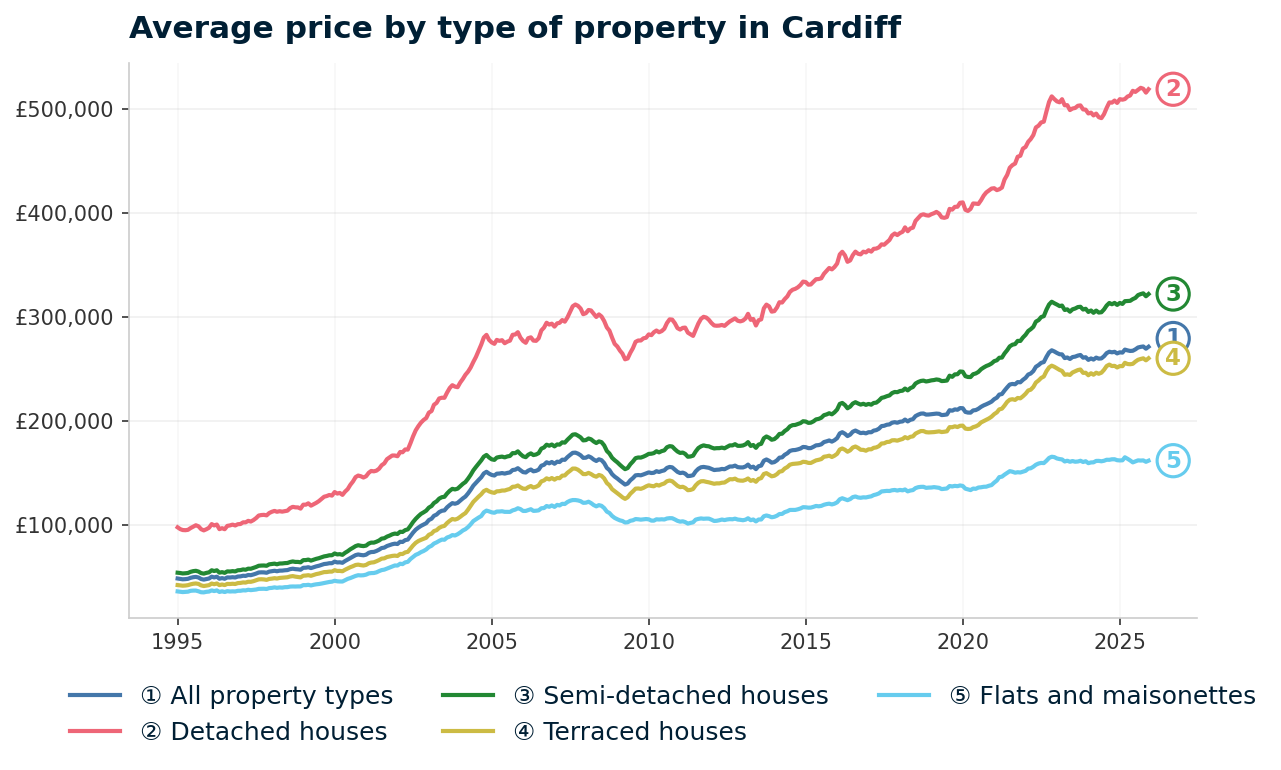
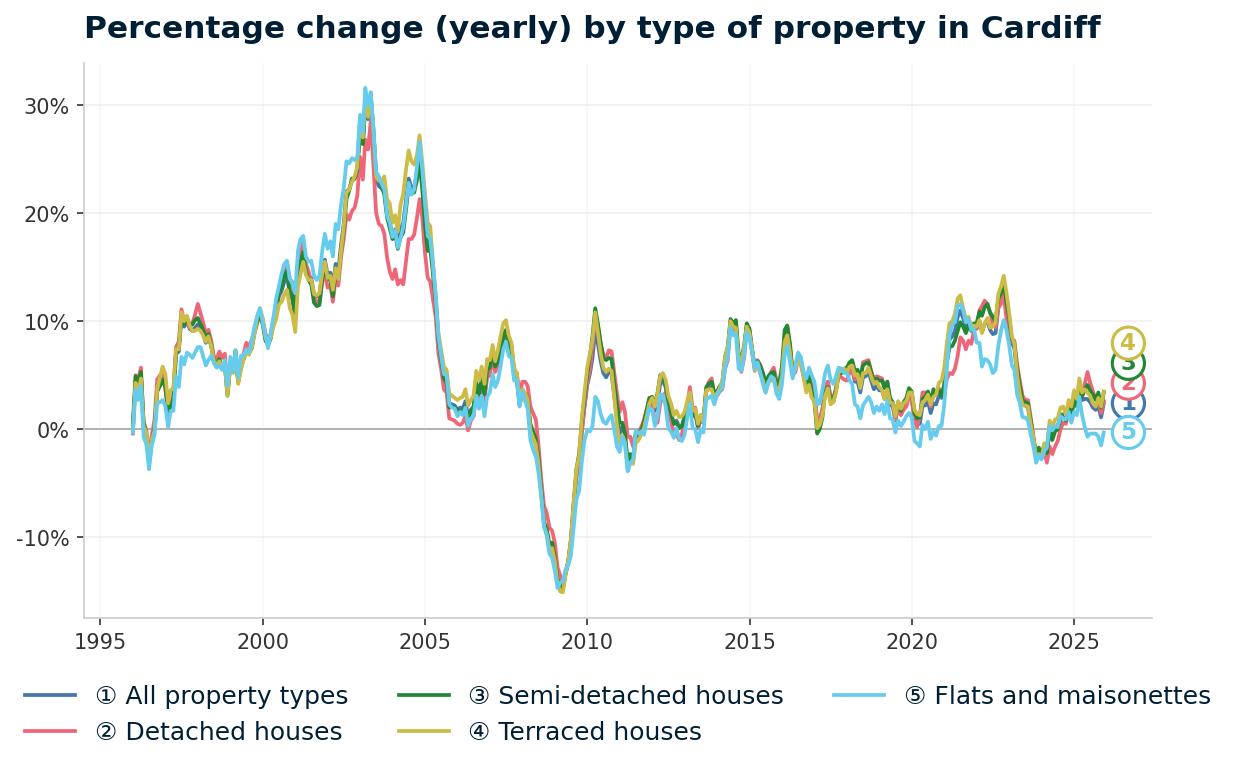
Cardiff lost 18.1% of its value between September 2007 and April 2009, took 6 years and 10 months to recover, and now sits 60.0% above that pre-crash peak. Cardiff falls under the Cardiff unitary authority, so all sold property prices from the HM Land Registry House Price Index are available at this level. The data runs from January 1995 to December 2025.
- 1995-2000 (Slow start): Cardiff began 1995 at £48,615. Prices rose steadily but unspectacularly, reaching £64,847 by January 2000. Annual growth stayed in single digits for most of this period. Cardiff's property market was quiet while London and the South East accelerated ahead.
- 2000-2007 (The boom): Cardiff caught up fast. Prices more than doubled from £64,847 in January 2000 to a peak of £169,539 in September 2007. The sharpest growth came in May 2003, when annual change hit 30.7%. Cheap credit, rising public sector employment, and Cardiff's growing reputation as a capital city all pushed prices well beyond what local wages could support.
- 2007-2009 (The financial crisis): From the peak of £169,539 in September 2007 to the trough of £138,867 in April 2009, Cardiff lost 18.1% of its value in 19 months. The worst annual change reading was -14.7% in April 2009. Cardiff's decline of 18.1% was almost identical to the Wales-wide drop of 18.1% and broadly in line with England's 18.2% and the UK's 18.7%.
- 2009-2013 (Recovery begins): Cardiff bounced relatively quickly off the trough. By December 2009, prices had recovered to £149,579. Growth continued into 2010-2013 but at a modest pace. By December 2013, the average sat at £159,917. Still 5.7% below the pre-crash peak, but closer to recovery than many comparable cities.
- 2014-2016 (Passing the peak): Annual growth picked up to around 9% in mid-2014. Prices passed the pre-crash peak of £169,539 in July 2014 at £171,190. That recovery took 6 years and 10 months from the September 2007 peak. Cardiff's capital city status and public sector employment base helped it recover faster than many smaller Welsh towns.
- 2017-2019 (Steady growth): Prices rose from £189,176 in January 2017 to £212,355 by December 2019. Consistent growth of around 3% per year. Not headline-grabbing, but the kind of stable appreciation that builds equity without overheating.
- 2020-2022 (Pandemic surge): The stamp duty holiday and remote working shift hit Cardiff's market hard. Prices jumped from £208,037 in March 2020 to £266,773 by December 2022. That is 28.2% growth in under three years. Cardiff's combination of green space, coastal proximity, and relative affordability versus Bristol and London made it a beneficiary of the lifestyle relocation trend.
- 2023 (Rate shock): Interest rate rises cooled the market. Prices dipped from £266,773 in December 2022 to £261,221 by December 2023. A decline of 2.1%. Brief and mild compared to the 2008 crash.
- 2024-2025 (Recovery): Prices stabilised and began rising again. The all-time high of £271,545 was reached in October 2025. By December 2025, the average sat at £271,273 with annual growth of 2.4%. Cardiff now sits 60.0% above its pre-crash peak.
Long-Term Property Value Growth in Cardiff
- 5 years (2020-2025): +24.1% (£218,537 to £271,273)
- 10 years (2015-2025): +49.5% (£181,439 to £271,273)
- 15 years (2010-2025): +79.6% (£151,084 to £271,273)
- 20 years (2005-2025): +77.7% (£152,669 to £271,273)
- 30 years (1995-2025): +463.8% (£48,113 to £271,273)
The 2008 crash is the reference point for Cardiff investors assessing downside risk. An 18.1% decline took just under 7 years to recover. But the recovery came faster than many comparable cities.
Cardiff's structural position is stronger now than in 2007. The Atlantic Wharf arena was not under construction. The Cardiff Capital Region City Deal did not exist. The three universities had fewer students. The risk profile has changed, even if property prices are never guaranteed.
Source: HM Land Registry House Price Index for Cardiff
Source: HM Land Registry House Price Index for Cardiff, January 1995 to December 2025.
Thinking of Buying?
We have off-market investment properties averaging 8%+ annual yield.
View Property DealsSold House Prices in Cardiff
The headline figure tells one story. The property type breakdown tells another. Cardiff's overall average of £271,273 sits 7.1% below England's £291,865. But that discount exists entirely in the flat market. Detached, semi-detached, and terraced houses in Cardiff all sell above the England average. The overall discount is a compositional effect driven by Cardiff's flat stock pricing.
Flats in Cardiff average £161,807. That is 26.2% below the England average of £219,340. Cardiff Bay and city centre developments account for a large share of flat transactions, and these sit well below London and South East pricing that inflates England's flat average. For investors targeting the flat market, Cardiff offers genuine value versus the England benchmark.
| Property Type | Cardiff Average | England Average | Difference |
|---|---|---|---|
| Detached houses | £518,673 | £471,667 | +10.0% |
| Semi-detached houses | £321,917 | £289,135 | +11.3% |
| Terraced houses | £260,207 | £244,830 | +6.3% |
| Flats and maisonettes | £161,807 | £219,340 | -26.2% |
| All property types | £271,273 | £291,865 | -7.1% |
Detached houses at £518,673 sit 10.0% above the England average. Cardiff has a limited supply of detached stock concentrated in the northern suburbs (CF14, CF15, CF23). Owner-occupier demand from professionals working in Cardiff's public sector and financial services pushes these prices above what you would find in most English cities outside London and the South East.
Semi-detached houses show the widest premium at 11.3% above England. At £321,917, Cardiff semis reflect the strong family housing market in suburbs like Whitchurch (CF14) and Llanishen. These are not investment-grade postcodes for most buy-to-let buyers. The yield data in later sections explains why.
Terraced houses average £260,207, a 6.3% premium over England. Victorian and Edwardian terraces in Cathays (CF24), Canton (CF11), and Splott are the backbone of Cardiff's rental stock. They command prices above the England average because of the city's university-driven demand and the strength of the South Wales economy.
Flats at £161,807 are where the value sits for investors. A 26.2% discount to the England average creates entry points that the house market cannot match. CF10 City Centre, where the asking price averages £187,680, is dominated by flat stock. That is where the two highest-yielding postcodes operate.
Property Data Sources
Our location guide relies on diverse, authoritative datasets including:
- HM Land Registry UK House Price Index
- Ministry of Housing, Communities and Local Government
- Ordnance Survey Data Hub
- Propertydata.co.uk
We update our property data quarterly to ensure accuracy. Last update: April 2026. All data is presented as provided by our sources without adjustments or amendments.
Price Per Square Foot in Cardiff
Where is space cheapest in Cardiff? CF10 at £252 per square foot costs 26% less than CF14 at £339, yet both sit within the same city boundary. Price per square foot strips out size bias. A postcode might look expensive simply because it has larger properties. This table shows what you are actually paying for space.
The two cheapest postcodes per square foot (CF10 and CF24) are also the two highest-yielding. That alignment is not always the case.
| Rank | Area | Price Per Sq Ft |
|---|---|---|
| 1 | CF10 (City Centre, Cardiff Bay) | £252 |
| 2 | CF24 (Roath, Cathays, Splott) | £263 |
| 3 | CF3 (Rumney, St Mellons) | £277 |
| 4 | CF11 (Canton, Pontcanna) | £289 |
| 5 | CF5 (Ely, Fairwater) | £302 |
| 6 | CF23 (Penylan, Cyncoed, Pontprennau) | £314 |
| 7 | CF15 (Radyr, Tongwynlais) | £325 |
| 8 | CF14 (Whitchurch, Heath, Llandaff North) | £339 |
CF10 at £252 per square foot is the cheapest space in Cardiff. This is the city centre and Cardiff Bay postcode where flat stock dominates. The lower per-foot cost combined with the 7.3% yield makes CF10 the postcode where the numbers work hardest for buy-to-let. Based on 297 analysed transactions.
CF14 at £339 per square foot is the most expensive. Whitchurch, Heath, and Llandaff North are family suburbs where larger detached and semi-detached homes push up the per-foot rate. CF14 also has the highest sales volume in Cardiff (65 per month), confirming deep owner-occupier demand. Based on 1,269 analysed transactions, the largest sample in the dataset.
The mid-range postcodes (CF3 to CF23, £277 to £314) sit close together. There is no single outlier distorting the picture. For investors, the spread between the cheapest and most expensive square foot in Cardiff is 34.5%. In many cities, that ratio exceeds 2x.
Figures reflect averages across all property types and ages. Individual values depend on condition, location within the postcode, and building age.
For Sale Asking Prices in Cardiff
Cardiff's cheapest postcode (CF10, £187,680) costs less than half the most expensive (CF15, £421,036). That 2.2x spread defines where different investor strategies play out. Asking prices reflect what sellers and agents expect the market to pay, and in Cardiff the two postcodes delivering 7.3% yield both sit under £245,000.
| Rank | Area | Average Asking Price |
|---|---|---|
| 1 | CF10 (City Centre, Cardiff Bay) | £187,680 |
| 2 | CF24 (Roath, Cathays, Splott) | £244,678 |
| 3 | CF11 (Canton, Pontcanna) | £248,595 |
| 4 | CF3 (Rumney, St Mellons) | £303,725 |
| 5 | CF5 (Ely, Fairwater) | £327,829 |
| 6 | CF23 (Penylan, Cyncoed, Pontprennau) | £355,500 |
| 7 | CF14 (Whitchurch, Heath, Llandaff North) | £380,763 |
| 8 | CF15 (Radyr, Tongwynlais) | £421,036 |
Three postcodes cluster between £187,680 and £248,595. CF10, CF24, and CF11 all sit under £250,000. These are the inner-city postcodes where rental demand is strongest: students, young professionals, and city centre workers. The £57,000 gap between CF10 and CF24 buys access to a dramatically different tenant profile. CF10 is flat-dominated city centre stock. CF24 is the student and young professional heartland of Cathays and Roath, where terraced houses and converted HMOs drive rents to £1,498 per month.
CF15 Radyr at £421,036 is the most expensive postcode. Radyr and Tongwynlais sit on Cardiff's north-western fringe, close to the M4 corridor. This is commuter territory where larger family homes attract owner-occupiers rather than tenants. The 3.1% yield and lowest rent in Cardiff (£1,104) confirm that CF15 is not a cash-flow postcode.
The mean asking price across all eight Cardiff postcodes is £308,726. That figure appears in the comparison section later, where Cardiff is measured against Swansea, Newport, Bristol, and Bath. Investors looking for lower entry points may also find renovation property for sale in the sub-£250,000 postcodes.

House Price Growth in Cardiff
Four of Cardiff's eight postcodes delivered five-year growth above 17%, with CF24 leading at 19.1%. An investor who bought a £205,000 property in CF24 in 2020 is now looking at a postcode asking £244,678. But the one-year figures tell a different story. Six of eight postcodes show negative or flat one-year growth. Cardiff's market has cooled from the pandemic surge.
| Area | 1 Year | 3 Years | 5 Years |
|---|---|---|---|
| CF24 (Roath, Cathays, Splott) | 2.0% | 5.7% | 19.1% |
| CF14 (Whitchurch, Heath, Llandaff North) | 0.0% | -0.8% | 19.0% |
| CF3 (Rumney, St Mellons) | -3.0% | -0.4% | 17.9% |
| CF5 (Ely, Fairwater) | 0.2% | -4.6% | 17.9% |
| CF15 (Radyr, Tongwynlais) | -0.3% | -2.5% | 8.1% |
| CF23 (Penylan, Cyncoed, Pontprennau) | -9.0% | -5.8% | 7.6% |
| CF11 (Canton, Pontcanna) | -1.4% | -1.9% | 7.4% |
| CF10 (City Centre, Cardiff Bay) | -4.4% | 8.6% | 0.3% |
CF24 is the only postcode showing positive growth across all three time periods. One-year growth of 2.0%, three-year growth of 5.7%, and five-year growth of 19.1%. That consistency matters. CF24 delivers the joint-highest yield in Cardiff (7.3%) and the strongest growth. No other postcode combines both.
CF23 Penylan at -9.0% one-year growth is the sharpest recent decline. Cyncoed and Pontprennau are premium residential areas where larger houses saw their prices inflate during the pandemic. The correction has been steeper here than anywhere else in Cardiff. Five-year growth of 7.6% confirms the gains were front-loaded into 2020-2022 and have since reversed.
CF10 at 0.3% five-year growth is essentially flat over five years. City centre flat stock has not participated in the broader Cardiff price surge. Three-year growth of 8.6% suggests a mid-period bounce followed by a pullback. CF10's strength is yield (7.3%), not capital growth. Investors here are buying for income, not appreciation.
Monthly Property Sales in Cardiff
Cardiff moves 314 properties per month across all eight postcodes, with CF14 alone accounting for 65 of those. For buy-to-let investors, this is an exit strategy question. High volume means a liquid market where you can sell when you need to. CF10 and CF15 share the lowest volume at 19 per month each.
| Area | Sales Per Month | Turnover | Asking Price |
|---|---|---|---|
| CF14 (Whitchurch, Heath, Llandaff North) | 65 | 18% | £380,763 |
| CF5 (Ely, Fairwater) | 59 | 48% | £327,829 |
| CF24 (Roath, Cathays, Splott) | 45 | 17% | £244,678 |
| CF11 (Canton, Pontcanna) | 41 | 15% | £248,595 |
| CF23 (Penylan, Cyncoed, Pontprennau) | 36 | 15% | £355,500 |
| CF3 (Rumney, St Mellons) | 30 | 13% | £303,725 |
| CF10 (City Centre, Cardiff Bay) | 19 | 15% | £187,680 |
| CF15 (Radyr, Tongwynlais) | 19 | 161% | £421,036 |
CF5 Ely and Fairwater at 48% turnover with 59 sales per month stands out. High turnover combined with high volume means properties move quickly in this market. Ely and Fairwater are affordable residential areas where first-time buyers and investors compete for terraced and semi-detached stock. For exit strategy planning, CF5 offers the most liquid market in Cardiff after CF14.
CF15 Radyr shows a turnover figure of 161%. With only 19 sales per month, this anomalous reading likely reflects a small stock base rather than exceptional market activity. Radyr is a small commuter village. The turnover metric is less meaningful at this volume level.
CF10 at 19 sales per month is the thinnest market. City centre flat transactions are lower than you might expect, which matters for liquidity. If you buy in CF10 for the 7.3% yield, factor in that the resale market is shallower than suburban postcodes.
Property Data Sources
Our location guide relies on diverse, authoritative datasets including:
- HM Land Registry UK House Price Index
- Ministry of Housing, Communities and Local Government
- Ordnance Survey Data Hub
- Propertydata.co.uk
We update our property data quarterly to ensure accuracy. Last update: April 2026. All data is presented as provided by our sources without adjustments or amendments.

Cardiff Rental Market Analysis
For investors weighing up whether rental property is a worthwhile investment in Cardiff, the data below breaks down average monthly rents and gross rental yields across the city's postcodes.
Rental data is available for all 8 postcodes. Monthly rents range from £1,104 in CF15 to £1,498 in CF24 and gross yields range from 3.1% to 7.3%. If you are looking to build a property portfolio in Wales, Cardiff's combination of capital city tenant demand and two postcodes at 7.3% yield makes it a starting point worth examining. Browse our range of buy-to-let properties for sale.
Average Rent & Gross Rental Yields in Cardiff
Gross rental yield is calculated from the average asking price and average monthly rent for each postcode. It does not account for void periods, maintenance, management fees, or mortgage costs. It is a starting point for comparison, not a profit forecast.
CF10 and CF24 both deliver 7.3% gross yield, but they get there by different routes. CF10 City Centre does it through low prices (£187,680 asking) with moderate rents (£1,140). CF24 Cathays does it through high rents (£1,498, the highest in Cardiff) against a mid-range price (£244,678). Same yield, different mechanics, different tenant profiles.
| Area | Average Monthly Rent | Average Asking Price | Gross Yield |
|---|---|---|---|
| CF10 (City Centre, Cardiff Bay) | £1,140 | £187,680 | 7.3% |
| CF24 (Roath, Cathays, Splott) | £1,498 | £244,678 | 7.3% |
| CF11 (Canton, Pontcanna) | £1,150 | £248,595 | 5.5% |
| CF3 (Rumney, St Mellons) | £1,226 | £303,725 | 4.8% |
| CF5 (Ely, Fairwater) | £1,213 | £327,829 | 4.4% |
| CF14 (Whitchurch, Heath, Llandaff North) | £1,291 | £380,763 | 4.1% |
| CF23 (Penylan, Cyncoed, Pontprennau) | £1,159 | £355,500 | 3.9% |
| CF15 (Radyr, Tongwynlais) | £1,104 | £421,036 | 3.1% |
Three postcodes sit above 5% gross yield: CF10, CF24, and CF11. CF11 Canton and Pontcanna at 5.5% occupies the middle ground. It is a desirable residential area with a mix of Victorian terraces and professional tenants. Rents of £1,150 against asking prices of £248,595 produce a yield that holds up without relying on student HMO premiums.
CF24's £1,498 average rent is £358 per month more than CF10's £1,140. That gap reflects what Cathays commands as the primary student and young professional rental market in Cardiff. Many properties in CF24 are let as shared houses or HMOs, pushing per-property rental income above single-let averages. The headline rent figure captures this.
CF15 at 3.1% is where yields compress to levels that do not cover mortgage costs for most mortgaged investors. Radyr's asking prices of £421,036 absorb rents of just £1,104. This is owner-occupier territory on the edge of Cardiff. The numbers work for capital growth strategies over a long hold but not for income.
Is Cardiff Rent High?
Every Cardiff postcode sits above the 30% affordability benchmark, with rent consuming between 35.9% and 48.7% of the local median gross monthly salary. For tenants, that determines whether they can sustain payments long-term. For landlords, areas where rent consumes a lower share of income tend to produce more reliable tenants and fewer arrears.
The median gross weekly salary in Cardiff is £710.50, which equates to £3,079 per month or £36,946 per year. This is above the Wales regional median of £699.10 per week but below the Great Britain median of £752.40 per week. Data from the Nomis Labour Market Profile (ASHE 2025).
That reflects Cardiff's relatively high rents for the level of local wages, driven by student and professional demand that is not fully captured by the median salary figure.
| Rank | Area | Rent as % of Income |
|---|---|---|
| 1 | CF24 (Roath, Cathays, Splott) | 48.7% |
| 2 | CF14 (Whitchurch, Heath, Llandaff North) | 41.9% |
| 3 | CF3 (Rumney, St Mellons) | 39.8% |
| 4 | CF5 (Ely, Fairwater) | 39.4% |
| 5 | CF23 (Penylan, Cyncoed, Pontprennau) | 37.7% |
| 6 | CF11 (Canton, Pontcanna) | 37.3% |
| 7 | CF10 (City Centre, Cardiff Bay) | 37.0% |
| 8 | CF15 (Radyr, Tongwynlais) | 35.9% |
CF24 at 48.7% looks stretched. But this figure uses the Cardiff-wide median salary (£36,946). CF24 Cathays is the student rental heartland. Many CF24 rents are paid through shared tenancies or by students funded by maintenance loans, bursaries, or family support. The median salary benchmark understates what the actual tenant base can afford in this postcode.
CF15 at 35.9% is technically the most affordable, yet it has Cardiff's lowest rent at £1,104. Radyr tenants tend to be professionals on above-median incomes who choose to rent in a commuter village. The affordability pressure is lower here because the tenant demographic earns above the city-wide figure.
The cluster between 37.0% and 41.9% (CF10 through CF14) covers most of the city. For investors, the consistent affordability picture across six of eight postcodes suggests that rents are not at risk of a sharp correction. Tenants across most of Cardiff are paying similar proportions of income, which distributes the affordability pressure evenly.
Thinking of Buying?
We have off-market investment properties averaging 8%+ annual yield.
View Property DealsBuy-to-Let Considerations
Are Cardiff House Prices High? Price-to-Earnings Ratios
The price-to-earnings ratio compares a postcode's average asking price to the local median annual salary. Lower ratios mean more affordable entry points relative to local wages. The national benchmark is 7.5x, calculated from England's average sold price of £291,865 against Great Britain's median annual salary of £39,125.
Purchasing a property in Cardiff requires between 5.1 and 11.4 times the median annual salary. This is based on the Nomis Labour Market Profile for Cardiff showing the median gross annual income for Cardiff residents is £36,946.
Three of Cardiff's eight postcodes sit below the national benchmark of 7.5x. CF10 at 5.1x, CF24 at 6.6x, and CF11 at 6.7x. These are the same three postcodes that deliver yields above 5%. That alignment of affordable entry and strong income is where the data converges.
| Rank | Area | Price-to-Earnings Ratio |
|---|---|---|
| 1 | CF10 (City Centre, Cardiff Bay) | 5.1x |
| 2 | CF24 (Roath, Cathays, Splott) | 6.6x |
| 3 | CF11 (Canton, Pontcanna) | 6.7x |
| 4 | CF3 (Rumney, St Mellons) | 8.2x |
| 5 | CF5 (Ely, Fairwater) | 8.9x |
| 6 | CF23 (Penylan, Cyncoed, Pontprennau) | 9.6x |
| 7 | CF14 (Whitchurch, Heath, Llandaff North) | 10.3x |
| 8 | CF15 (Radyr, Tongwynlais) | 11.4x |
CF10 at 5.1x is the most affordable entry point in Cardiff relative to local wages. This is also the postcode with the joint-highest yield (7.3%) and the lowest asking price (£187,680). The data here is unambiguous across every metric.
CF15 at 11.4x sits 52% above the national benchmark. Radyr prices reflect commuter demand from professionals earning well above the Cardiff median. The ratio overstates the affordability pressure because the actual buyers and tenants in this postcode are not on median wages.
For investors comparing across Wales, Cardiff's sub-7.5x postcodes are competitive with entry points in cheaper Welsh locations while offering the tenant depth and infrastructure of a capital city.
Deposit Requirements in Cardiff
Cardiff's entry costs range from £56,304 in CF10 to £126,311 in CF15, with three postcodes under £75,000. The standard buy-to-let deposit is 30%. The table below reflects this benchmark, which unlocks better interest rates and a wider range of mortgage products. That puts Cardiff's cheapest buy-to-let entry at roughly half the deposit needed for Bristol.
| Rank | Area | 30% Deposit Required |
|---|---|---|
| 1 | CF10 (City Centre, Cardiff Bay) | £56,304 |
| 2 | CF24 (Roath, Cathays, Splott) | £73,403 |
| 3 | CF11 (Canton, Pontcanna) | £74,579 |
| 4 | CF3 (Rumney, St Mellons) | £91,118 |
| 5 | CF5 (Ely, Fairwater) | £98,349 |
| 6 | CF23 (Penylan, Cyncoed, Pontprennau) | £106,650 |
| 7 | CF14 (Whitchurch, Heath, Llandaff North) | £114,229 |
| 8 | CF15 (Radyr, Tongwynlais) | £126,311 |
The £17,099 gap between CF10 (£56,304) and CF24 (£73,403) buys a meaningfully different profile. Both postcodes deliver 7.3% yield. CF10 requires less capital but has flat five-year growth (0.3%) and a thinner resale market (19 sales per month). CF24 costs more to enter but has delivered 19.1% five-year growth and double the transaction volume (45 per month).
A clear gap separates the sub-£75,000 tier from the rest. CF3 at £91,118 is the next step up. Five postcodes require deposits above £90,000, and three exceed £100,000. For investors with limited capital, the three cheapest postcodes (CF10, CF24, CF11) all deliver yields between 5.5% and 7.3%.
Deposit is only part of the upfront cost. Cardiff is in Wales, so Land Transaction Tax applies instead of England's stamp duty. Use our Welsh Land Transaction Tax calculator for an accurate figure. Budget also for legal fees, survey costs, and any refurbishment. For a full breakdown, see our guide to buy-to-let costs.
Investors looking for properties below current market value may want to explore below market value properties or repossessed houses for sale. For those exploring ways to enter the market with less capital, see our guide on how to buy a buy to let property with no deposit.

What the Cardiff Data Tells Buy-to-Let Investors
For yield, the numbers favour CF10 (7.3%) and CF24 (7.3%), with CF11 (5.5%) as a lower-maintenance alternative. CF10 offers the lowest entry deposit at £56,304 with a price-to-earnings ratio of 5.1x. CF24 commands Cardiff's highest rent at £1,498 and has the strongest five-year growth at 19.1%. CF11 splits the difference with professional tenants, moderate yields, and stable pricing. All three sit below the 7.5x national affordability benchmark.
For growth, CF24 (19.1%), CF14 (19.0%), and CF3/CF5 (17.9% each) lead over five years. CF24 is the only postcode that also delivers a top yield, making it the postcode where income and growth converge. CF14 and CF5 show stronger growth but yields below 4.5%. Short-term growth across most of Cardiff has stalled, with six of eight postcodes flat or negative over the past year.
CF23 has seen the sharpest one-year decline at -9.0%, alongside negative three-year growth of -5.8%. Cyncoed and Pontprennau prices rose sharply during the pandemic and have corrected further than any other Cardiff postcode. CF10's near-flat five-year growth (0.3%) confirms that city centre flat stock has not participated in the broader Cardiff price surge.
Cardiff's rental market operates under Welsh Government rental regulations, including Renting Homes (Wales) Act requirements. Investors can check whether additional licensing applies via selective licensing schemes. For those looking at investment properties or exploring property investment more broadly, Cardiff's data profile shows clear differentiation across postcodes.
How Cardiff Buy-to-Let Compares to Nearby Areas
Cardiff's mean asking price of £308,726 sits between Newport (£272,487) and Bristol (£372,904), with a top yield of 7.3% that beats Newport's 5.5% and trails only Swansea's 8.8% and Bristol's 8.2%. Investors looking at Cardiff are typically also considering other Welsh cities and Bristol across the border. The table below compares all five using the same methodology.
| Location | Mean Asking Price | Mean Monthly Rent | Top Gross Yield |
|---|---|---|---|
| Swansea | £250,854 | £1,233 | 8.8% |
| Newport | £272,487 | £1,037 | 5.5% |
| Cardiff | £308,726 | £1,223 | 7.3% |
| Bristol | £372,904 | £1,777 | 8.2% |
| Bath | £450,726 | £1,782 | 5.8% |
Cardiff sits in the middle of this group on price but its top yield of 7.3% is competitive. Swansea offers a lower entry price (£250,854 mean) and a higher top yield (8.8% in SA1), but only 4 of its 8 postcodes have rental data. Newport is cheaper still at £272,487 but its top yield of 5.5% is well below Cardiff's peak.
Bristol shows a higher top yield (8.2%) but requires substantially more capital. Bristol's mean asking price of £372,904 means a 30% deposit averaging over £111,000. Cardiff's two 7.3% yield postcodes are accessible from £56,304. Bath is the most expensive in this group at £450,726 mean, with a top yield of 5.8% that does not justify the capital premium for income-focused investors.
Cardiff's position as the Welsh capital gives it a tenant depth that Swansea and Newport cannot match. Three universities, the Welsh Government, and BBC Wales create a diverse demand base. For investors looking at the best buy-to-let areas in the UK, Cardiff's combination of sub-£250,000 entry points at 7.3% yield with capital city infrastructure is a data profile that few Welsh or West of England locations replicate.
Frequently Asked Questions
How does buy to let in Wales differ from England?
Wales has its own property tax (Land Transaction Tax instead of SDLT), different tenancy laws, and a mandatory landlord registration scheme. The Renting Homes (Wales) Act 2016 replaced assured shorthold tenancies with "occupation contracts" and introduced six-month minimum notice periods for no-fault evictions. Landlords must register with Rent Smart Wales and hold a licence to manage rental properties. These regulatory differences affect operating costs and tenant management processes. Cardiff's yields of up to 7.3% are competitive with English cities despite the additional requirements.
What are the best areas in Cardiff for property investment?
CF10 and CF24 both deliver the highest gross yield in Cardiff at 7.3%, with the lowest asking prices in the city. CF10 (City Centre, Cardiff Bay) at £187,680 requires a 30% deposit of £56,304. CF24 (Roath, Cathays, Splott) at £244,678 commands Cardiff's highest rent (£1,498/month) and has the strongest five-year growth (19.1%). CF11 (Canton, Pontcanna) at 5.5% yield sits between the high-yield inner-city postcodes and the lower-yield suburbs. CF15 (Radyr) at 3.1% and CF23 (Penylan, Cyncoed) at 3.9% show the data profile of owner-occupier markets rather than rental-income markets.
Are there property investment companies operating in Cardiff?
Several firms market buy-to-let and off-plan properties in Cardiff, particularly new-build apartments in Cardiff Bay and the city centre. The data in this guide covers the open market across all 8 postcodes. Any property sold through an investment company can be benchmarked against these postcode-level figures on price, rent, and yield, but average values do not guarantee the price of any individual property. For broader options, you can browse off-market property opportunities.
Is student accommodation a strong rental market in Cardiff?
Cardiff's three universities support a combined student population of around 50,000, concentrated in CF24 (Cathays) and parts of CF10. Cardiff Metropolitan University has around 11,000 students, Cardiff University around 33,000, and the University of South Wales operates a Cardiff campus. CF24 already shows the highest average rent in Cardiff at £1,498/month, partly reflecting shared tenancies and HMO lets. Seasonal void risk applies during summer months. For a broader view of the sector, see our guide to purpose-built student accommodation.
What about apartments for rent in Cardiff Bay and the city centre?
Cardiff Bay and city centre apartments sit primarily in CF10, which has the lowest asking price in the city at £187,680 and a gross yield of 7.3%. Flats in Cardiff average £161,807 at the Land Registry level, 26.2% below the England average for flats (£219,340). CF10 is dominated by flat stock, from purpose-built developments along the Bay waterfront to converted buildings in the city centre. Monthly rents average £1,140 with 19 sales per month. The thinner transaction volume means the resale market is shallower than suburban postcodes, but for investors targeting apartments in Cardiff, CF10 is where the yield and price data converge.
When will the Atlantic Wharf arena affect Cardiff property prices?
The 15,000-capacity indoor arena in Cardiff Bay is under construction and expected to open in late 2026. The wider Atlantic Wharf masterplan covers 30 acres across four phases over seven years, including new homes, office space, and hotels. The immediate impact is likely concentrated in CF10 (Cardiff Bay) and neighbouring CF11 (Canton). CF10 currently shows 7.3% yield but flat five-year growth of just 0.3%. Whether the arena changes that growth trajectory depends on how quickly the surrounding phases deliver. This is a multi-year programme, not a short-term catalyst.